-
-

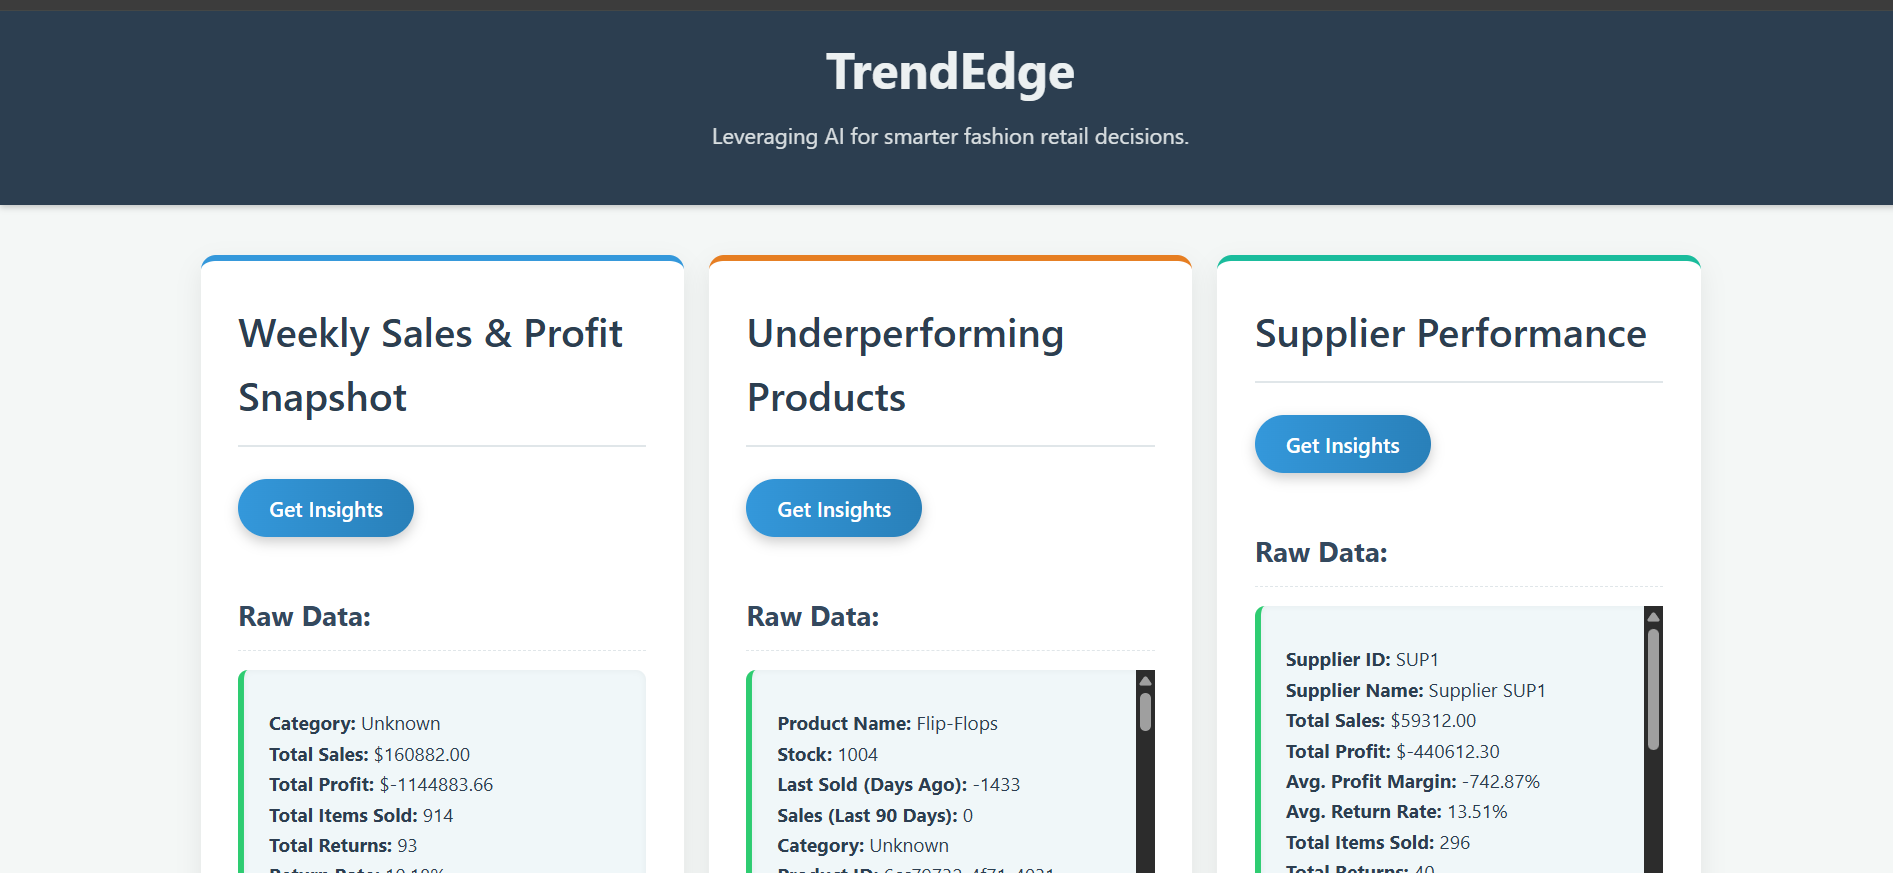
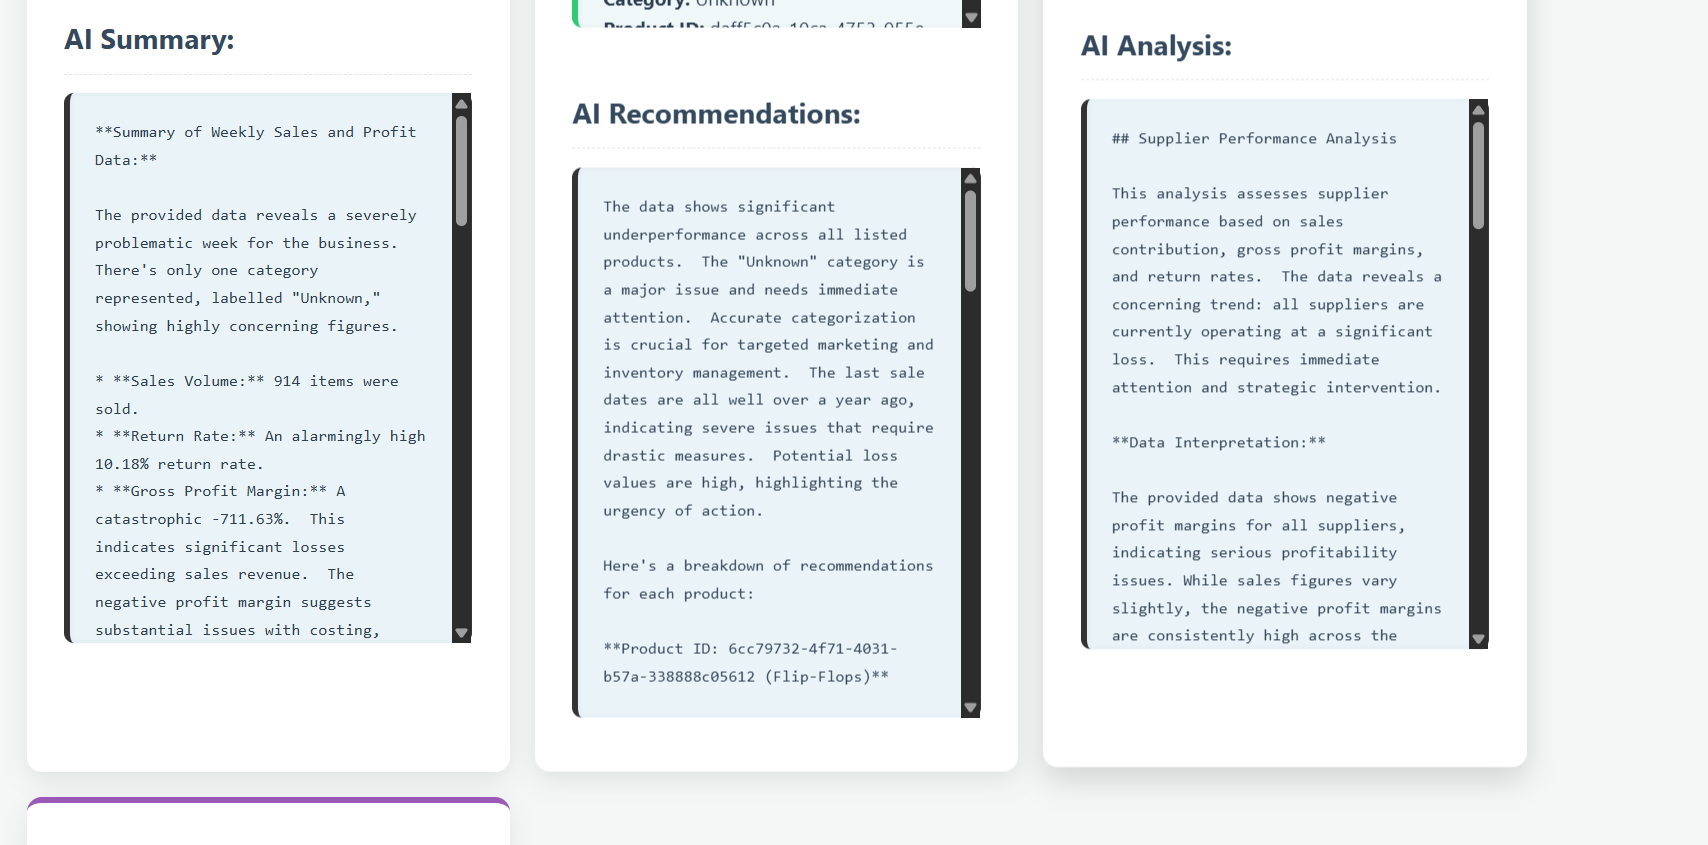
#insights to know how the product is doing
-
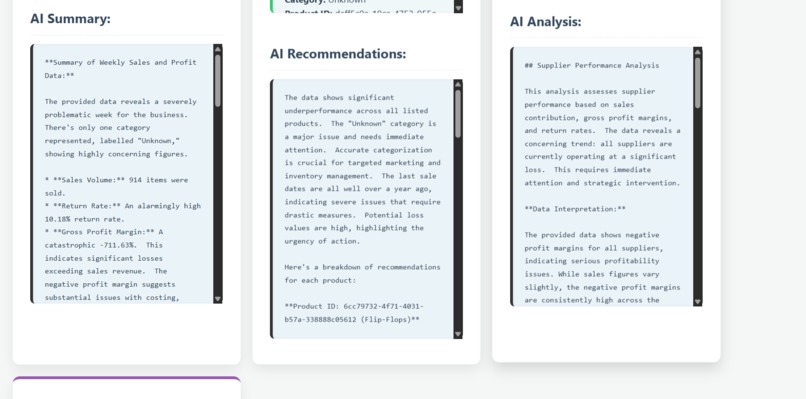
#Ai recommendation to bring sales on line .
My Project Journey: TrendEdge AI Analytics Dashboard
This project, the TrendEdge AI Analytics Dashboard, has been an exciting and challenging endeavor, aiming to empower fashion buyers with actionable insights derived from their sales data using the power of AI.
Inspiration
The primary inspiration for this project stemmed from the real-world need for businesses, especially in dynamic sectors like fashion retail, to make data-driven decisions quickly. Traditional analytics can provide raw numbers, but often lack the deeper context or proactive recommendations that a buyer truly needs to optimize inventory, improve profitability, and react to market trends. I envisioned a tool that could not only present key performance indicators but also "think" like an expert, offering strategic advice on underperforming products, supplier efficiency, and emerging trends, all powered by large language models. The goal was to bridge the gap between raw data and actionable business intelligence.
What it does
TrendEdge AI Analytics Dashboard is an AI-powered platform designed to help fashion buyers make smarter, data-driven decisions. It provides intelligent insights and actionable recommendations across key business areas:
---Sales & Profit Snapshot: Summarizes weekly sales and profit, highlighting top-performing categories.
---Underperforming Products: Identifies high-stock, low-sale products and suggests mitigation strategies.
---Supplier Performance: Analyzes supplier contributions, margins, and return rates, pinpointing valuable and problematic partners.
---Trend Analysis: Detects and analyzes emerging fashion trends based on product data, suggesting new sourcing opportunities.
By transforming raw data into clear, actionable intelligence, TrendEdge Analytics aims to optimize inventory, improve profitability, and enable proactive market responses.
How we built it
The project was built using a MERN stack (MongoDB, Express.js, React.js, Node.js) with the addition of the Google Gemini API for intelligence.
Backend (Node.js, Express.js, MongoDB):
---Data Model: Defined Mongoose schemas for Product and Sale to structure the MongoDB data.
---Data Import: Created a script to import the fashion_sales.csv data into MongoDB Atlas, ensuring clean and usable data.
Analytics Module (src/analytics.js): Developed functions using Mongoose aggregation pipelines to extract key business insights (sales snapshot, underperforming products, supplier performance, trend-matching products). Date filtering logic was adapted to the dataset's timeframe.
AI Service Module (src/ai_service.js): Implemented functions to interact with the Google Gemini API. These functions take the raw data from the analytics module, format it into a prompt, and send it to the Gemini model (gemini-1.0-pro) to generate human-readable summaries and recommendations. The node-fetch polyfill was crucial here for Node.js v16 compatibility.
API Server (app.js): Transformed the main app.js into an Express.js server. It defines various GET API endpoints (e.g., /api/sales-snapshot, /api/underperforming-products, /api/trend-analysis) that:
Call the relevant analytics function to fetch raw data.
Pass this raw data to the AI service function for intelligent analysis.
Return both the raw data (for display) and the AI insights as JSON responses to the frontend. CORS middleware was essential for cross-origin communication.
Frontend (React.js, Vite, Chart.js):
Project Setup: Used Vite to quickly scaffold the React application (frontend-react).
Component Structure (App.jsx): The core dashboard logic resides in App.jsx. It uses React Hooks (useState for managing data and UI state, useEffect for side effects).
Data Fetching: Implemented async/await functions to call the backend API endpoints using the fetch API.
State Management: Managed local state for raw data, AI insights, chart data, and selected chart types for each dashboard section.
Data Visualization: Integrated react-chartjs-2 to create dynamic charts. Data fetched from the backend is processed and transformed into the specific format required by Chart.js. Users can select different chart types (Bar, Line, Doughnut, Radar, Polar Area) to visualize the same data differently.
User Interface (UI) & Presentation: Designed a clean, responsive UI with CSS. Focused on presenting both the raw data (in a readable list format instead of raw JSON) and the AI insights clearly, side-by-side with the interactive charts, creating a comprehensive overview for the user.
Challenges we ran into
This project presented several significant challenges:
Data Quality and Granularity: The provided fashion_sales.csv dataset, while useful, sometimes lacked the depth for very rich AI analysis or specific visualizations. For example, "Leggings" products might have existed, but without detailed material, description, or category fields, the AI couldn't provide deep trend analysis beyond basic counts.
Mitigation: Adapted the AI prompts and data processing to work with available data, and implemented client-side data rendering to gracefully handle sparse data. The AI was trained to acknowledge "Insufficient data" when necessary.
Real-time AI Integration: Ensuring the Gemini API calls were robust, handled potential network errors, and provided fallback messages was crucial for a smooth user experience. Managing asynchronous operations and state updates in React to reflect loading, success, or error states for both data and AI responses added complexity.
Data Transformation for Charts: Converting the raw data (which was sometimes nested or required aggregation) into the specific labels and datasets format expected by Chart.js for various chart types required careful data processing logic within the React components.
Accomplishments that we're proud of
We are particularly proud of several accomplishments during this project:
Seamless AI Integration: Successfully integrated the Google Gemini API to transform complex data into easily digestible, actionable AI insights and recommendations for various business scenarios.
Interactive Data Visualization: Implemented dynamic charting capabilities with react-chartjs-2, allowing users to explore data through different chart types (Bar, Line, Doughnut, Radar, Polar Area) for a clearer understanding.
User-Centric Presentation: Designed a clean and intuitive user interface that makes complex analytics and AI recommendations accessible, providing both formatted raw data and AI summaries for comprehensive insights.
What we learned
This project was a rich learning experience, pushing my understanding in several key areas:
Full-Stack Integration: I gained a much deeper understanding of how to connect distinct backend (Node.js/Express.js/MongoDB) and frontend (React.js) services. Managing data flow, API design, and ensuring secure communication between these layers was a significant learning curve.
MongoDB Aggregation Pipelines: For the analytics module, I delved into complex MongoDB aggregation pipelines to transform raw sales data into meaningful insights (like weekly summaries, underperformers, and supplier metrics). This involved mastering $group, $match, $project, $lookup, and $unwind stages to shape the data precisely as needed.
Google Gemini API Integration: Implementing the AI insights was a highlight. I learned how to effectively use the Google Gemini API (specifically the gemini-1.0-pro model) to interpret structured data and generate human-like, actionable recommendations. Crafting effective prompts to elicit the desired analytical summaries and suggestions from the LLM was key.
Frontend Data Visualization with React & Chart.js: Building the interactive dashboard with React and react-chartjs-2 taught me how to prepare and transform structured data into various chart types (Bar, Line, Doughnut, Radar, Polar Area). I learned about state management in React to handle user interactions (like changing chart types) and dynamically update the visualizations.
What's next for TrendEdge Analytics
Looking ahead, we envision enhancing TrendEdge Analytics with the following features:
---Predictive Analytics: Implement models to forecast future sales and trends, allowing buyers to anticipate market shifts even more accurately.
---Sentiment Analysis: Integrate social media and review data to gauge public sentiment around products and trends.
---Customizable Dashboards: Allow users to personalize their dashboard views, selecting specific metrics and AI insights relevant to their roles.
---Supplier Collaboration Module: Add features for direct communication and performance tracking with suppliers within the platform.
---Expanded Data Sources: Incorporate external market data, competitor analysis, and macroeconomic indicators for richer insights.
---Advanced Trend Detection: Utilize more sophisticated machine learning models for early detection of subtle, emerging fashion trends.

Log in or sign up for Devpost to join the conversation.