-
-
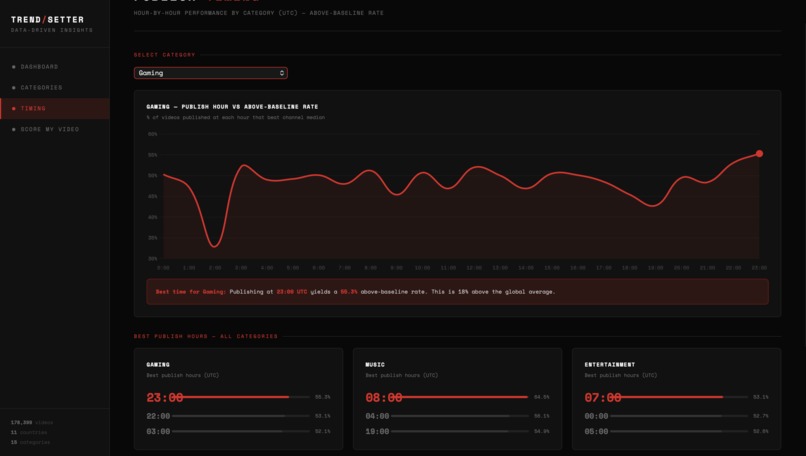
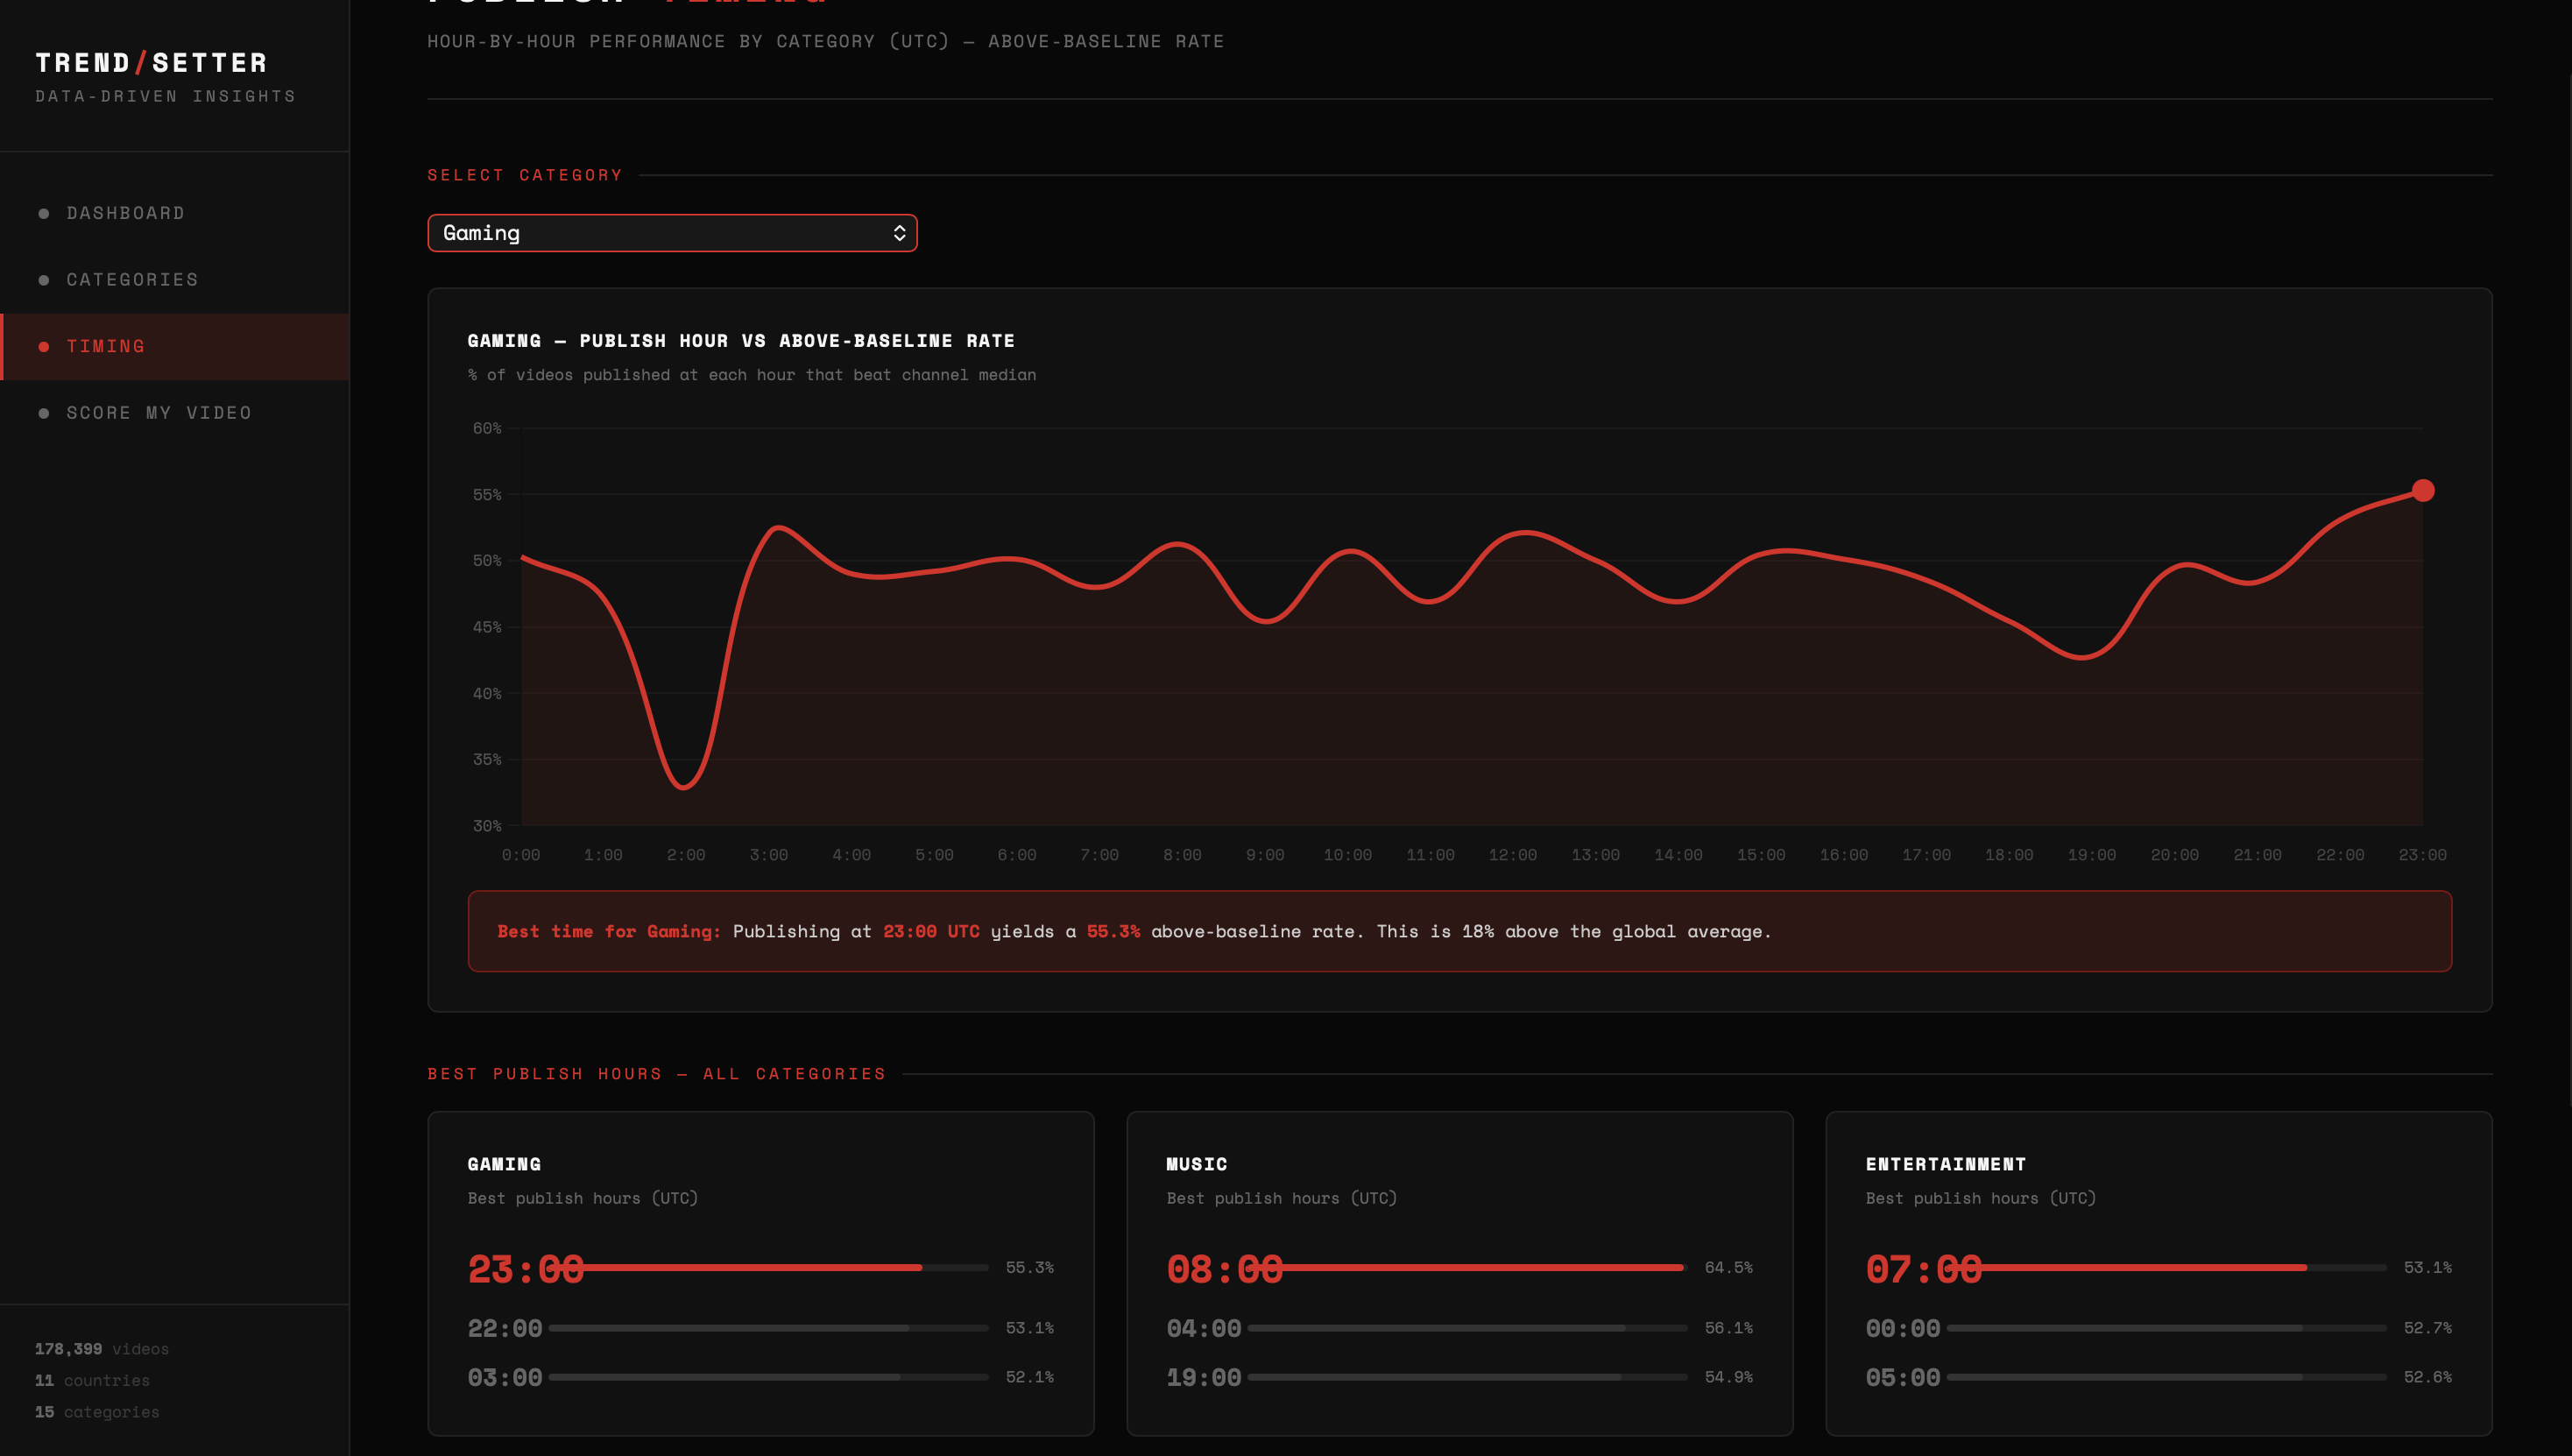
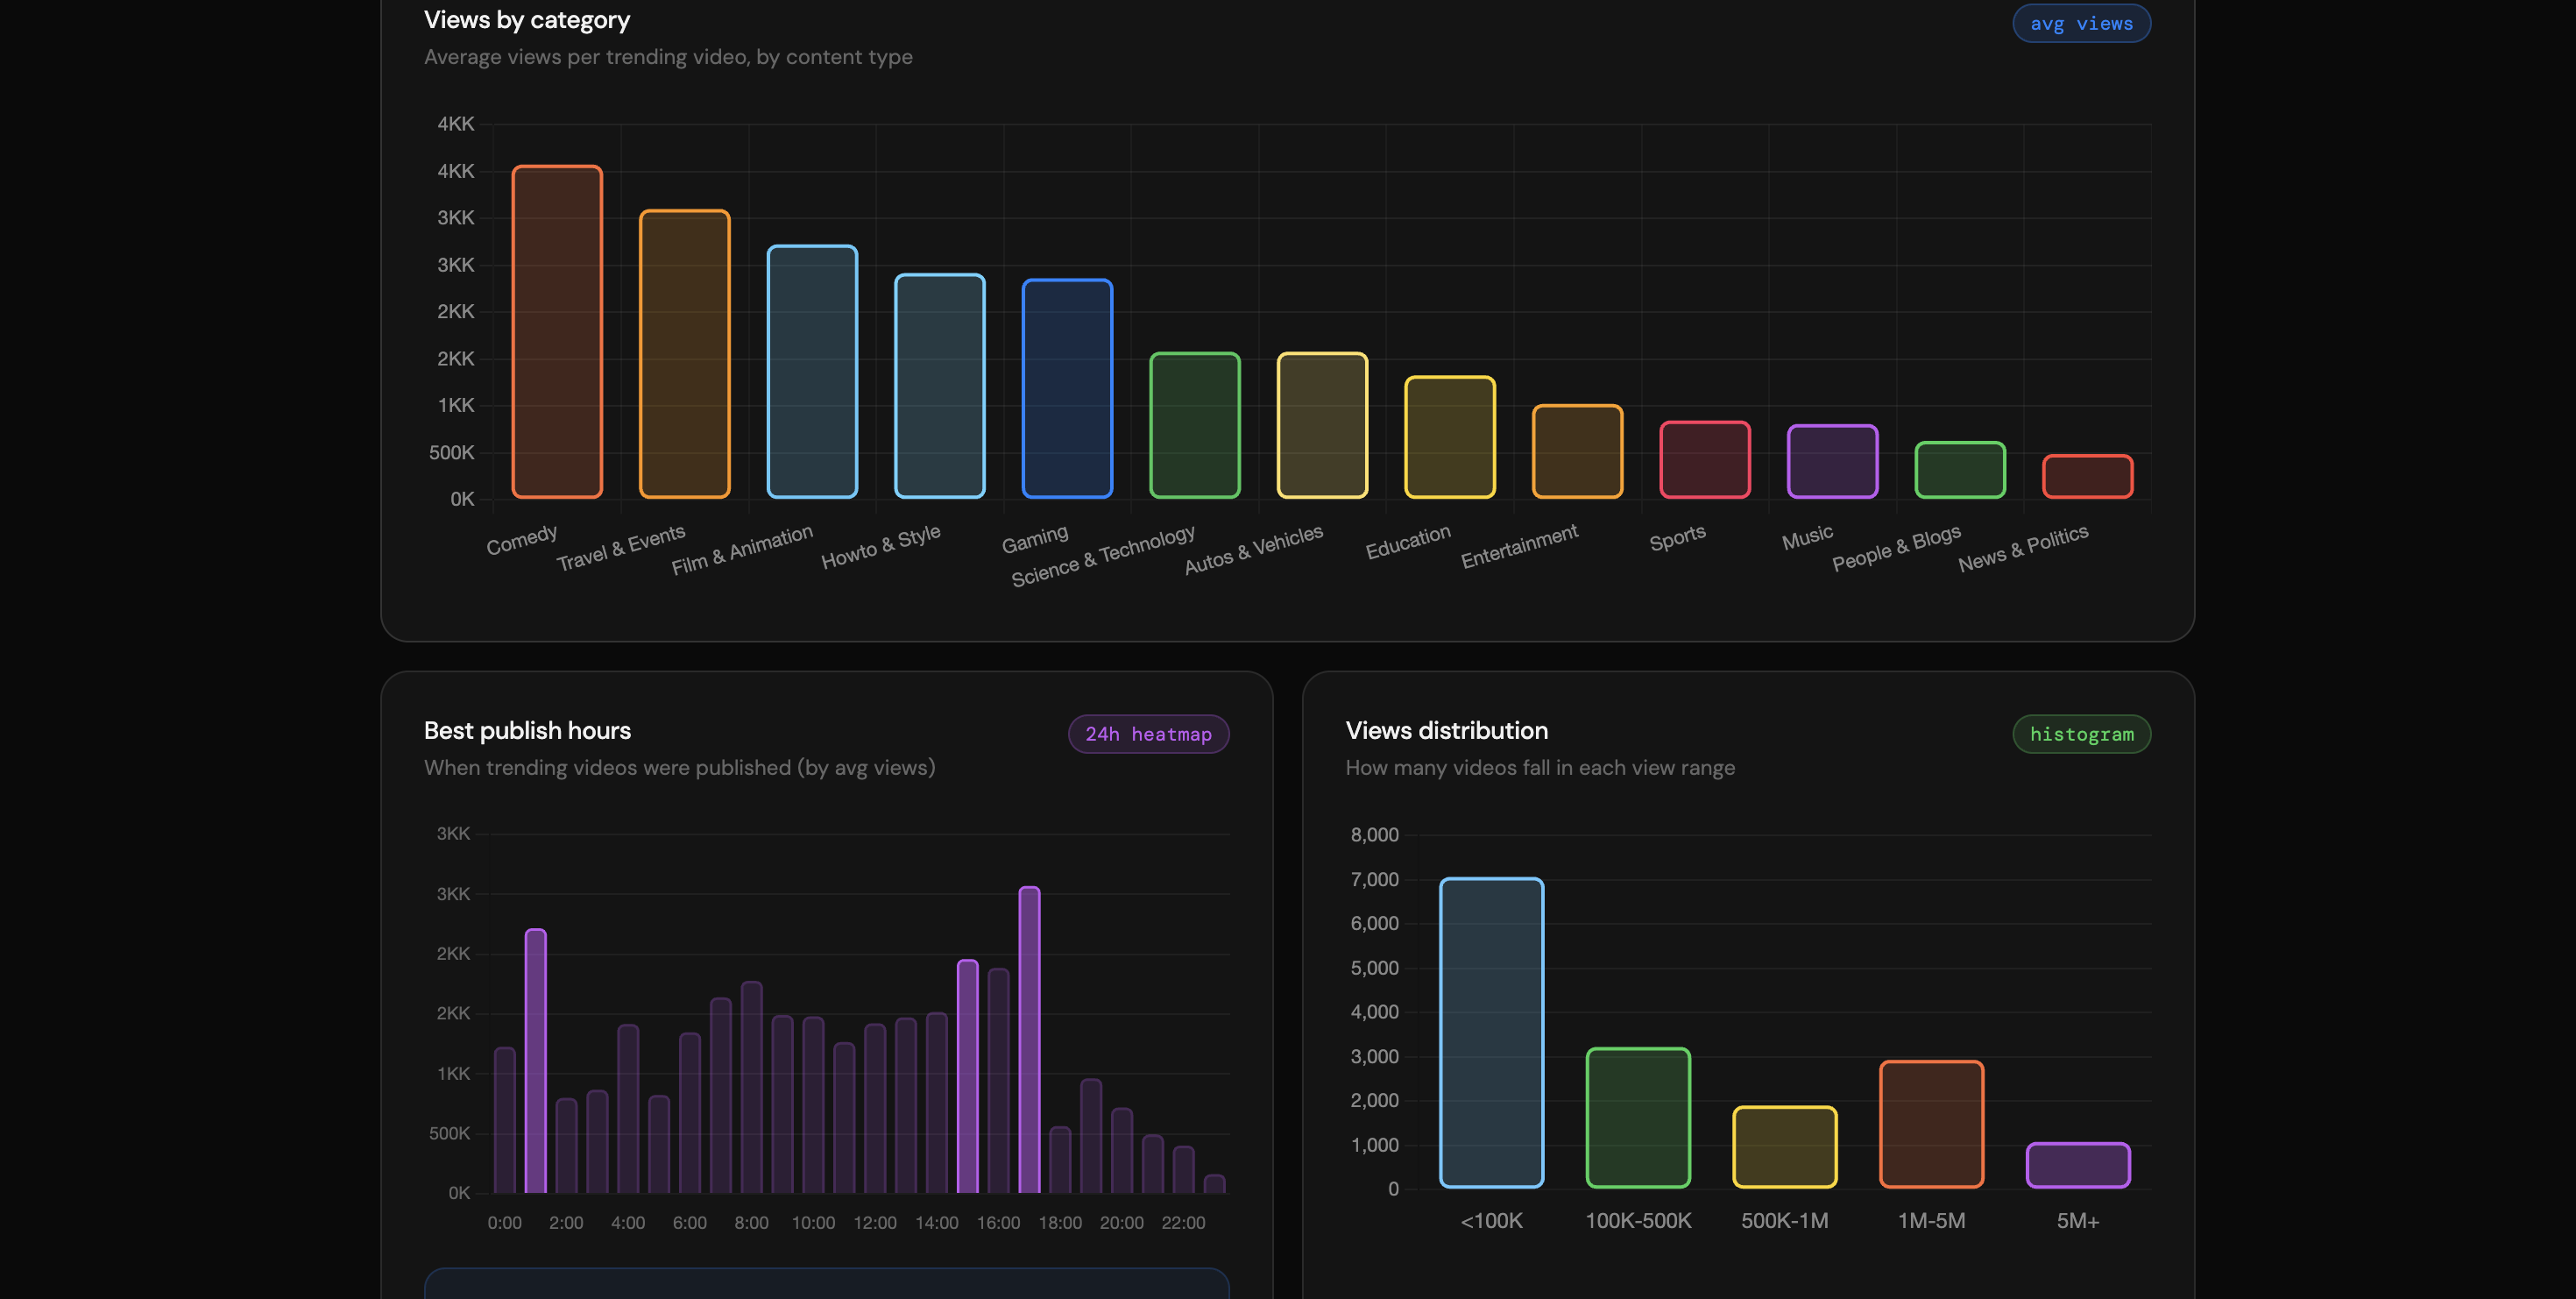
Traction variance based on time posted
-
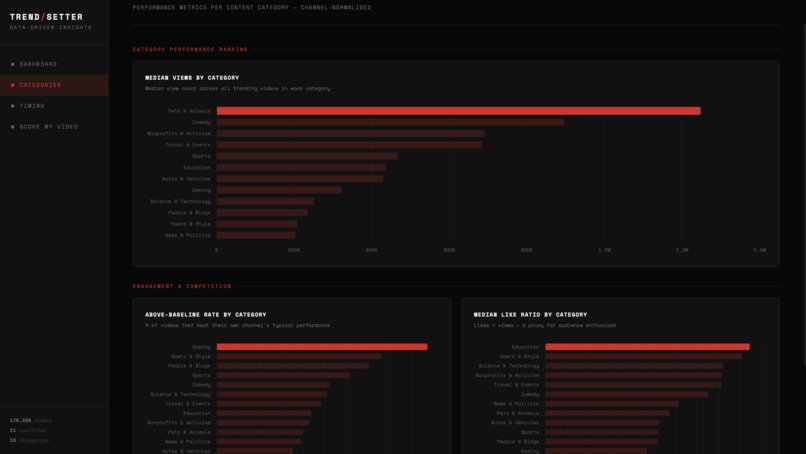
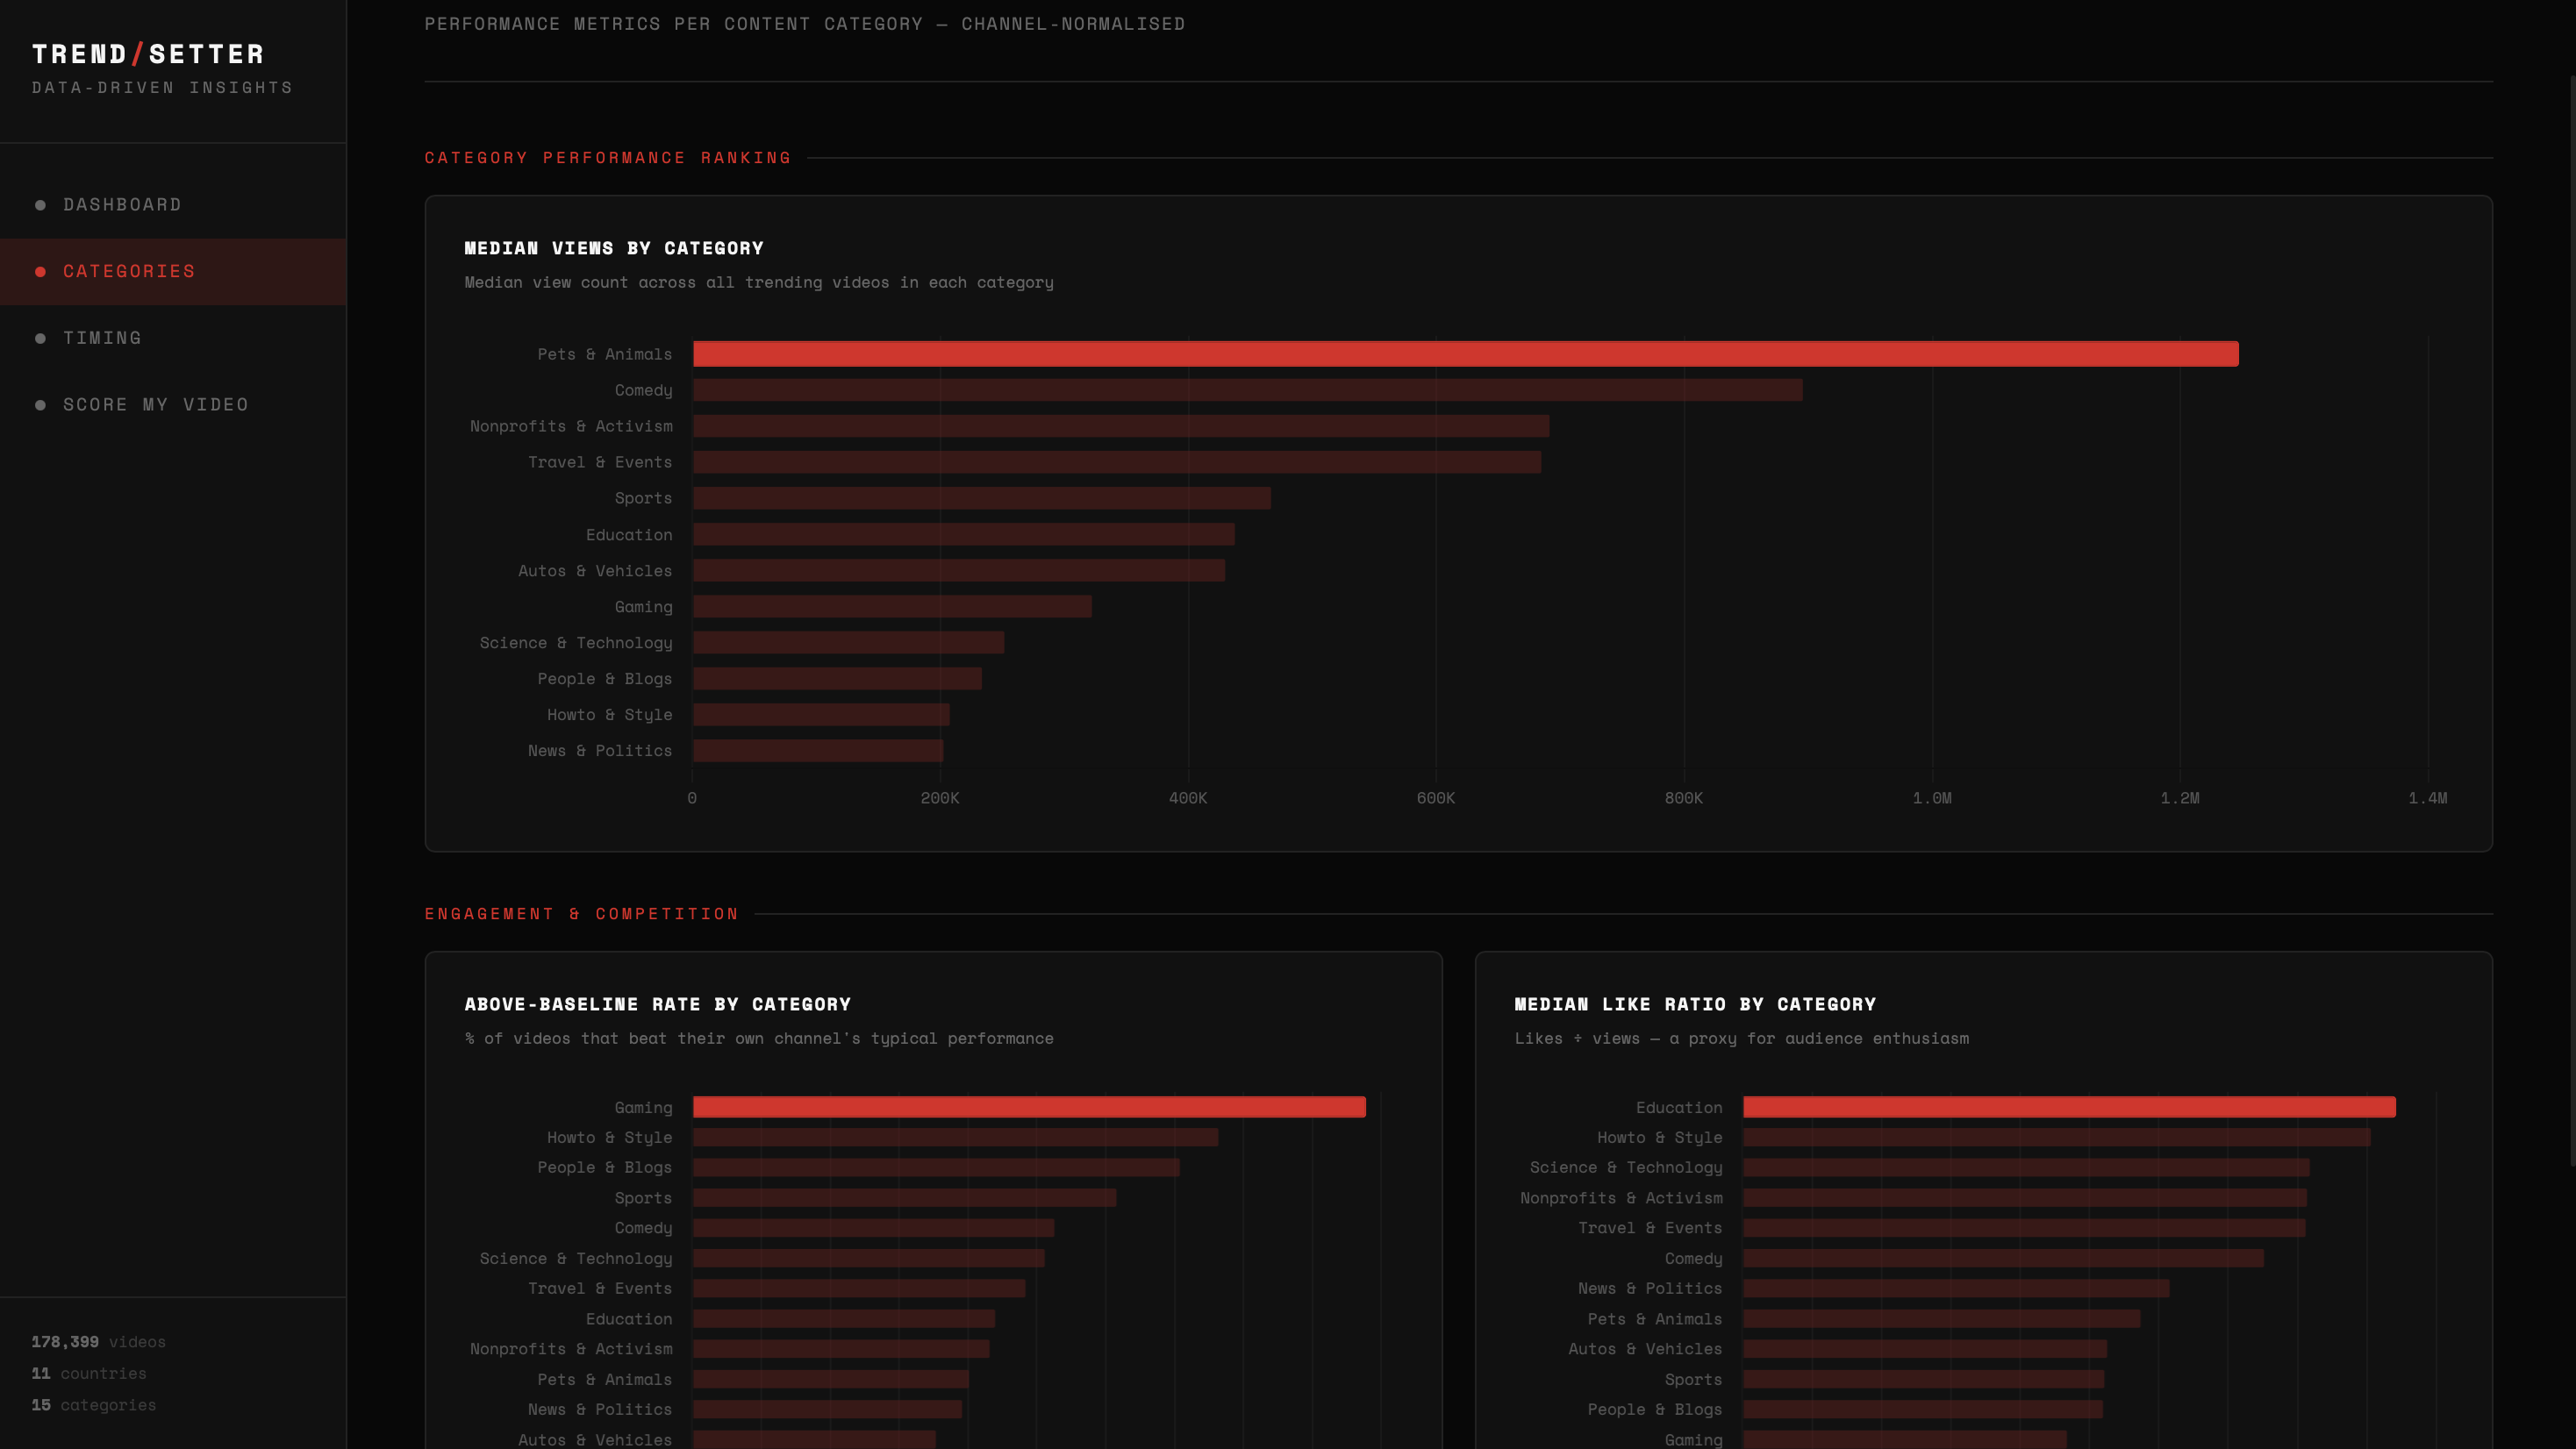
Traction variance on Categories
-
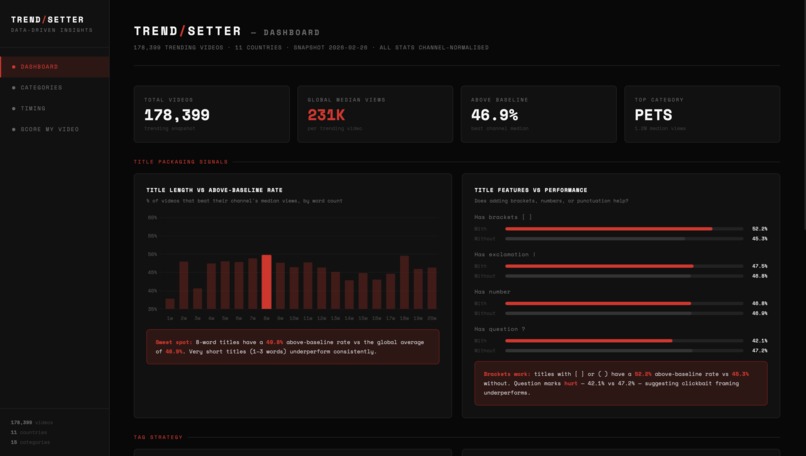
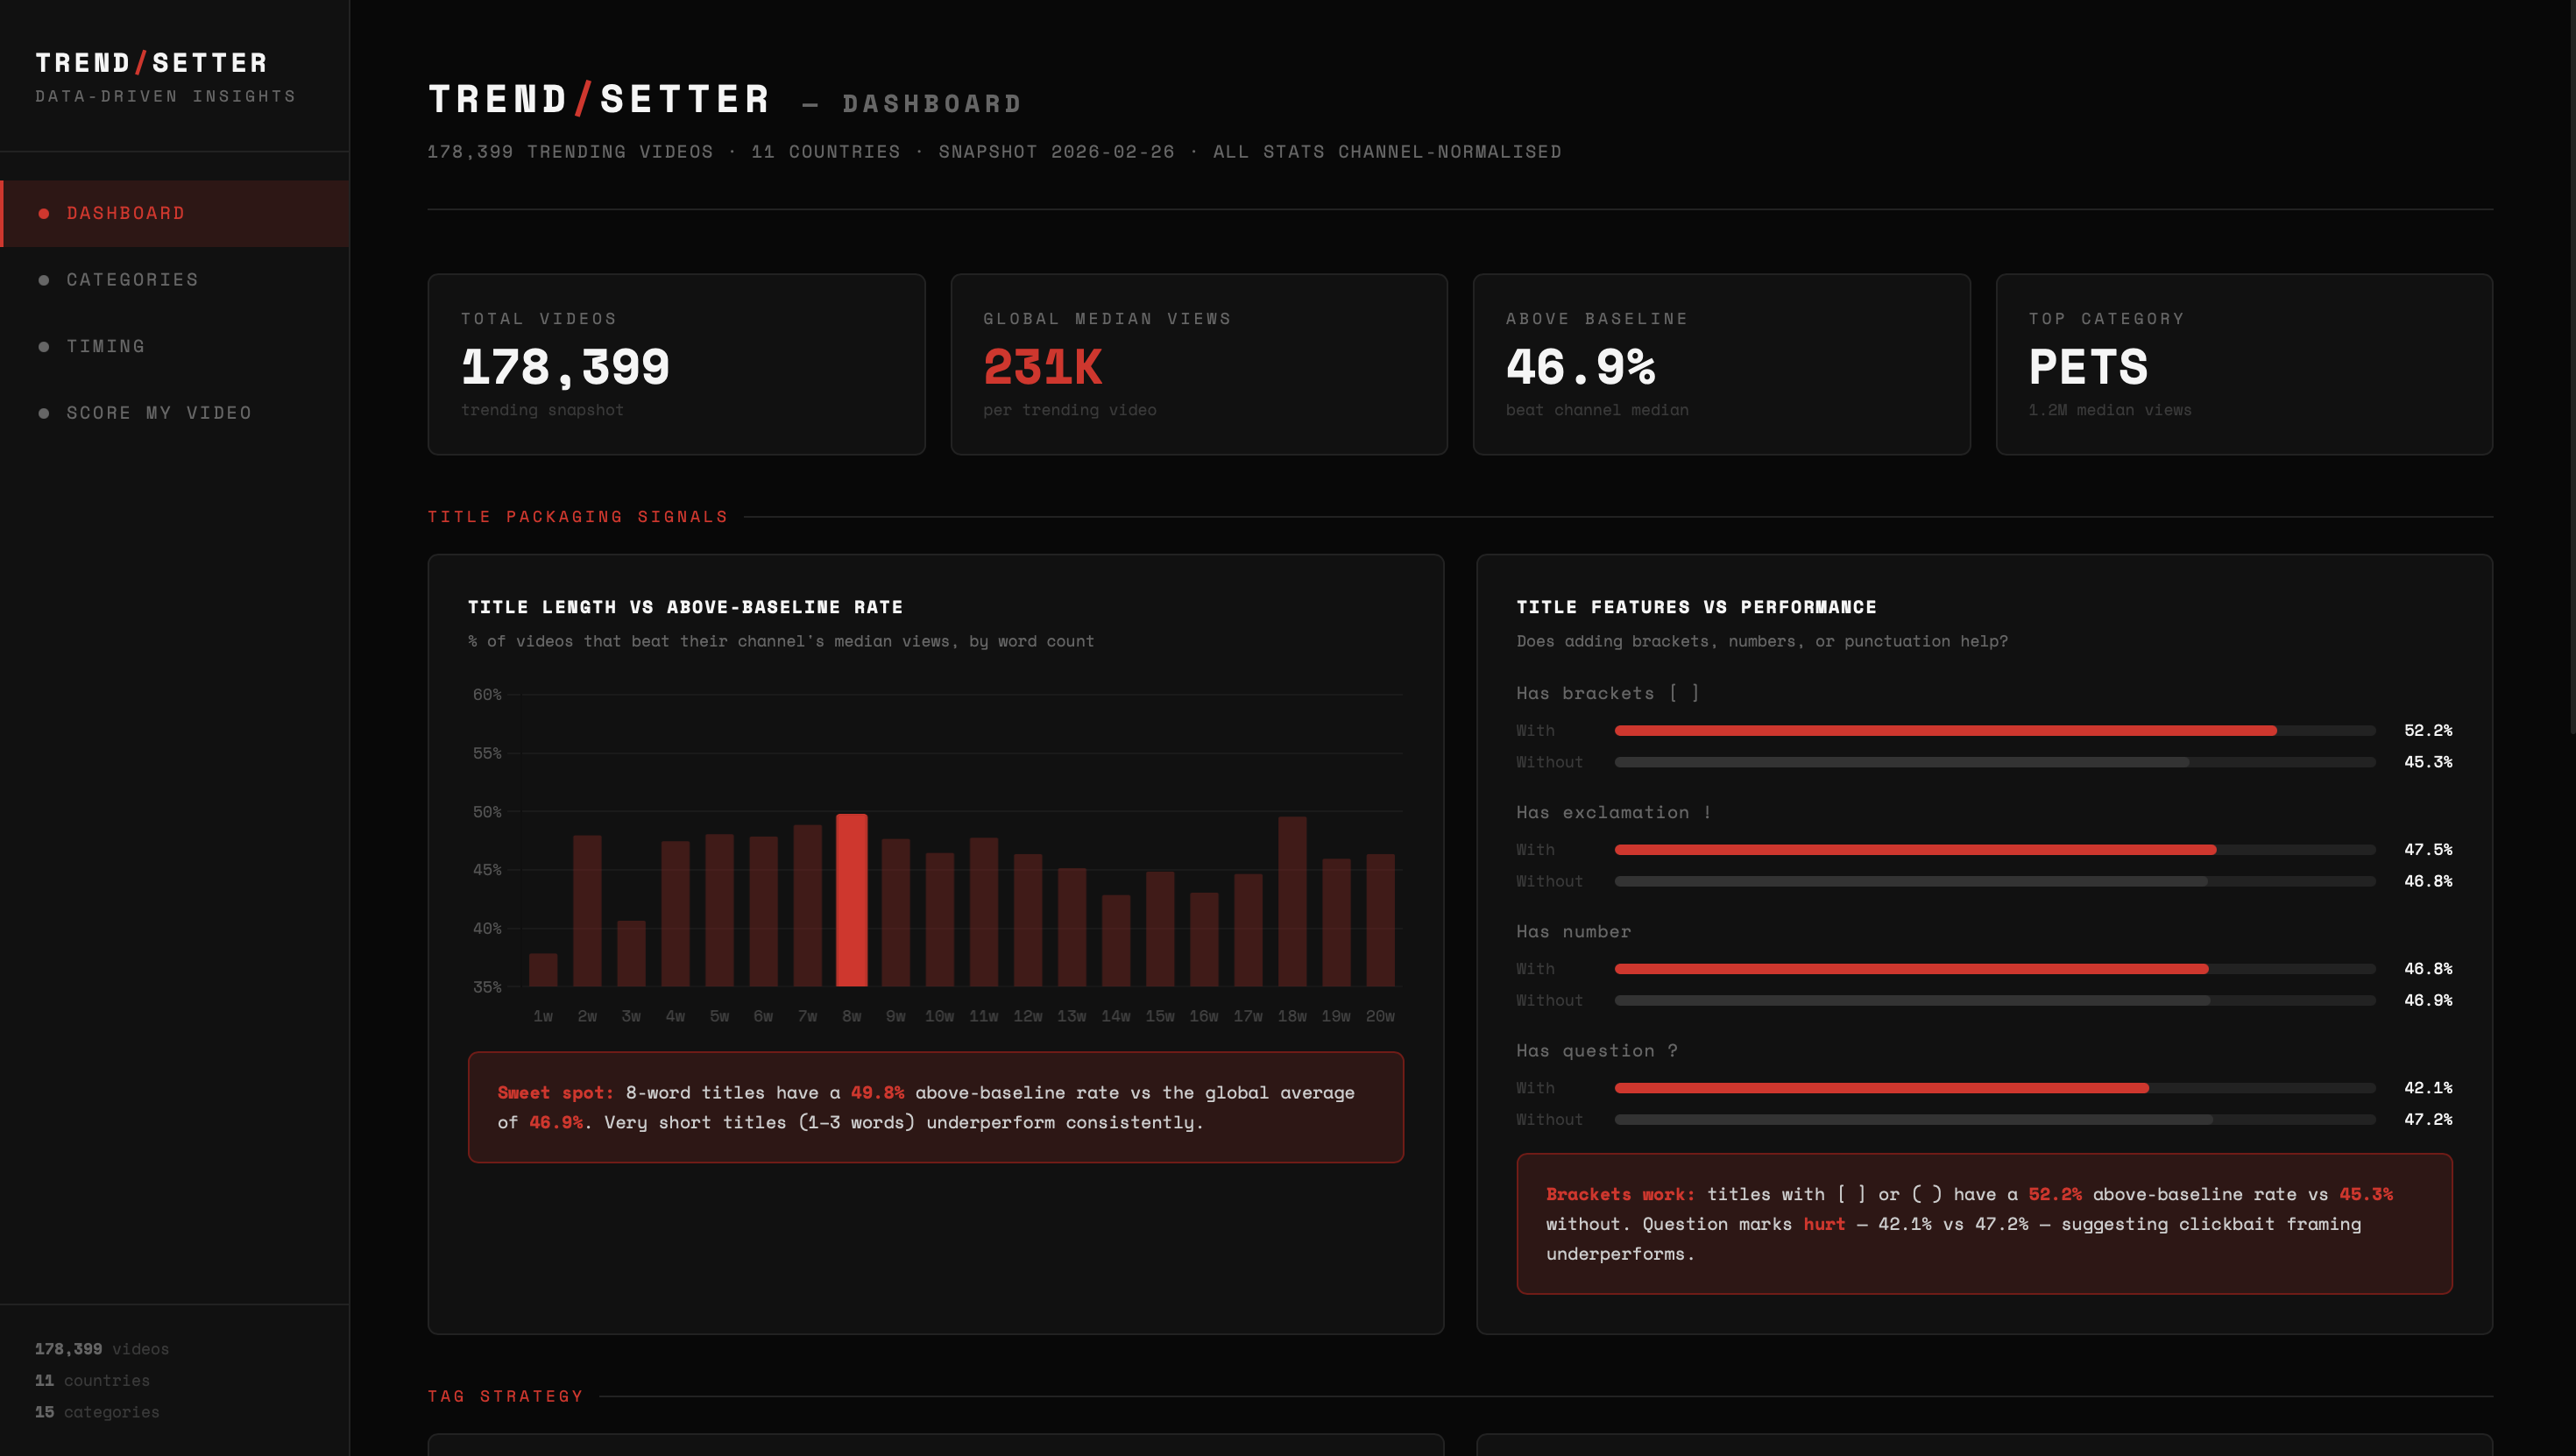
Trend/Setter main dashboard
-
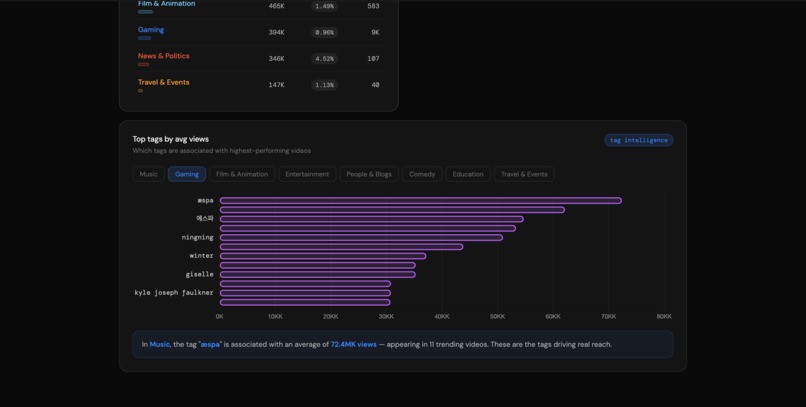
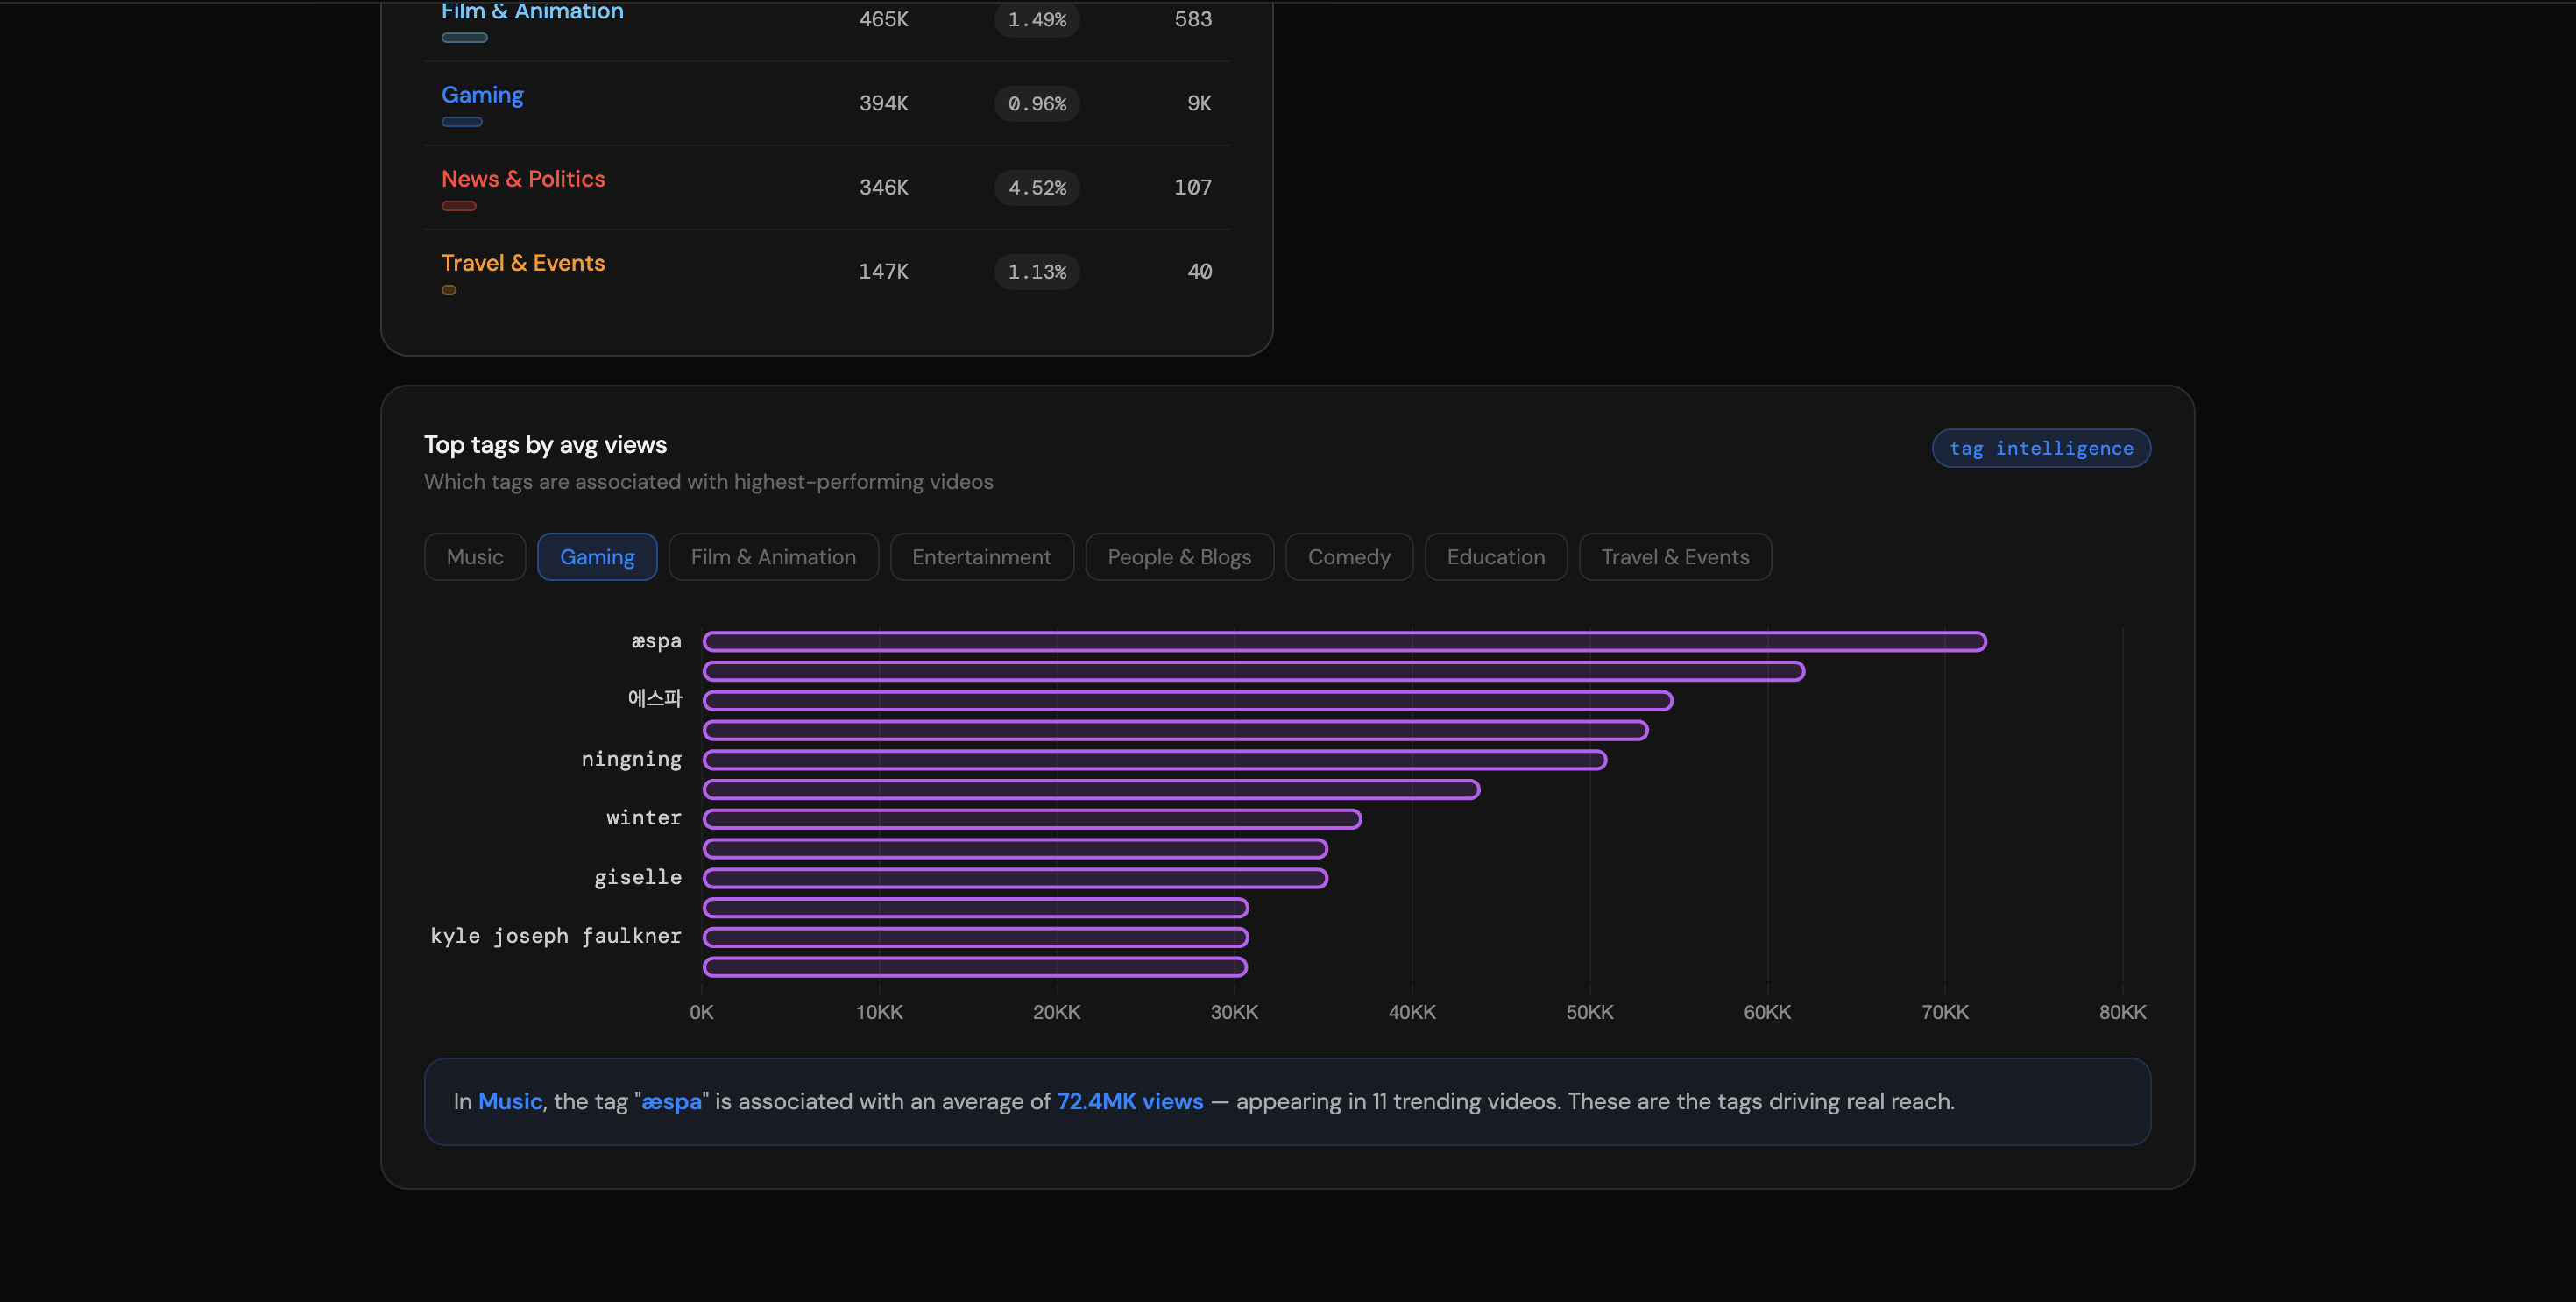
Filtration through countries - South Korea
-
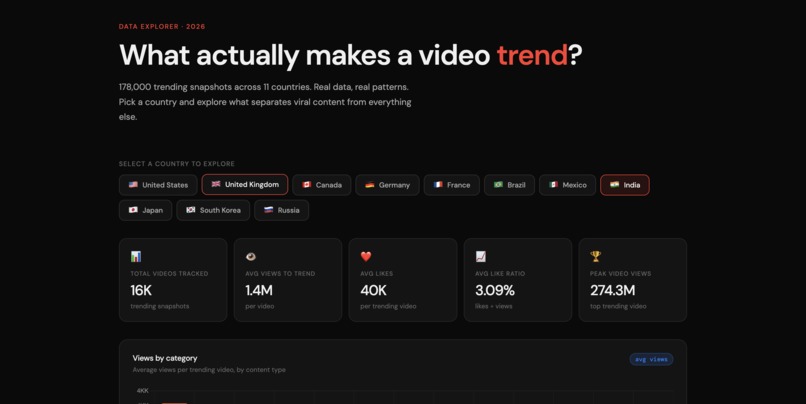
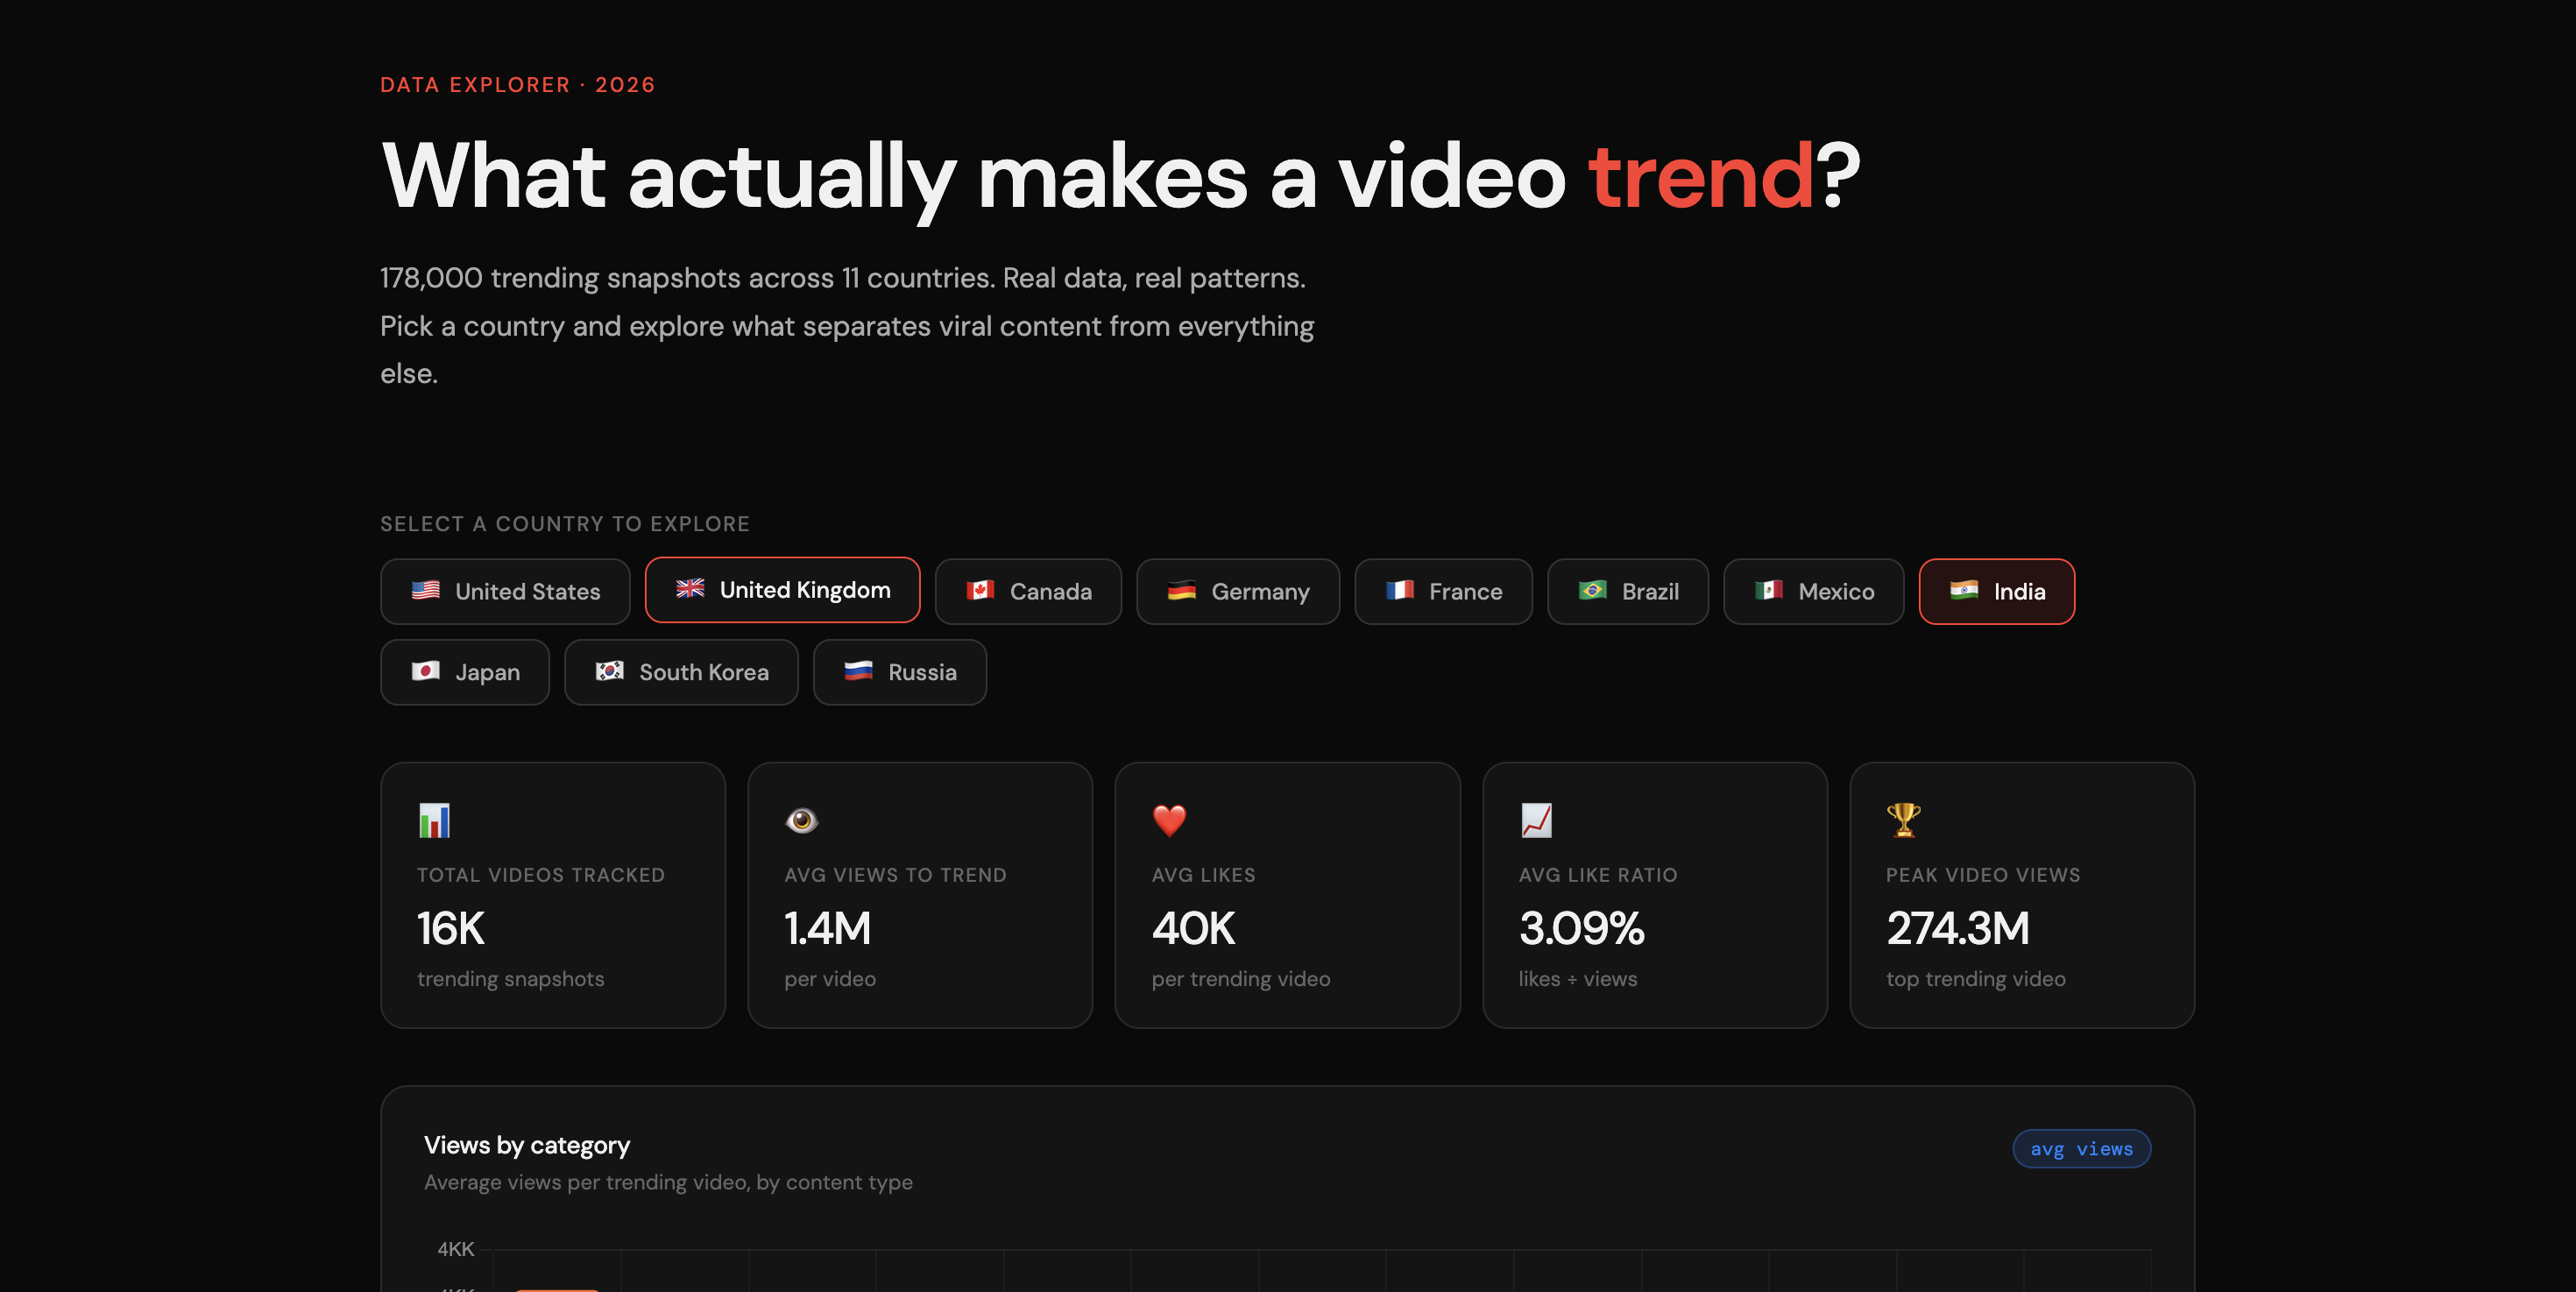
Filtering via country
-
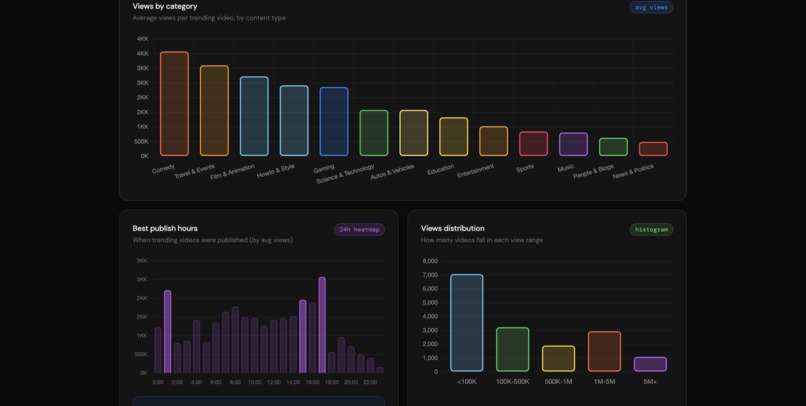
Dashboard vol 2
-
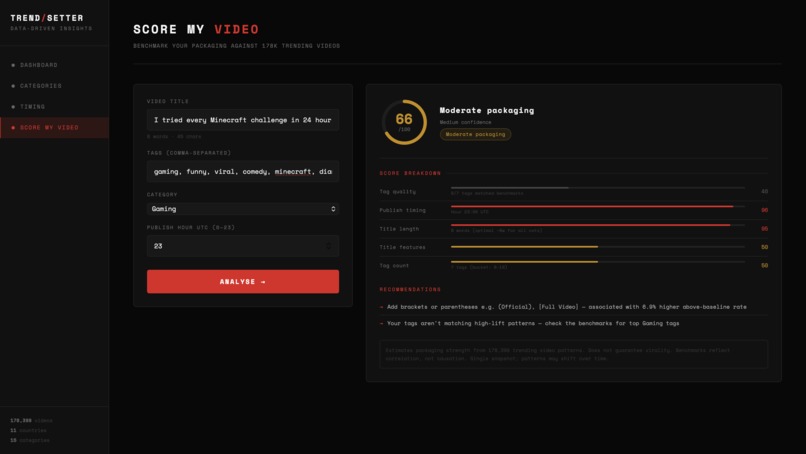
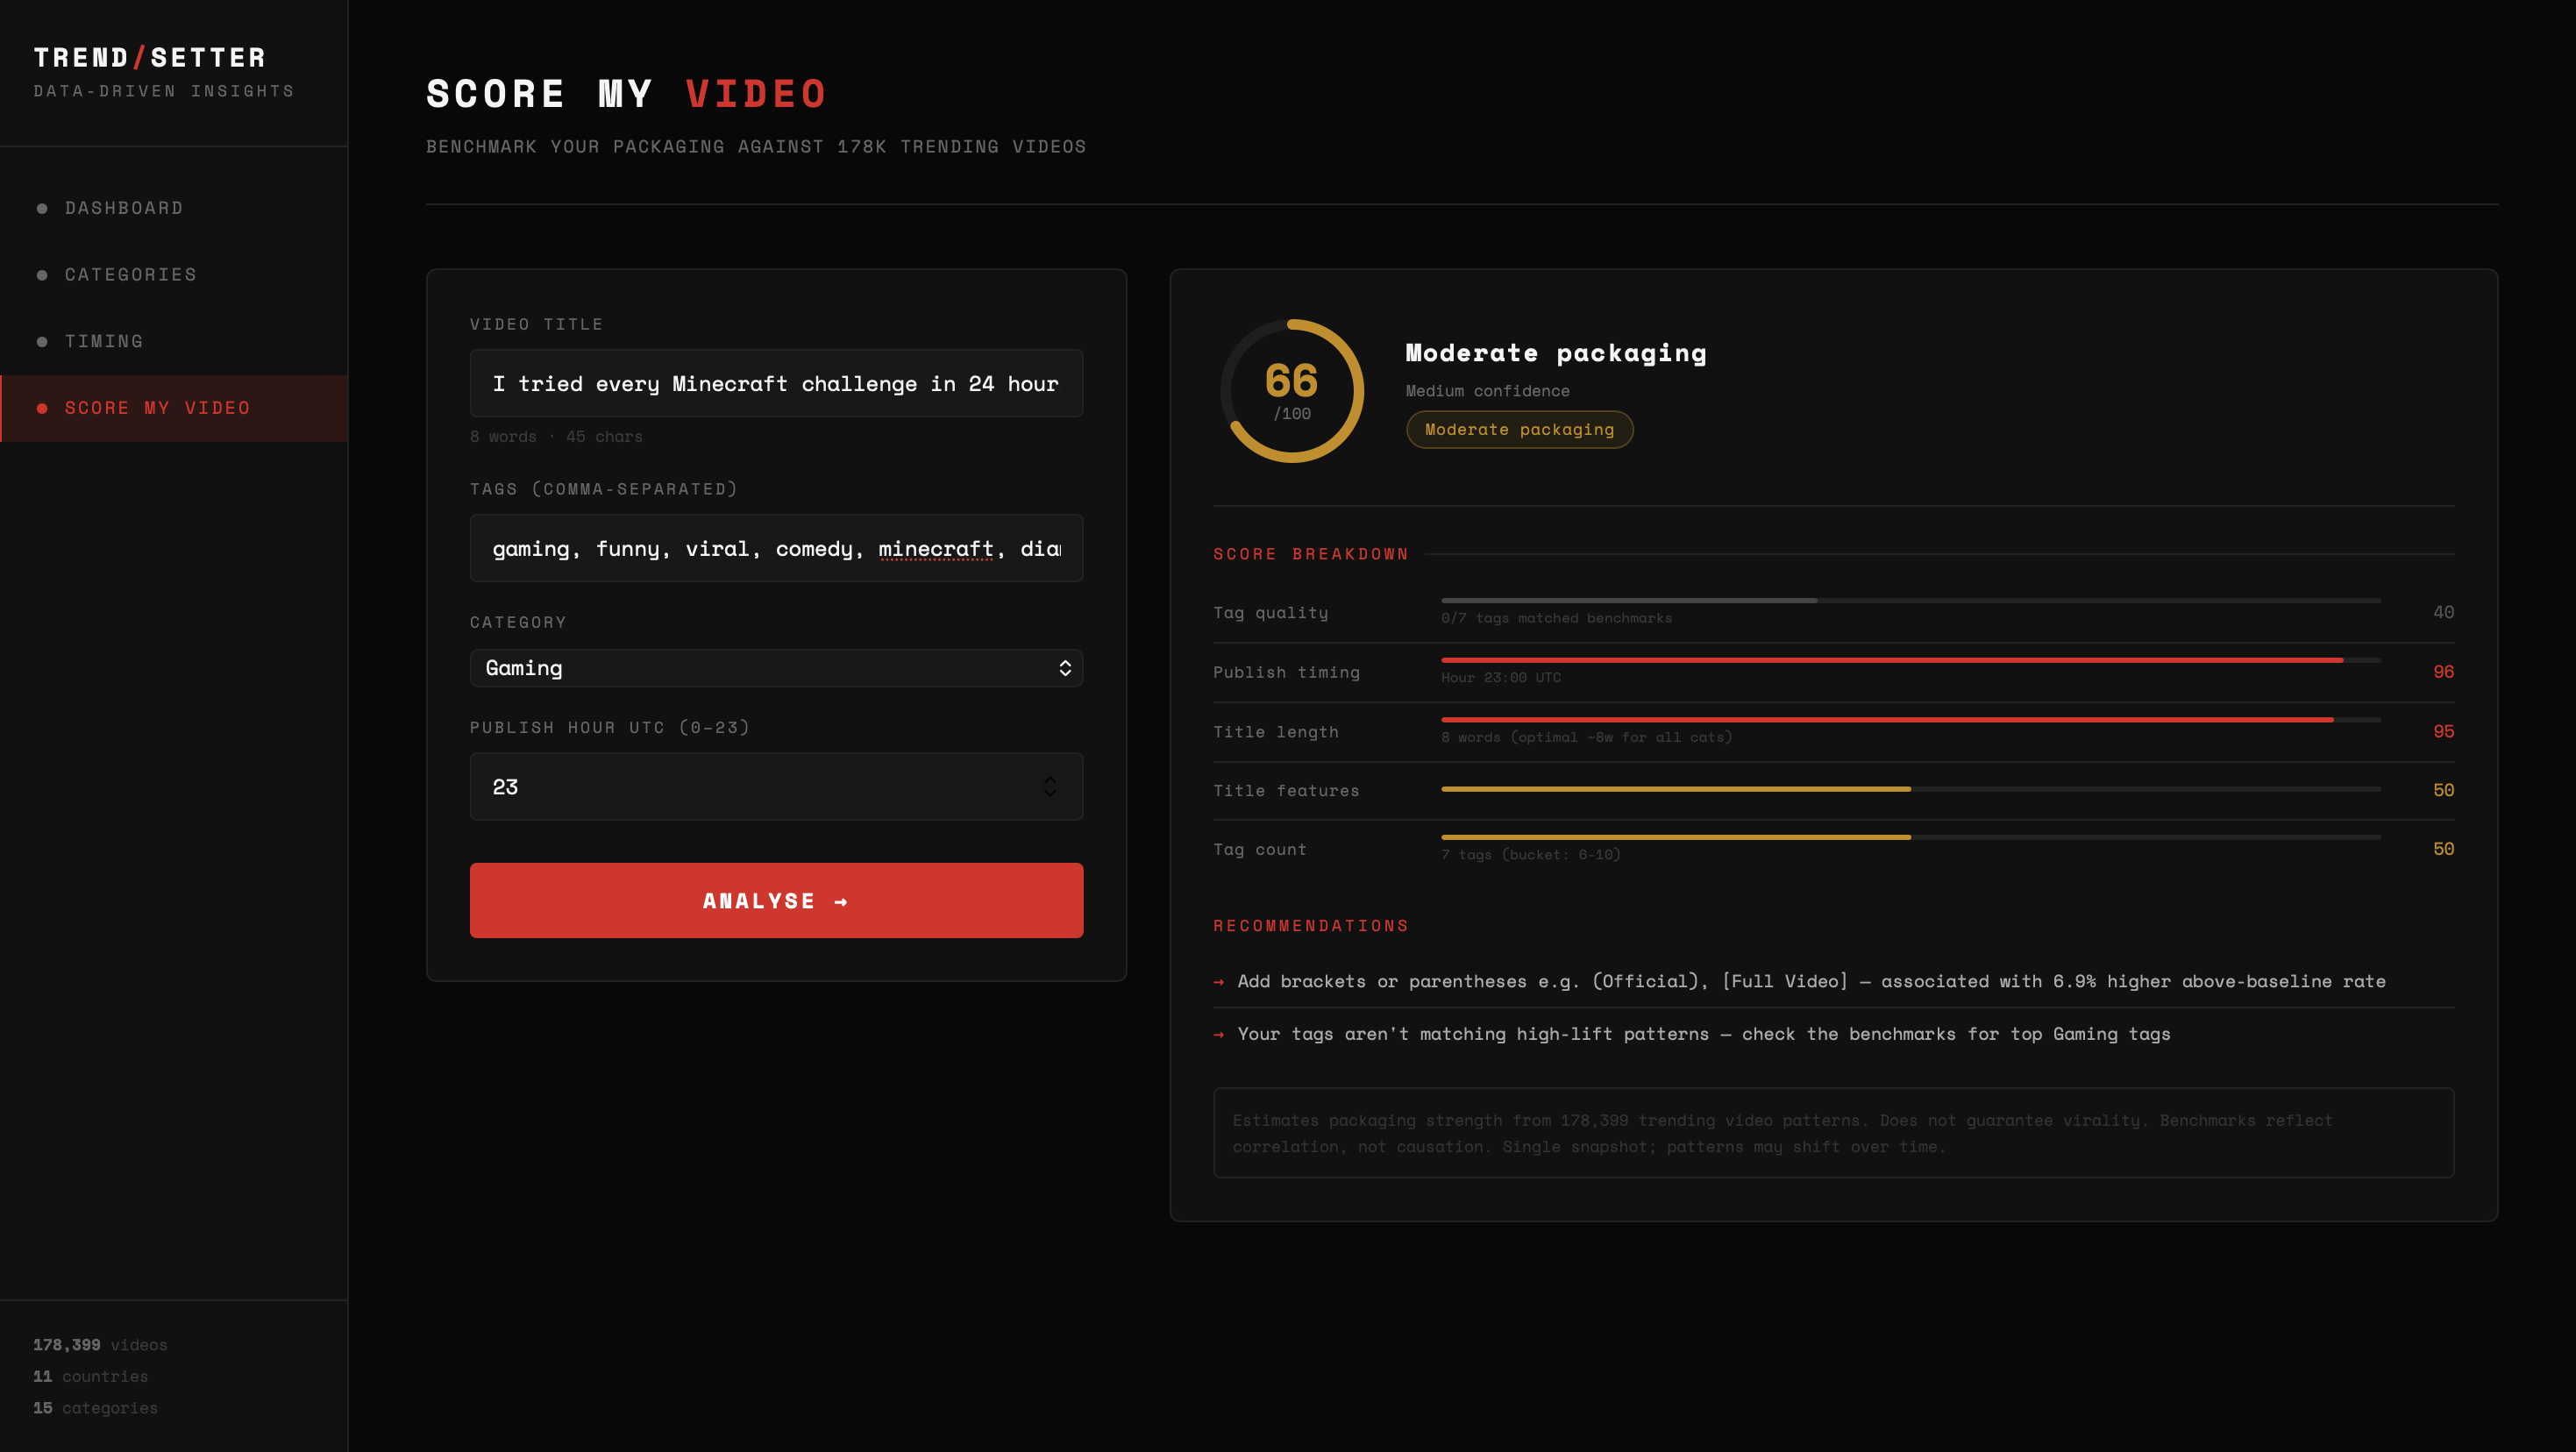
Trend/Setter Score my Title
Inspiration
Every YouTube creator knows the feeling, you spend days on a video, hit publish, and watch it flatline. The instinct is to blame the algorithm. The reality is usually simpler: the packaging was wrong. Title too vague, tags misaligned, published at the worst possible hour for your category. We wanted to know if 178,000 trending videos across 11 countries could answer what intuition couldn't.
What it does
Trend/Setter scores your video's packaging before you post. Enter your title, tags, category, and publish hour and get a 0–100 packaging score backed by real data, a five-factor breakdown, and specific recommendations. The dashboard lets you explore trending patterns by country views by category, best publish hours, like ratio distributions, top-performing tags, and title length correlations. All filtered by market so a creator targeting Brazil gets different insights than one targeting Japan.
How we built it
We ingested 11 country CSVs, cleaned and normalised the data, then built channel-level baselines to control for creator size. Every benchmark is weighted by inverse square-root channel frequency to stop mega-channels from dominating the patterns. The scoring engine runs entirely in the browser against a pre-computed benchmark JSON. The dashboard is a single self-contained HTML file utilizing data provided to it from the CSV files, deployable anywhere.
Challenges we ran into
The biggest was bias. If you naively aggregate trending data you get a portrait of Warner Bros. and MrBeast, not a strategy. We had to normalise every metric against each channel's own baseline so that a video beating a small creator's norm counted as much as a blockbuster. We also discovered the dataset was a single snapshot per country rather than a rolling series, which forced us to rethink our deduplication logic mid-build. And median view lift across the full dataset was exactly zero by construction, which meant we had to pivot our primary metric to above-baseline rate to make the charts meaningful.
Accomplishments that we're proud of
Getting the debiasing to actually work. It would have been easy to ship a dashboard that just showed average views by tag and called it insight. Instead every benchmark controls for channel size, applies minimum support thresholds, and distinguishes between what big creators do and what actually correlates with beating expectations. The scoring engine gives different recommendations depending on country and category, a Gaming creator in Korea gets a different optimal title length, tags and more than one in the US, because the data says so.
What we learned
Survivorship bias is structural, not accidental. The first version of every chart looked impressive and was almost entirely wrong, dominated by channels with hundreds of trending videos. We also learned that one-size-fits-all advice is actively harmful. Optimal title length, best publish hour, and top-performing tags vary significantly by country and category. The data doesn't generalise and pretending it does is worse than saying nothing.
What's next for Trend/Setter
Rolling the dataset forward with multi-day snapshots so we can measure trend duration and trajectory, not just a single moment. Adding a thumbnail analyser using vision models to score click-through potential alongside the metadata score. And building a creator mode that tracks your own channel's baseline over time so the benchmark isn't 178,000 strangers, it's you versus your own best performance.

Log in or sign up for Devpost to join the conversation.