Inspiration
The inspiration for Trend Bubble came from a simple, recurring frustration: trying to find an interesting dataset often means scrolling endlessly through Kaggle or Google without direction. Most users rely on static metrics like download counts or votes, but those don’t reflect what’s actually gaining attention right now. Meanwhile, pop culture is fast-moving and ever-changing, from viral TikTok trends to breaking news in sports and entertainment. We asked ourselves: Can we use dataset activity to reflect the cultural zeitgeist in real time? That’s how Trend Bubble was born — a visualization that captures the pulse of pop culture by analyzing trending datasets on Kaggle.
What it does
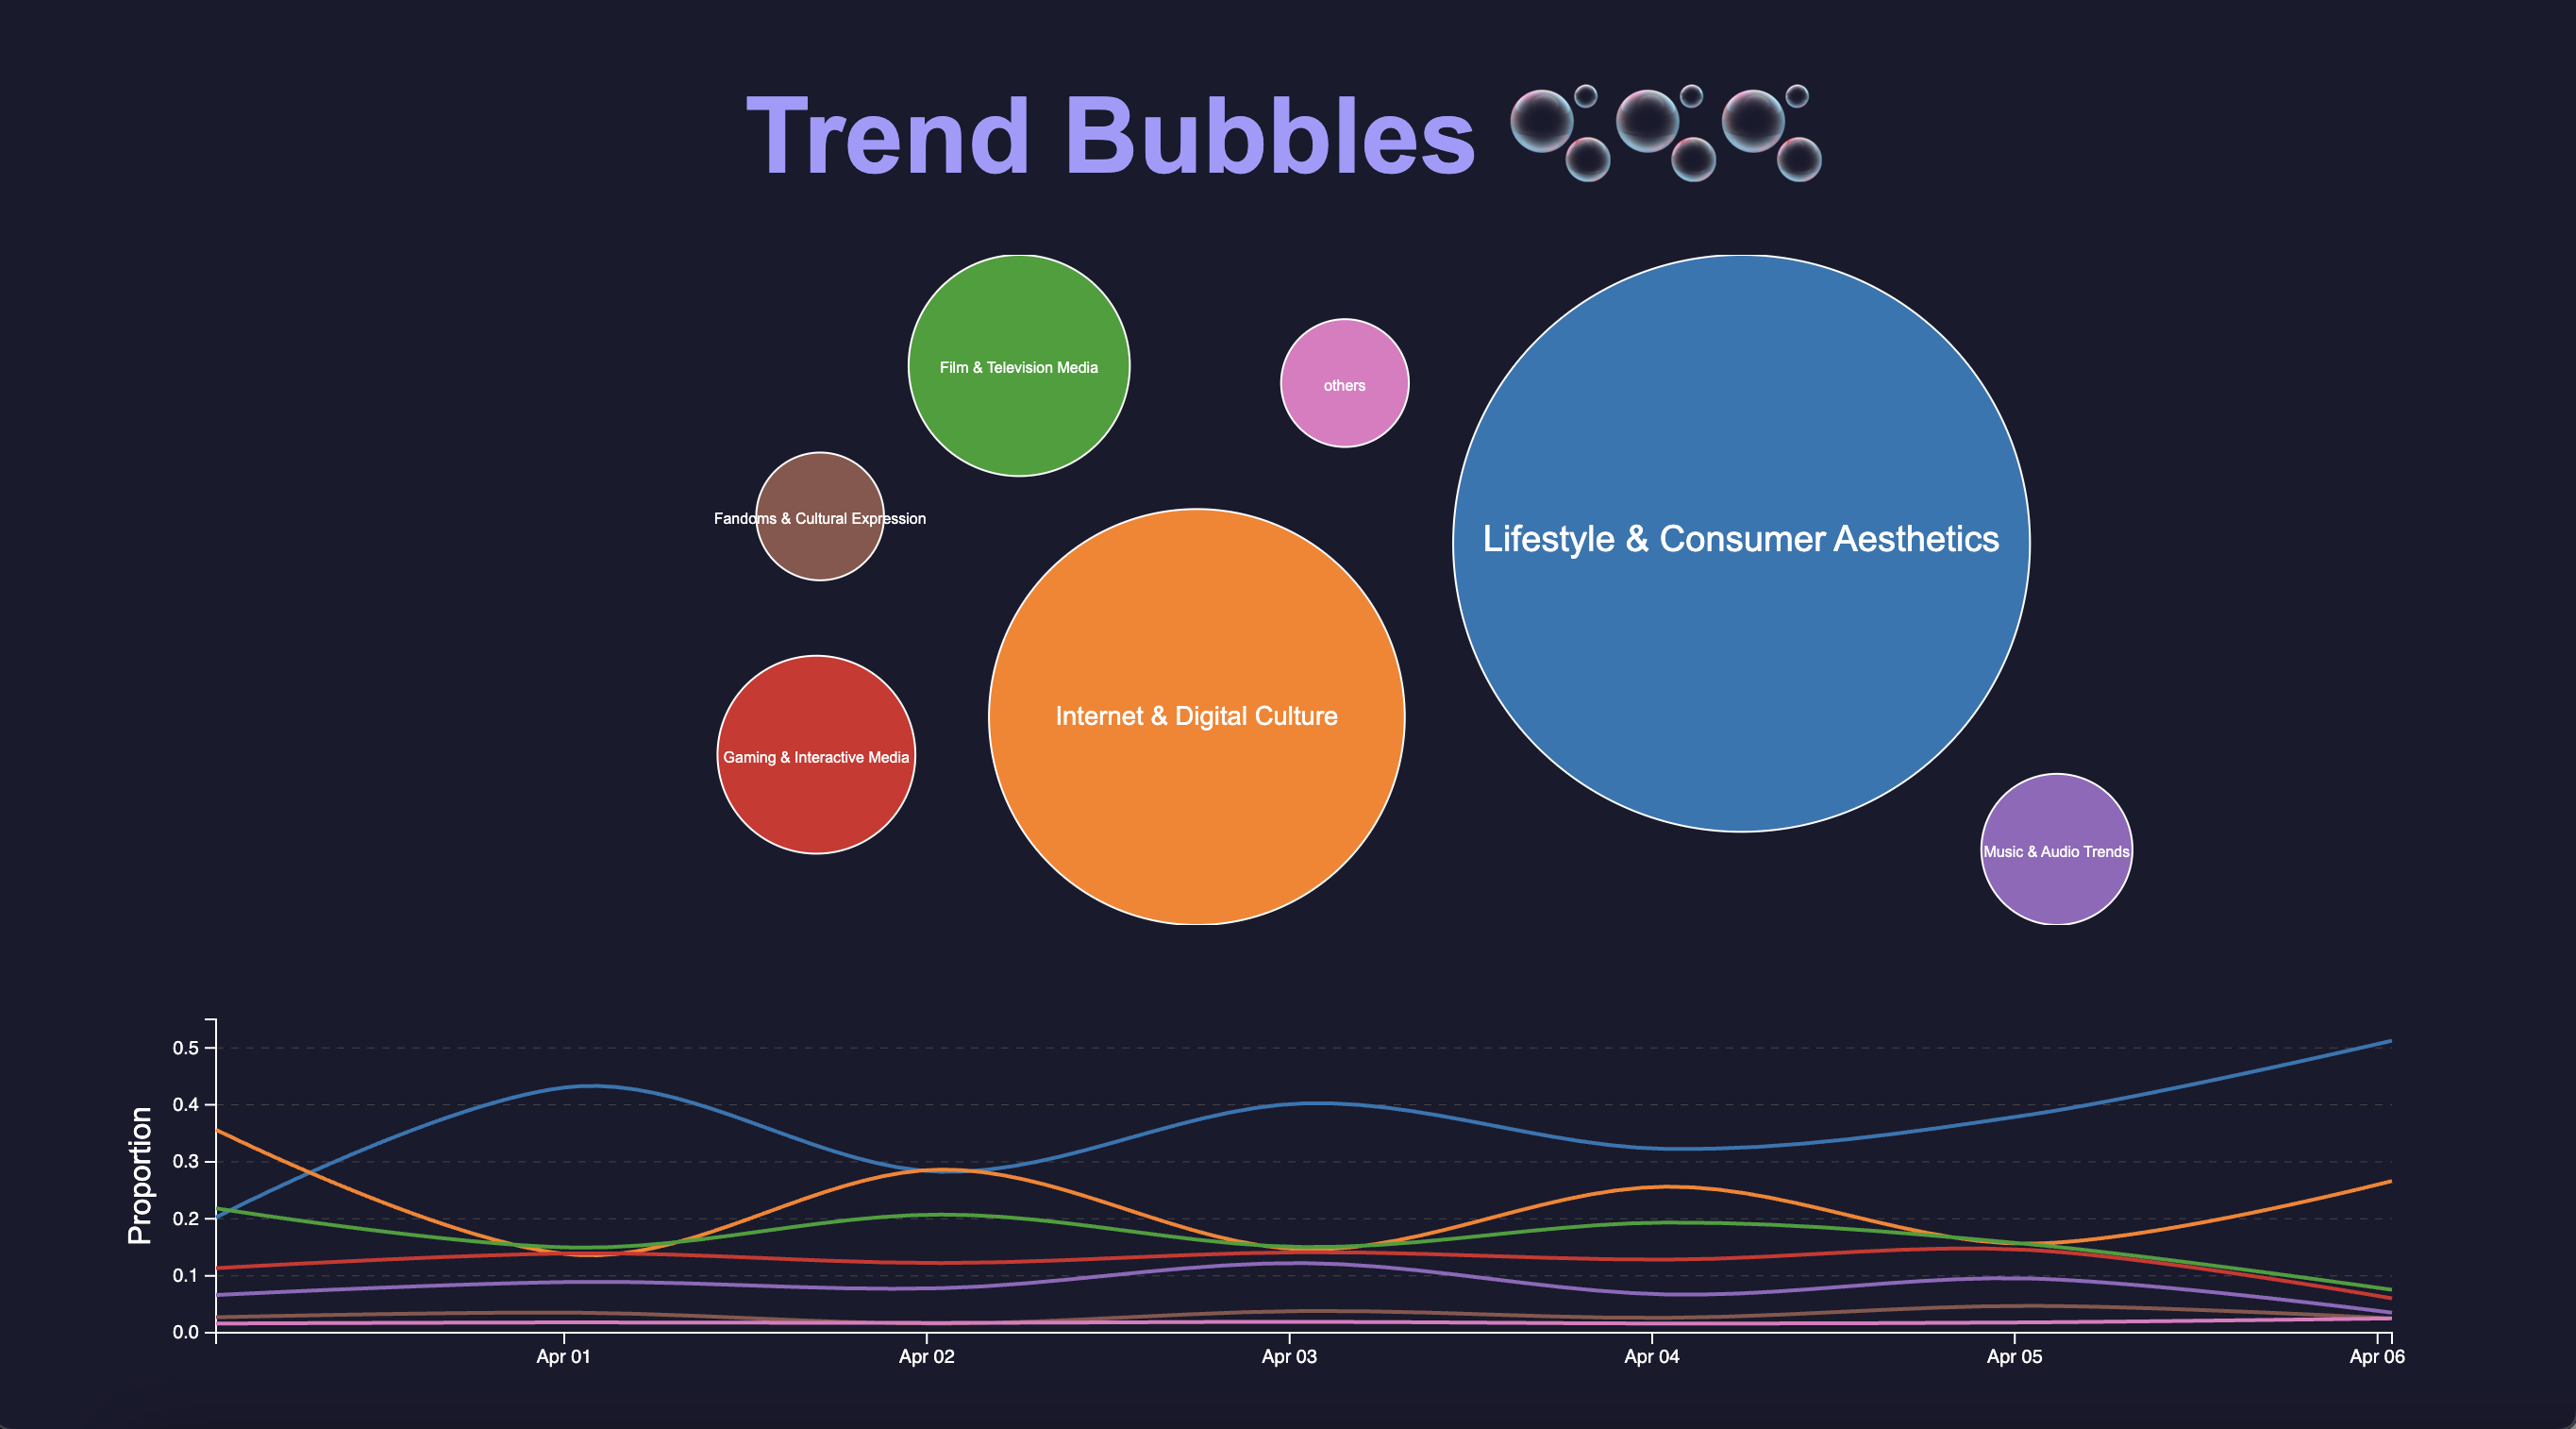
Trend Bubble is a single-page, interactive dashboard that visualizes the current landscape of Kaggle’s most popular dataset categories. The top section features a bubble chart, where each circle represents a cultural category (like “Music”, “Gaming”, or “Fashion”), sized by its proportion in today’s trending datasets. Below it, a line chart tracks each category’s trend over time, letting users explore how interests have shifted day-to-day. The entire dashboard is styled with a sleek dark theme, smooth transitions, and live interactivity. Best of all, it updates automatically every day — no manual refreshes needed.
How we built it
We built the backend of Trend Bubble using the Kaggle API, which fetches metadata from the top trending datasets daily. We processed this data with a lightweight script that maps noisy tags to meaningful cultural categories. This cleaned and structured data is pushed to our GitHub repository automatically using GitHub Actions, which handles daily updates with zero maintenance. The front end is powered by D3.js, enabling dynamic and scalable visualizations in the form of bubble and line charts. All of this is deployed via GitHub Pages, making the site instantly accessible with a single link — no hosting or backend servers required.
Accomplishments that we're proud of
We’re proud that Trend Bubble is not just a prototype — it’s a fully working product. It updates itself daily, it’s visually compelling, and it’s live on the web. We were able to create an engaging interface using D3.js with minimal dependencies, and make something that doesn’t just display data — it tells a story. We’re especially proud of how we blended aesthetics with usability, using design to invite curiosity and exploration rather than overwhelm the user with raw numbers.
What's next for Trend Bubble
There’s a lot of room for Trend Bubble to grow. We’d like to refine the category classification with NLP and clustering, so the dashboard can detect emerging topics automatically. We’re also planning to add ranking movement indicators, so users can see which categories are rising or falling in real time. A natural next step is to let users click on categories and view the actual datasets behind them. Long-term, we hope to expand beyond Kaggle — integrating with GitHub, Hugging Face, or even Google Trends — to build a broader picture of how data reflects culture. Eventually, we’d love to personalize it: imagine a version of Trend Bubble that shows what’s trending in your world.

Log in or sign up for Devpost to join the conversation.