-
trek check logo
-
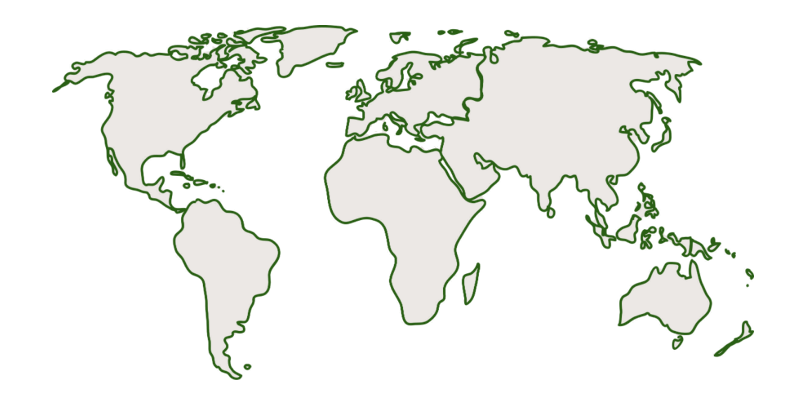
world map
-
wildlife decoration 1
-
wildlife decoration 2
-
wildlife decoration 3
-
marine life decoration 1
-

marine life decoration 2
-
marine life decoration 3

Inspiration
The challenge prompt for "Best Sustainability" aligned with our interests in promoting awareness of the environment and the world around us. Familiar with SDG goals 14 and 15 of protecting life below water as well as life on land, we wanted to target this topic with our hackathon creation.
What It Does
Our natural life data analysis tools used a combination of data sets and facets to get the most accurate raw data. We compared various factors from general oceanic patterns to recent studies on climate change to roaming range in order to determine our final data set for ideal animal migration seasons. We also researched and created a raw data set for popular tourist and travel months in different, often congested cities. We used this raw data and made a final program which compared the number of months that matched up within both data sets and determined a scaled risk factor. This risk factor determines how likely tourist traffic and endangered species migration times are to cross over and gives a sense of how cautious people should be about their environment while traveling.
How We Built It
On the frontend, we utilized the visual app builder Bubble.io to construct the foundation of our web app and Medibang Paint Pro to illustrate our designs. On Bubble.io, we were able to create buttons and other elements that made the app visually appealing and understandable.
On the back end, we created a simple command-line prompt program to make the tracker easy to use and visually appealing. We researched migration patterns and peak tourism seasons extensively, making our research, in fact, accurate rather than randomly generated. To make the process simpler without having to embed or use an API, we utilized Replit to write Python programs and simply linked it to our web app. On each location-based Repl, the raw data was put through a series of simple data classification functions which tallied up the number of shared months between peak tourism months and migration months and provided a risk factor based on the number of shared months. We formatted it in our main function to make it easily readable with additional information provided on our web app.
Finally, we recognized that to start making an impact, you have to start locally and simply. For this reason, we linked all of our sources in case anyone would like to read up on our research and data used and also some local/national/global non-profits for anyone who’s just as passionate about Planet Earth as us.
Challenges We Ran Into
Being high school juniors attending our first hackathon without a comprehensive computer science education, we faced many challenges. Our primary difficulty was simply our lack of knowledge regarding real-life applications and connecting our front-end to our back-end. We were not well-versed in APIs, frameworks, or even web services. This made our creation process much more challenging.
In the beginning, we were interested in potentially using resources like Microsoft Azure and React. We spent a lot of time attempting to figure these systems out. Unfortunately, while they are great tools, it was very unlikely that we would've been able to successfully fulfill our app idea with these systems due to the amount of time it would've taken to gain the necessary skills.
The program, without the use of proper APIs or frameworks, relied on hard-code, which ended up causing some issues down the line, especially when we tried to create visual data. We ended up leaving that as more of a beta tool that we can hopefully improve upon in the future. The command line programming style is simple, but also did not leave much room for design elements. We never really figured out how to link our front end and back end designs, though we tried researching extensively, and we resorted to using Replit links to our data analysis programs instead.
However, we were able to support each other throughout the research and decision making process. Even without many experiences with real world application and external tools, we were still able to overcome our challenges with unique solutions.
Accomplishments that We're Proud Of
Our TechTogether hackathon experience was incredible, and we have lots to be proud of. In terms of the logo and graphics, we designed almost everything ourselves. From the colors to the illustrations, we think our designs added a unique touch to our web app. We are also proud of the fact-checking that went into our research process. We wanted to keep our data as accurate as possible, and we were able to gain an extensive understanding of the environment, science, and technology. These findings put things into perspective for us, and we are glad to have participated in this challenge.
What We Learned
As our first hackathon, we definitely gained a lot of technical and soft skills from this experience. From the workshops and mentors, we were exposed to new perspectives to technology. We also met new people who shared similar interests, and we felt like we were a part of a community.
In our own hackathon creation, we also continued to grow our skills. We adapted to new frameworks like Bubble.io and incorporated our past skills. We learned about different Python libraries such as matplotlib, which helped visualize our data, as well as text formatting and data analysis functions using simple boolean statements.
What's Next for Trek Check
In these limited hours, we were unable to accomplish everything that we originally wished to do. Our next goal would be to clean up our front-end and back-end connection and completely integrate our analysis tool into the web app without using Replit. Other steps we would take would be to integrate APIs and external tools that would make our programming process more efficient.
Thank you for this opportunity!
Aashi & Connie
Built With
- bubble.io
- matplotlib
- medibangpaintpro
- python
- replit


Log in or sign up for Devpost to join the conversation.