-
-
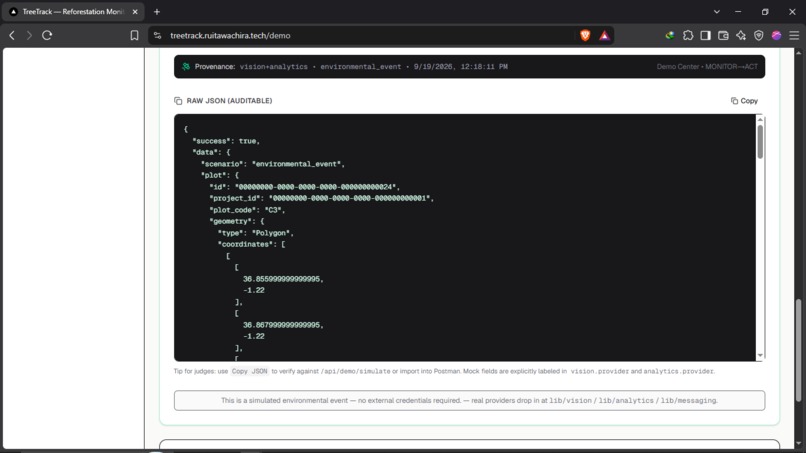
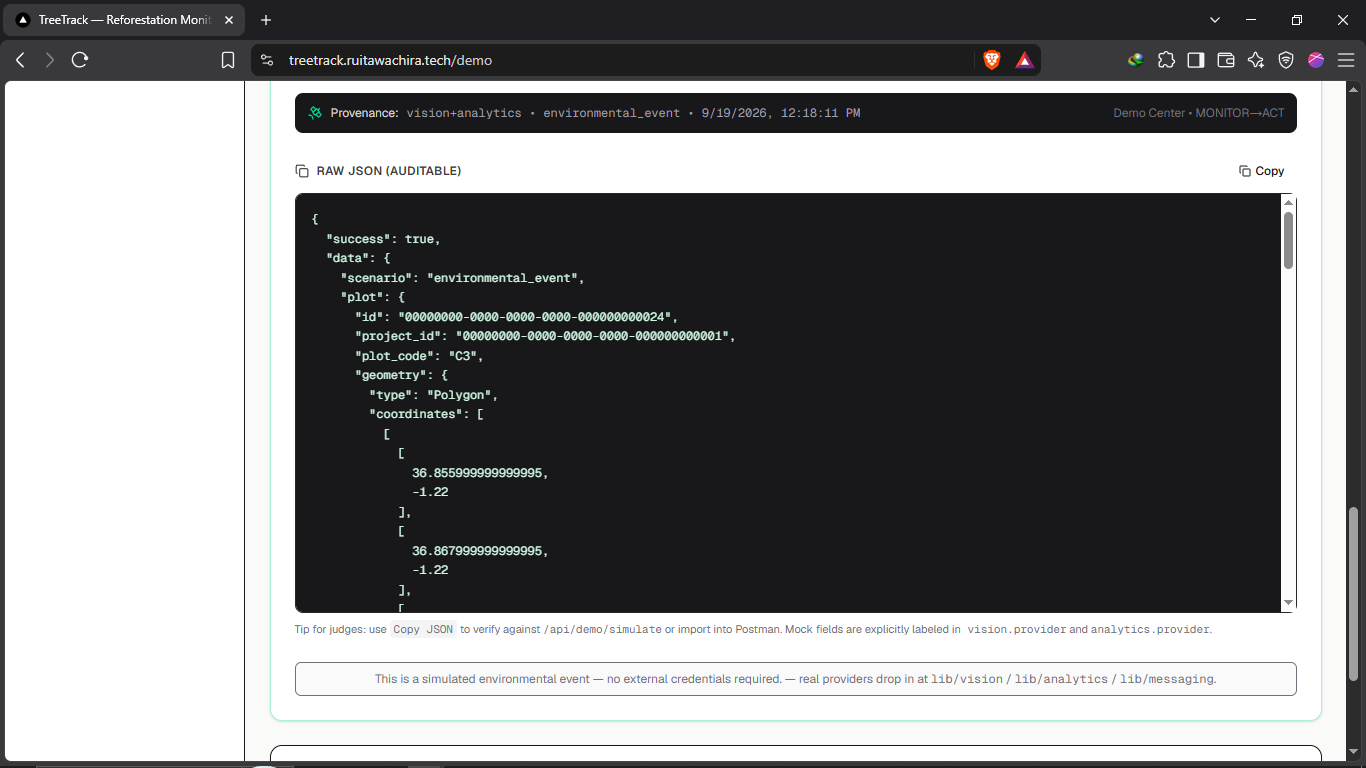
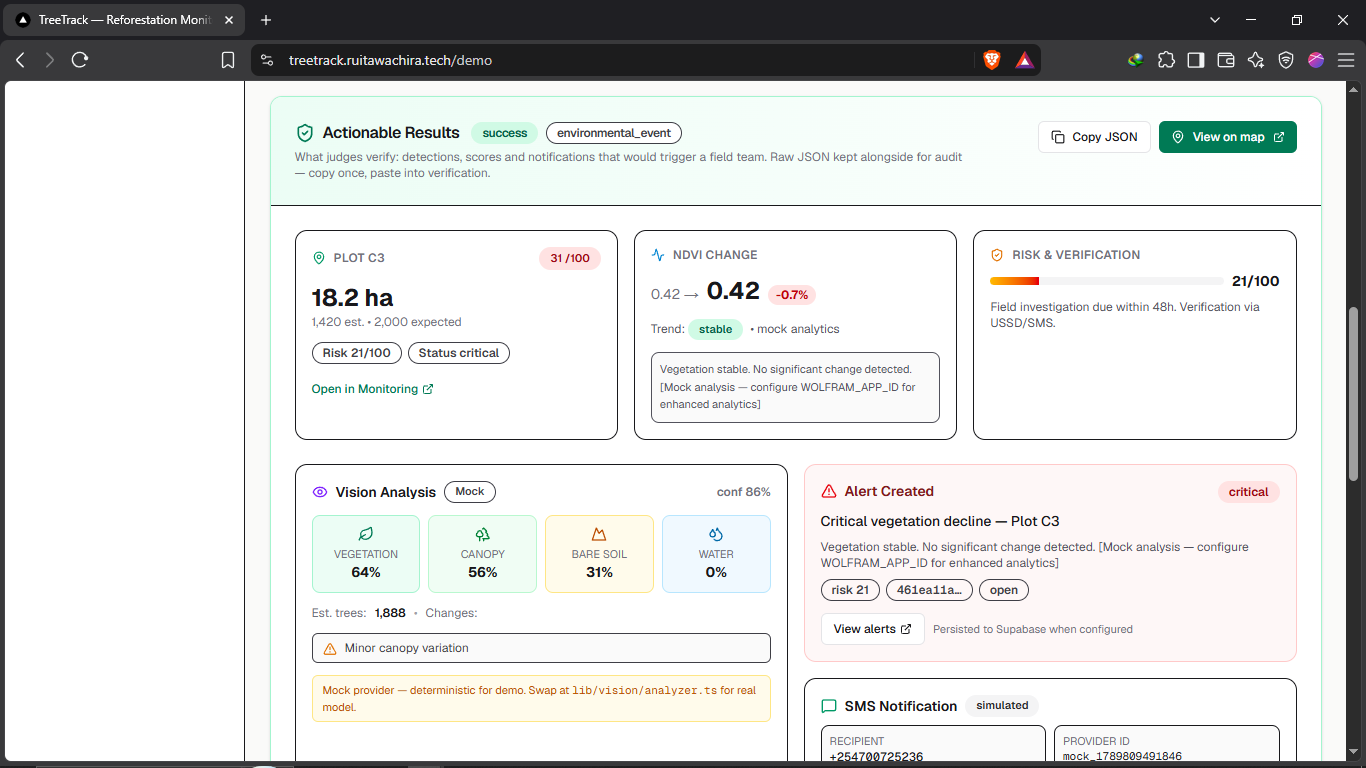
auditable json output
-
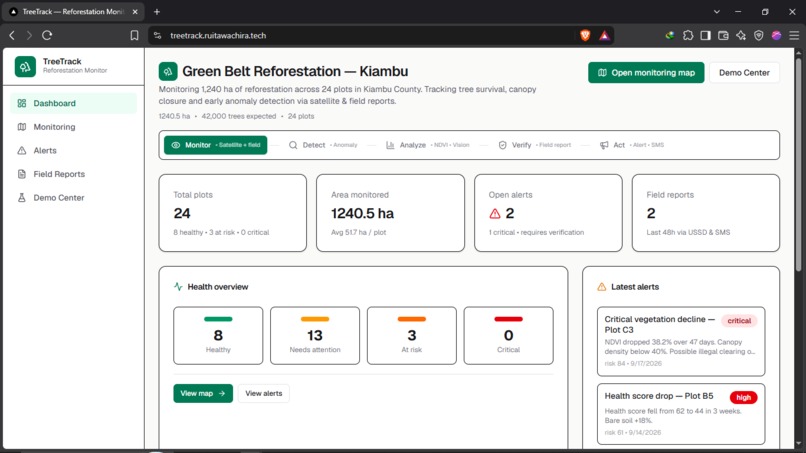
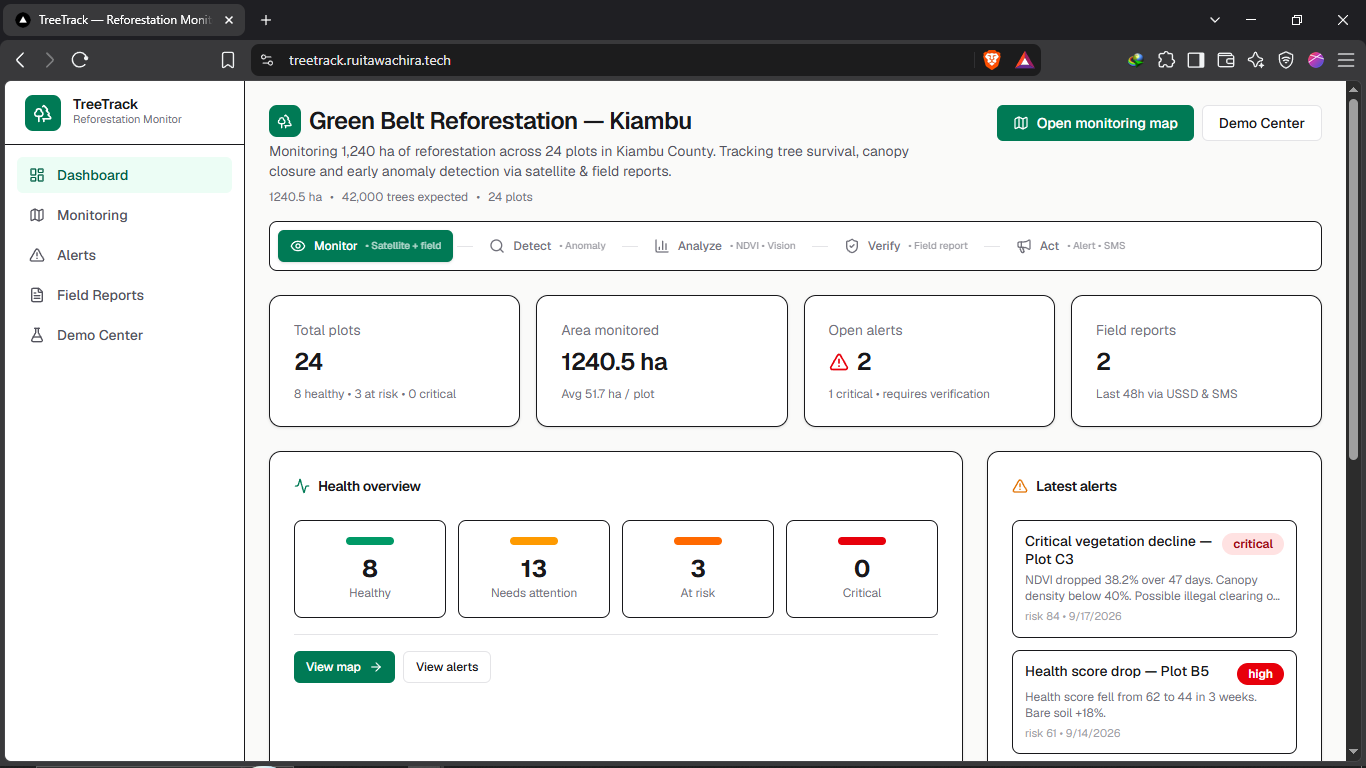
homepage dashboard
-
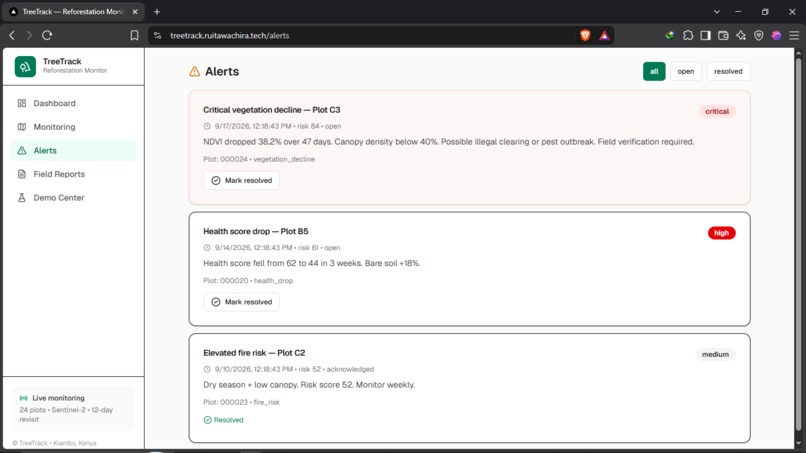
-
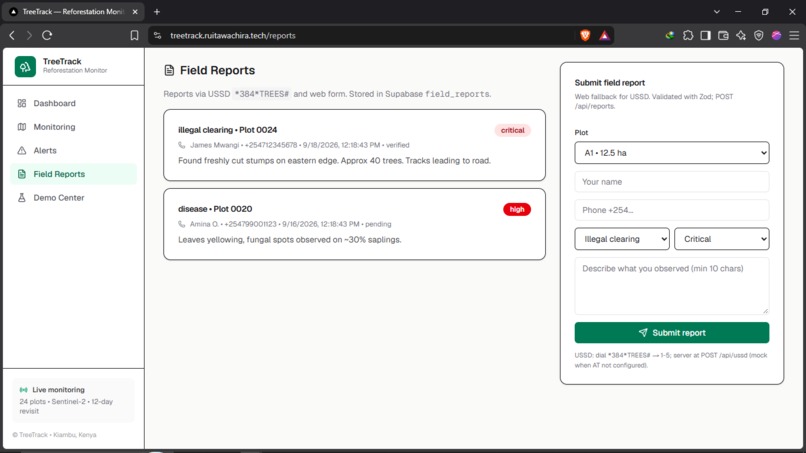
-
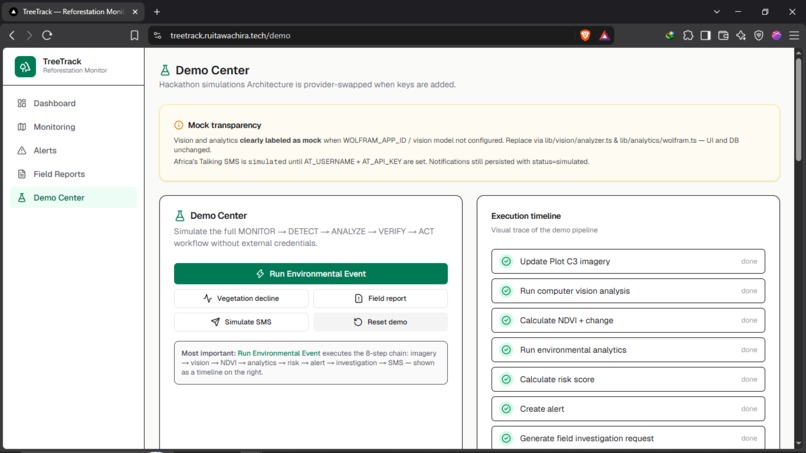
-
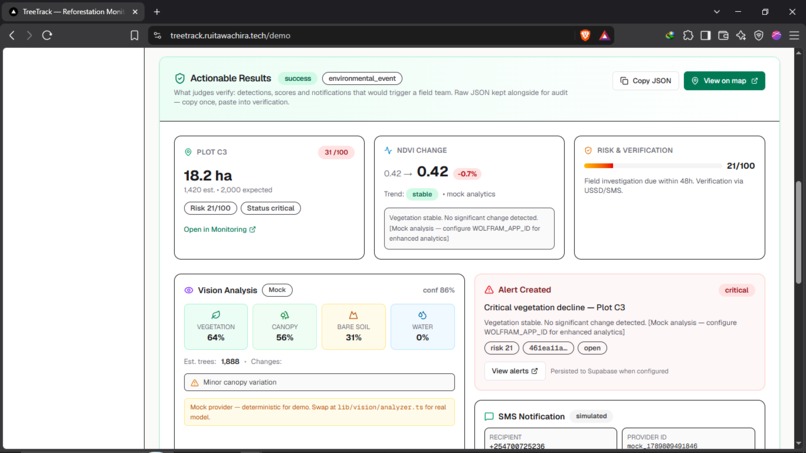
-
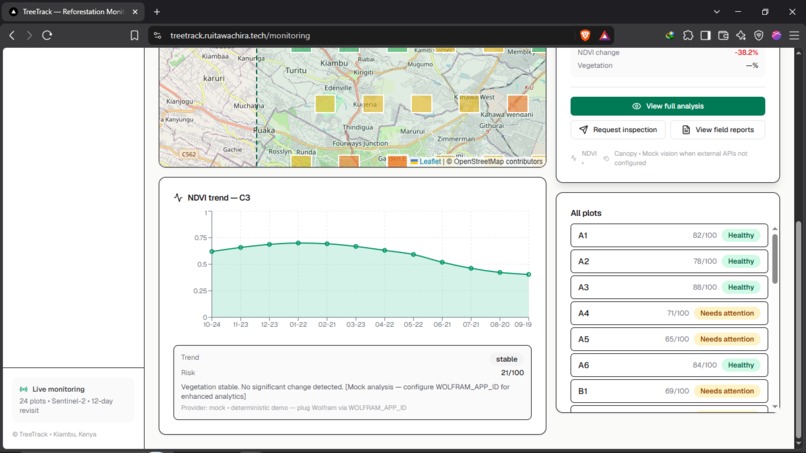
-
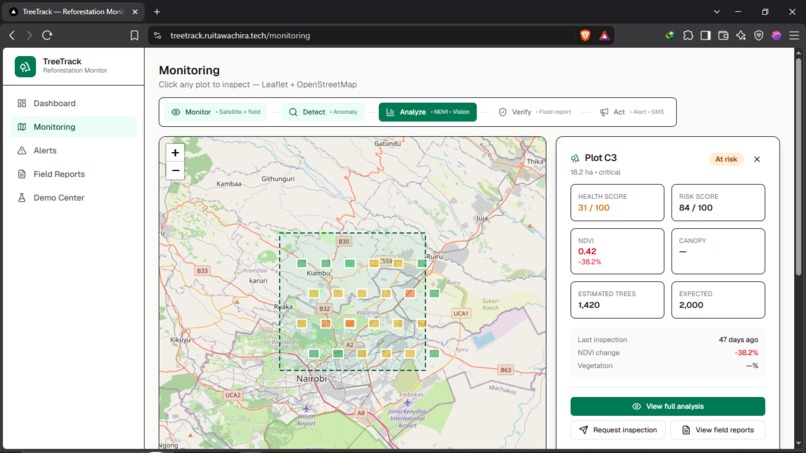
area map
-
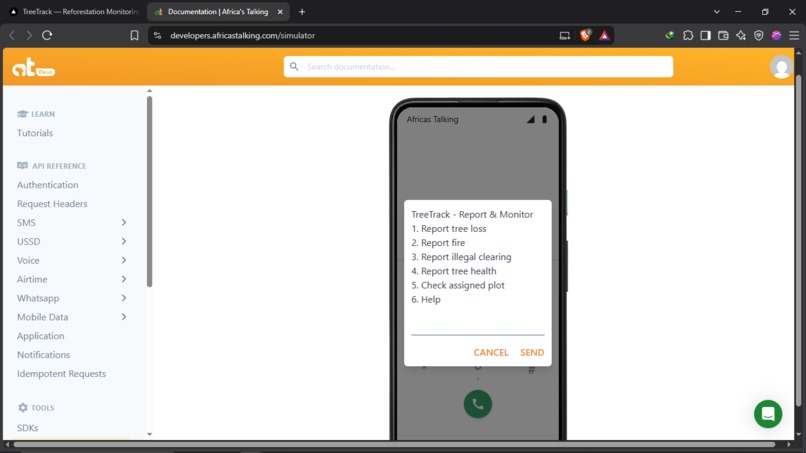
ussd
-
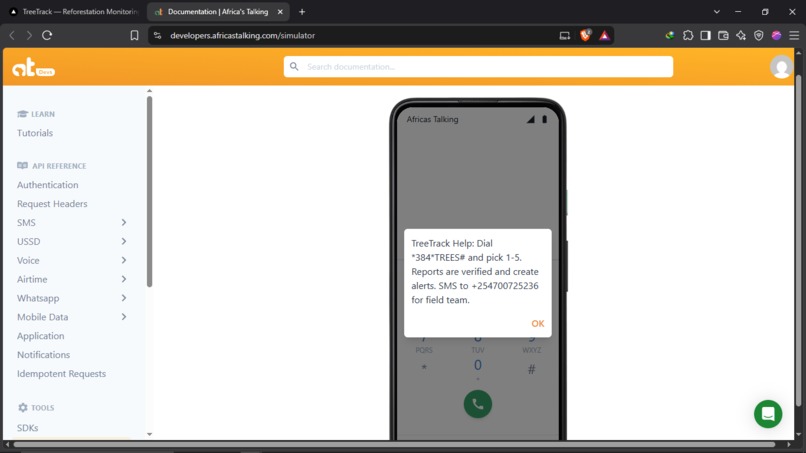
ussd
Inspiration
Planting a tree is only the beginning.
We were inspired by the restoration story of Karura Forest in Nairobi, where long-term community-led conservation has transformed a degraded urban forest. Friends of Karura Forest reports that indigenous tree cover has grown from about 25% to more than 60% over the restoration period, with restoration involving Kenya Forest Service, community groups, schools, corporations and volunteers.
But successful restoration creates another challenge: how do you continuously know whether restoration is actually working across a large area?
In November 2025, Friends of Karura Forest and the Kenya Forest Service planted 1,000 seedlings across one hectare using 45 indigenous species, while the wider restoration programme targeted additional hectares. The same report notes that community groups, schools and organizations participate in planting and that local workers are involved in preparing sites, planting and maintaining seedlings.
This made us think beyond the traditional question:
"How many trees did we plant?"
and towards:
"Are those trees surviving, is the ecosystem recovering, and where should people investigate first?"
That is the problem TreeTrack is designed to address.
Karura also demonstrates why this matters beyond the forest itself. The forest provides recreation, biodiversity and ecosystem services to Nairobi, while restoration activities create opportunities for local communities. Friends of Karura Forest reports forestry contracts, employment opportunities, community stewardship groups and educational activities connected to the forest.
TreeTrack is our attempt to build technology around that kind of community-centered restoration.
What it does
TreeTrack is a reforestation monitoring and environmental intelligence platform.
Instead of relying entirely on teams physically inspecting large areas of land, TreeTrack combines multiple sources of information:
Satellite imagery
       ↓
Computer vision
       ↓
Vegetation analysis
       ↓
Environmental analytics
       ↓
Anomaly detection
       ↓
Field verification
       ↓
Action
The platform divides a restoration project into monitoring plots and tracks indicators such as:
- Vegetation health
- NDVI
- Canopy density
- Estimated tree population
- Vegetation coverage
- Bare-soil changes
- Historical trends
- Field observations
- Environmental alerts
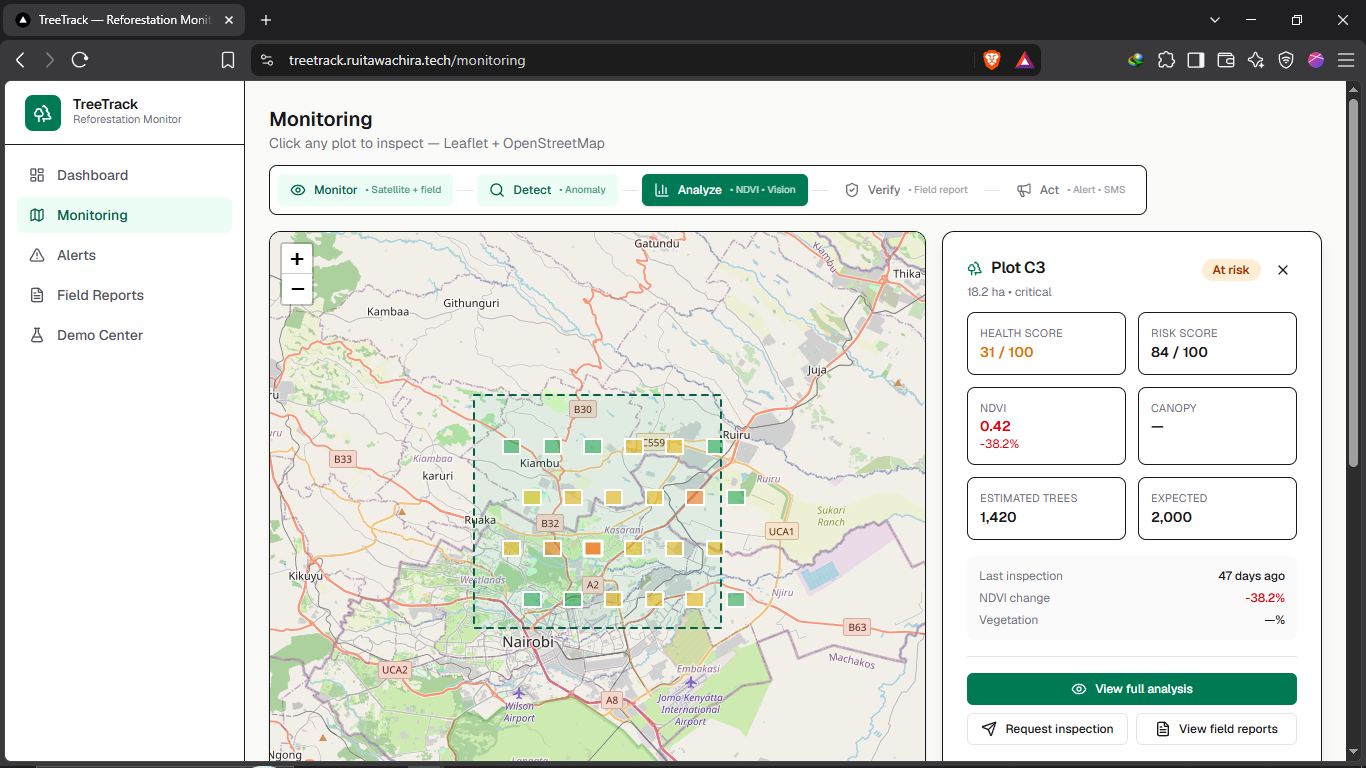
The result is a map that allows conservation teams to quickly identify areas that may require attention.
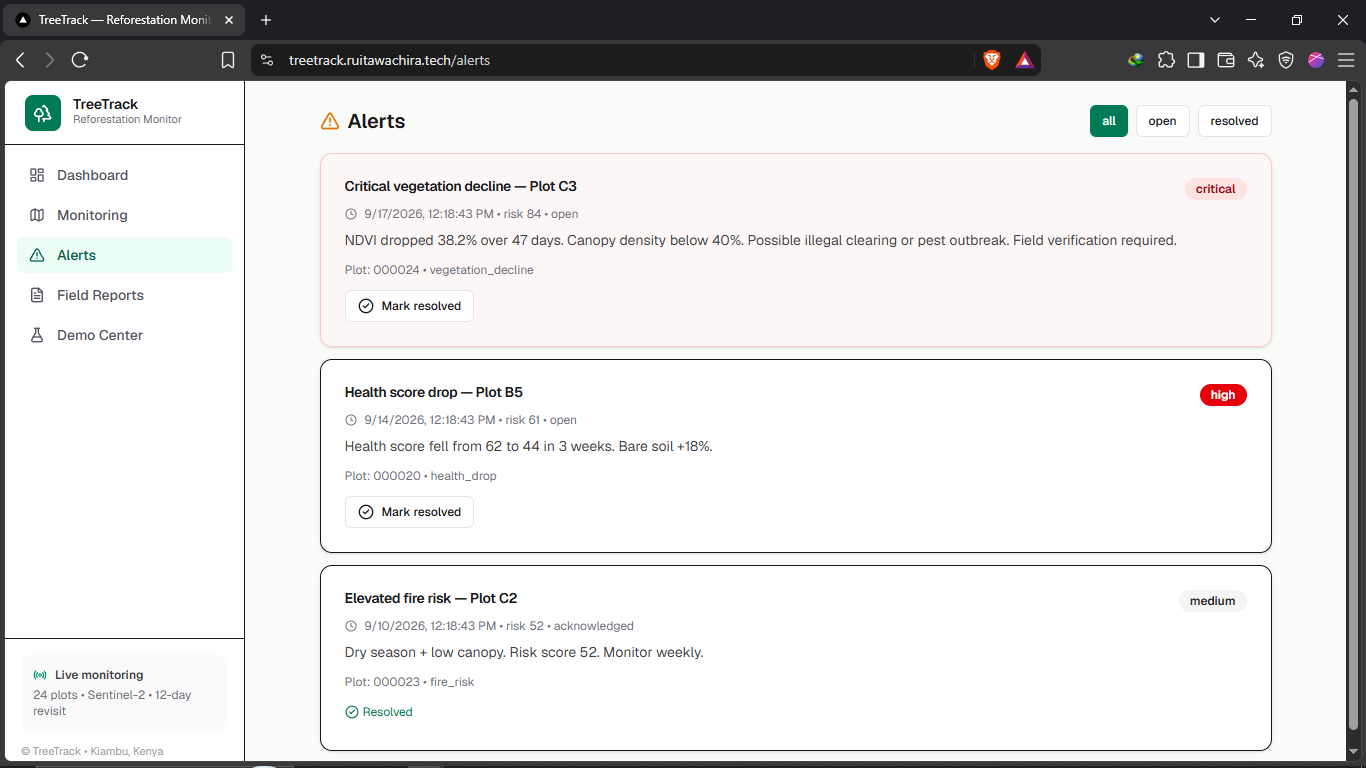
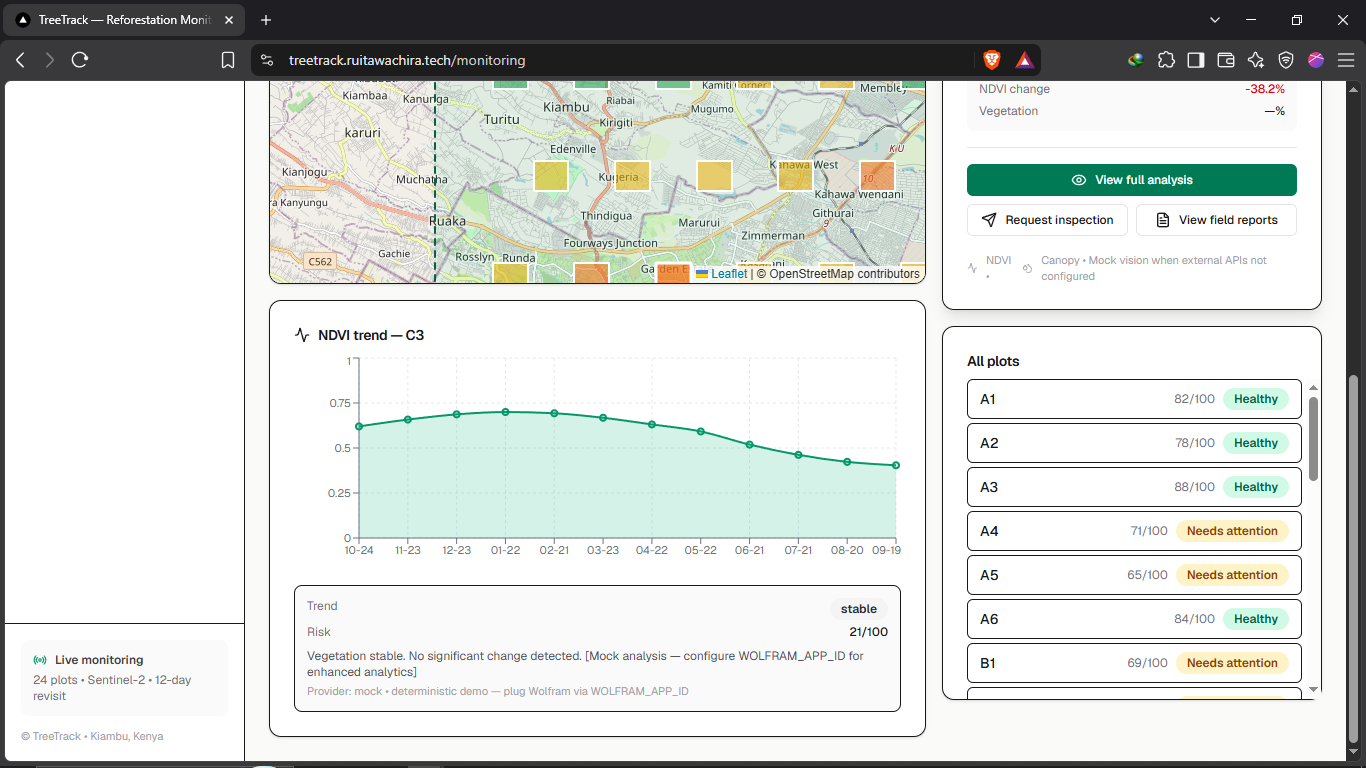
For example, TreeTrack's demonstration scenario contains a plot where NDVI falls from 0.68 to 0.42.
That represents a:
$$ \frac{0.42-0.68}{0.68}\times100 \approx -38.2\% $$
change in NDVI.
TreeTrack doesn't automatically assume why the change occurred. Instead, it flags the location for investigation.
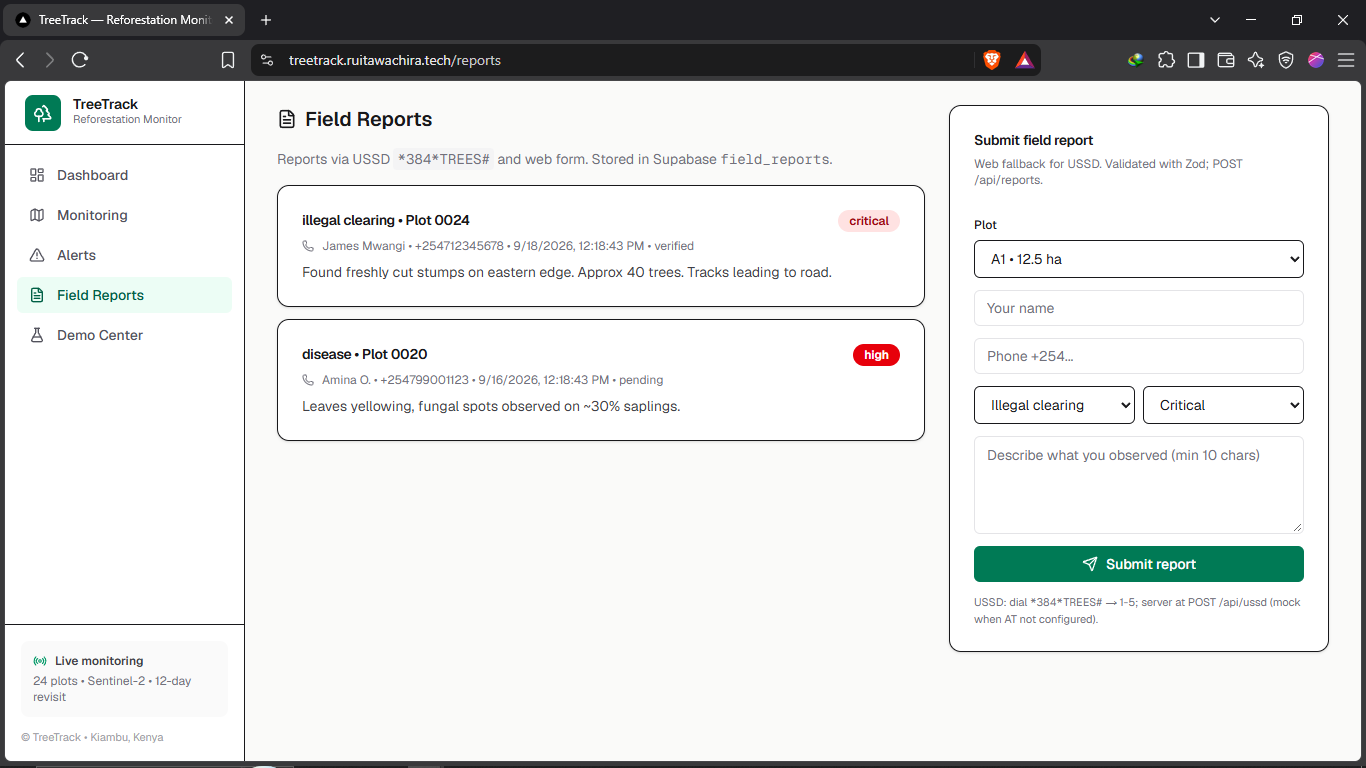
The system can then combine the satellite-derived anomaly with field reports.
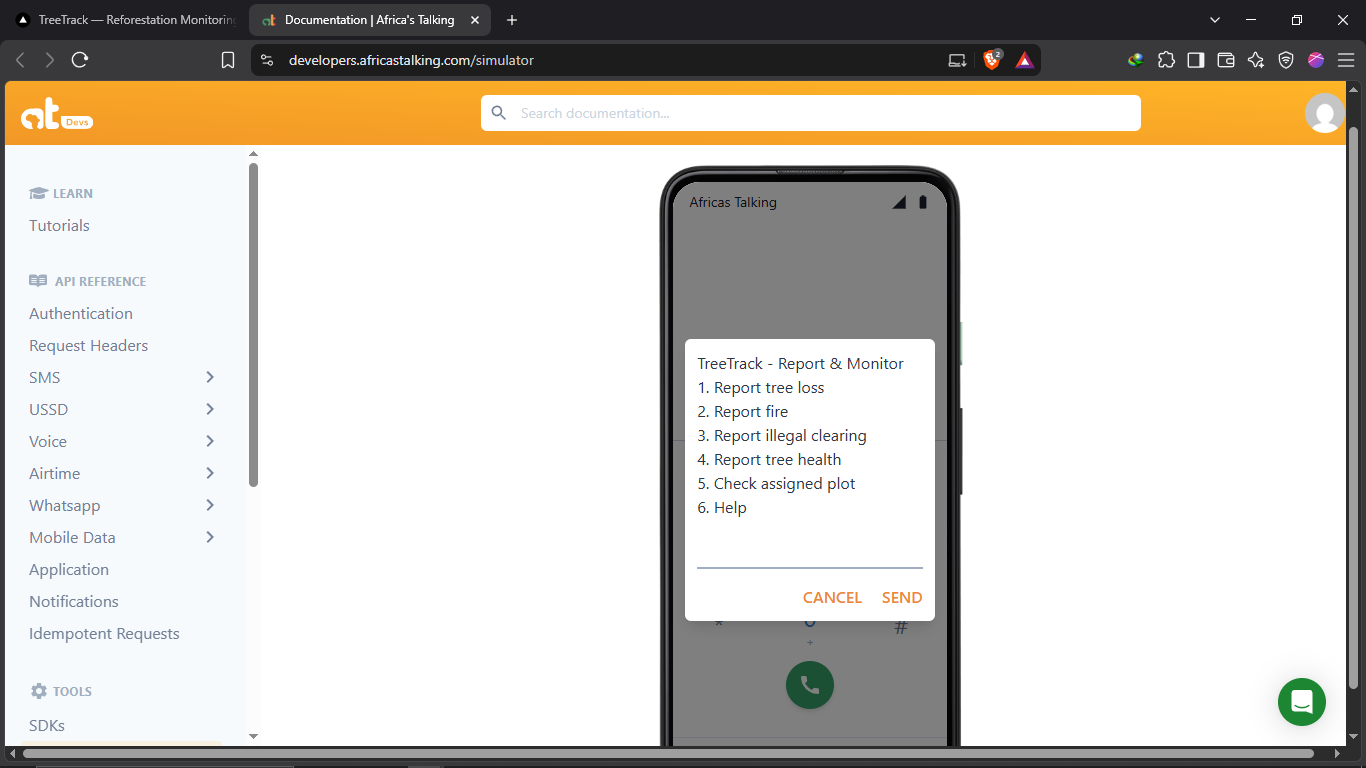
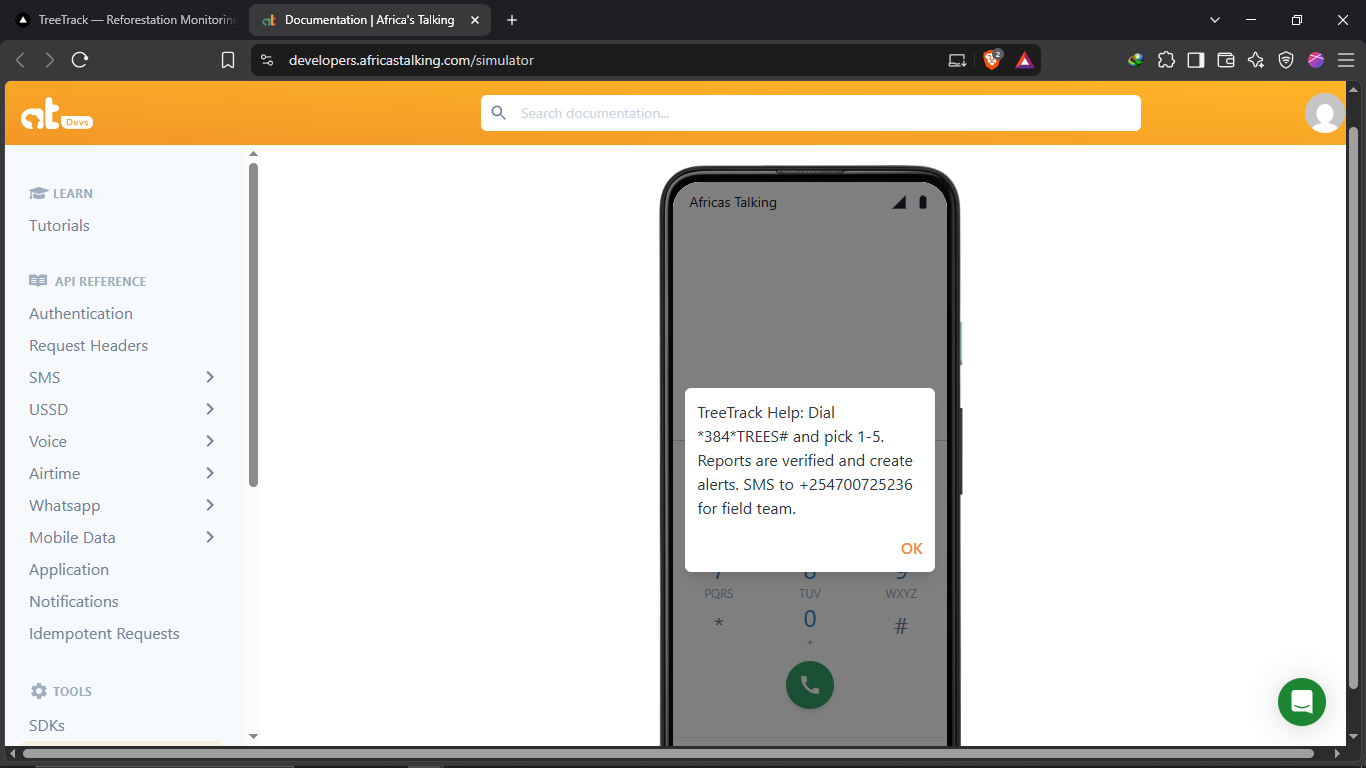
A ranger or community member can report an observation through SMS or USSD, allowing the environmental monitoring process to work even when the person on the ground does not have access to the full web application.
The dashboard then provides a single view of:
Monitor → Detect → Analyze → Verify → Act
How we built it
TreeTrack was built as a modern web application using:
- Next.js
- TypeScript
- Tailwind CSS
- shadcn/ui
- Leaflet / React-Leaflet
- Supabase
- PostgreSQL
- Recharts
- Africa's Talking APIs
- Wolfram-ready environmental analytics
- Computer-vision analysis abstractions
Mapping
We use Leaflet to visualize the monitored landscape.
Each restoration plot is represented as a geographic polygon, allowing users to select individual areas and inspect their environmental health.
The map acts as the central interface between the data and the physical landscape.
Instead of looking at hundreds of rows in a spreadsheet, a conservation team can immediately see where potential problems are occurring.
Environmental monitoring
TreeTrack tracks vegetation observations over time.
One of the primary metrics is NDVI:
$$ NDVI = \frac{NIR - Red}{NIR + Red} $$
NDVI provides a way of quantifying vegetation conditions from multispectral imagery.
TreeTrack stores historical observations so that a single measurement is not treated as the entire story. Trends and changes over time are more useful for identifying areas that deserve investigation.
Computer vision
Computer vision provides another layer of analysis.
The system is designed around an image-analysis pipeline that can identify characteristics such as:
- Vegetation coverage
- Canopy density
- Bare soil
- Water
- Estimated tree count
- Potential changes between observations
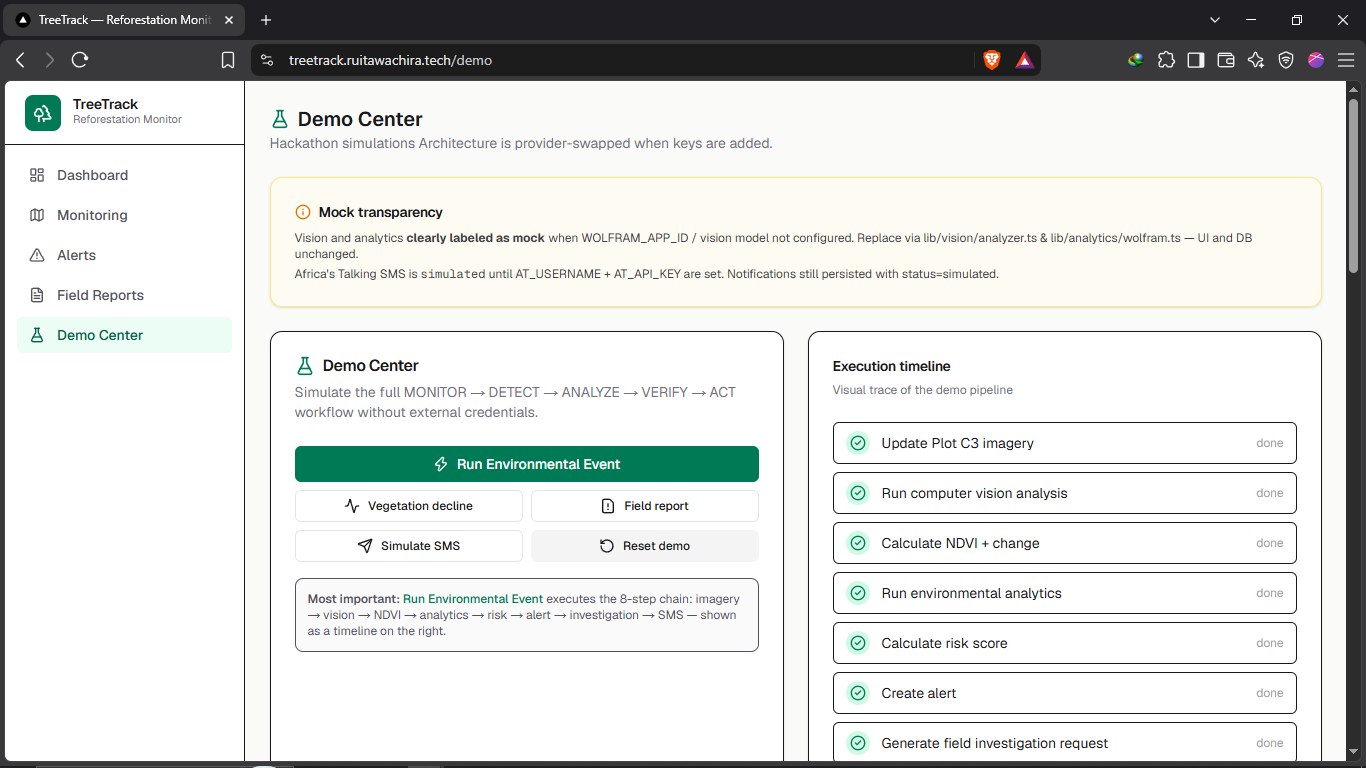
For the hackathon MVP, we created a provider architecture that allows the demonstration environment to use deterministic/mock analysis while remaining ready for a production computer-vision model.
This was important because we wanted the product architecture to demonstrate how the system would work at scale, without pretending that a mock analysis was real AI inference.
Environmental analytics
We designed TreeTrack's analytics layer to be Wolfram-ready.
The analytical layer can calculate statistics such as:
- Mean vegetation values
- Standard deviation
- Percentage change
- Historical trends
- Anomaly scores
- Moving averages
The idea is to use mathematical analysis to determine whether a change is unusual relative to the plot's historical behavior.
Rather than simply saying:
"NDVI went down."
TreeTrack can say:
"A significant vegetation decline has been detected. Field verification is recommended."
Africa's Talking
One of our goals was to make the system usable by people who may not be sitting in front of a dashboard.
TreeTrack therefore includes SMS and USSD workflows through Africa's Talking.
A field worker can report events such as:
1. Report tree loss
2. Report fire
3. Report illegal clearing
4. Report tree health
Those reports become structured environmental events inside the platform.
This creates a useful feedback loop:
Satellite
    ↓
Detect anomaly
    ↓
Notify field team
    ↓
Field worker investigates
    ↓
SMS / USSD report
    ↓
TreeTrack
The technology therefore doesn't replace people on the ground.
It helps them decide where their attention is needed.
Supabase
Supabase provides the database and storage layer for the MVP.
We use it to store:
- Projects
- Monitoring plots
- Vegetation observations
- Imagery metadata
- Computer-vision analyses
- Environmental events
- Field reports
- Alerts
- Notifications
The architecture was deliberately designed so external services can be replaced without rebuilding the entire application.
Challenges we ran into
1. Monitoring a large area is different from monitoring a tree
Our first instinct was to think about individual trees.
That quickly becomes difficult at scale.
If an organization has tens or hundreds of thousands of trees, tracking every individual tree continuously becomes expensive and operationally complicated.
We therefore shifted the model towards plot-level environmental monitoring.
Instead of asking:
"Where is tree #17,428?"
TreeTrack asks:
"Which parts of this landscape are changing?"
That makes satellite monitoring, spatial analysis and field verification much more practical.
2. Satellite data is powerful but imperfect
A vegetation index does not tell us why something changed.
A decline could be related to many different factors.
That meant we had to be careful not to turn an anomaly into an automatic diagnosis.
TreeTrack therefore treats satellite analysis as a trigger for investigation, not as an unquestionable source of truth.
3. External APIs can become a hackathon bottleneck
Real satellite imagery, computer vision APIs, Wolfram services and messaging APIs all introduce external dependencies.
We didn't want the entire demonstration to fail because one API key was unavailable.
We solved this by designing provider abstractions and mock implementations.
The demo can therefore run end-to-end while still having clear integration points for production services.
4. Turning environmental data into something understandable
Environmental datasets can quickly become overwhelming.
We focused the interface around a simple question:
Where should I investigate?
That led us to prioritize the map, environmental health scores, anomaly alerts and plot-level analysis instead of presenting users with a wall of raw data.
Accomplishments that we're proud of
We are proud that TreeTrack turned a complex environmental monitoring problem into a workflow that can be understood in seconds:
Monitor → Detect → Analyze → Verify → Act
We built an interactive geospatial dashboard capable of monitoring more than a thousand hectares across multiple plots in the demonstration environment.
We also built a complete anomaly scenario.
A plot can move from:
Healthy
   ↓
Vegetation decline
   ↓
NDVI anomaly
   ↓
Risk score
   ↓
Alert
   ↓
Field verification
The system can then simulate the notification and reporting process.
We're particularly proud of the connection between remote sensing and community participation.
The satellite sees the landscape from above.
The computer vision layer interprets what is visible.
The analytics layer quantifies change.
But the person on the ground provides the context.
That combination is what we believe makes TreeTrack more useful than a simple tree-counting dashboard.
What we learned
Restoration is a process, not an event
One of the biggest lessons from researching Karura was that restoration is measured in years, not planting days.
Karura's restoration story includes long-term removal of degraded exotic plantations, regeneration, enrichment planting and ongoing maintenance. Friends of Karura Forest reports that indigenous cover has increased substantially over more than a decade of restoration.
That reinforced the central idea behind TreeTrack:
A tree planted today is not necessarily a tree surviving tomorrow.
Data needs context
A number such as NDVI = 0.42 is not very useful by itself.
It becomes useful when compared with:
- previous observations
- neighboring plots
- historical conditions
- expected vegetation
- field observations
We learned that environmental intelligence is less about collecting more numbers and more about putting those numbers into context.
Technology should augment field teams
We initially imagined the system primarily as an automated monitoring platform.
During development, we realized that automation is most valuable when it helps humans prioritize their limited time.
Instead of sending a team to inspect 1,000 hectares, TreeTrack can help identify the areas that deserve attention first.
Community involvement matters
Karura's restoration demonstrates how conservation can involve community organizations, schools, corporations, volunteers and local workers. FKF reports that local women and youth groups have participated in forest restoration work, while its wider community programme includes employment, forestry contracts, education and stewardship.
That influenced our decision to include SMS and USSD rather than designing TreeTrack exclusively around smartphone users.
What's next for TreeTrack
The MVP demonstrates the core workflow, but there is a lot more that could be built.
Real satellite imagery
The next step would be integrating production satellite imagery pipelines so that projects can automatically receive updated observations and compare historical imagery.
The current architecture is designed to allow real imagery providers to replace the demonstration imagery layer.
Production computer vision
We would replace the demonstration vision provider with trained models capable of detecting:
- Tree canopy
- Tree mortality
- Bare soil
- Fire scars
- Deforestation
- Invasive vegetation
- Changes in land cover
Drone integration
For areas flagged by satellite monitoring, drones could provide higher-resolution imagery.
This creates a useful hierarchy:
Satellite
Large area / low detail
        ↓
Computer vision
Identify anomaly
        ↓
Drone
Small area / high detail
        ↓
Field team
Ground verification
Carbon and ecosystem metrics
Future versions could incorporate additional measurements for:
- Carbon sequestration
- Biomass
- Biodiversity
- Water retention
- Soil health
- Restoration progress
Community restoration network
We would also like TreeTrack to become more than an internal monitoring tool.
Communities could report environmental events, participate in restoration programmes, receive alerts and see the measurable impact of their conservation work.
Scaling beyond forests
The same architecture could eventually monitor:
- Wetlands
- Agricultural restoration
- Mangrove restoration
- Urban green spaces
- Watersheds
- Grasslands
- Community conservation areas
The long-term vision is simple:
Make environmental change visible, measurable and actionable.
TreeTrack started with a question inspired by Karura:
How do we know whether restoration is actually working?
Our answer is to combine technology that can see the landscape at scale with people who understand what is happening on the ground.
Built With
- africastalking
- leaflet.js
- nextjs
- supabase
- wolfram-technologies

Log in or sign up for Devpost to join the conversation.