Inspiration
Everyone building on a taste graph starts by assuming they already know who the audience is. A city, a country, a genre. A film sales agent at a market makes that assumption forty times a day: this one plays in Germany, that one is for Latin America.
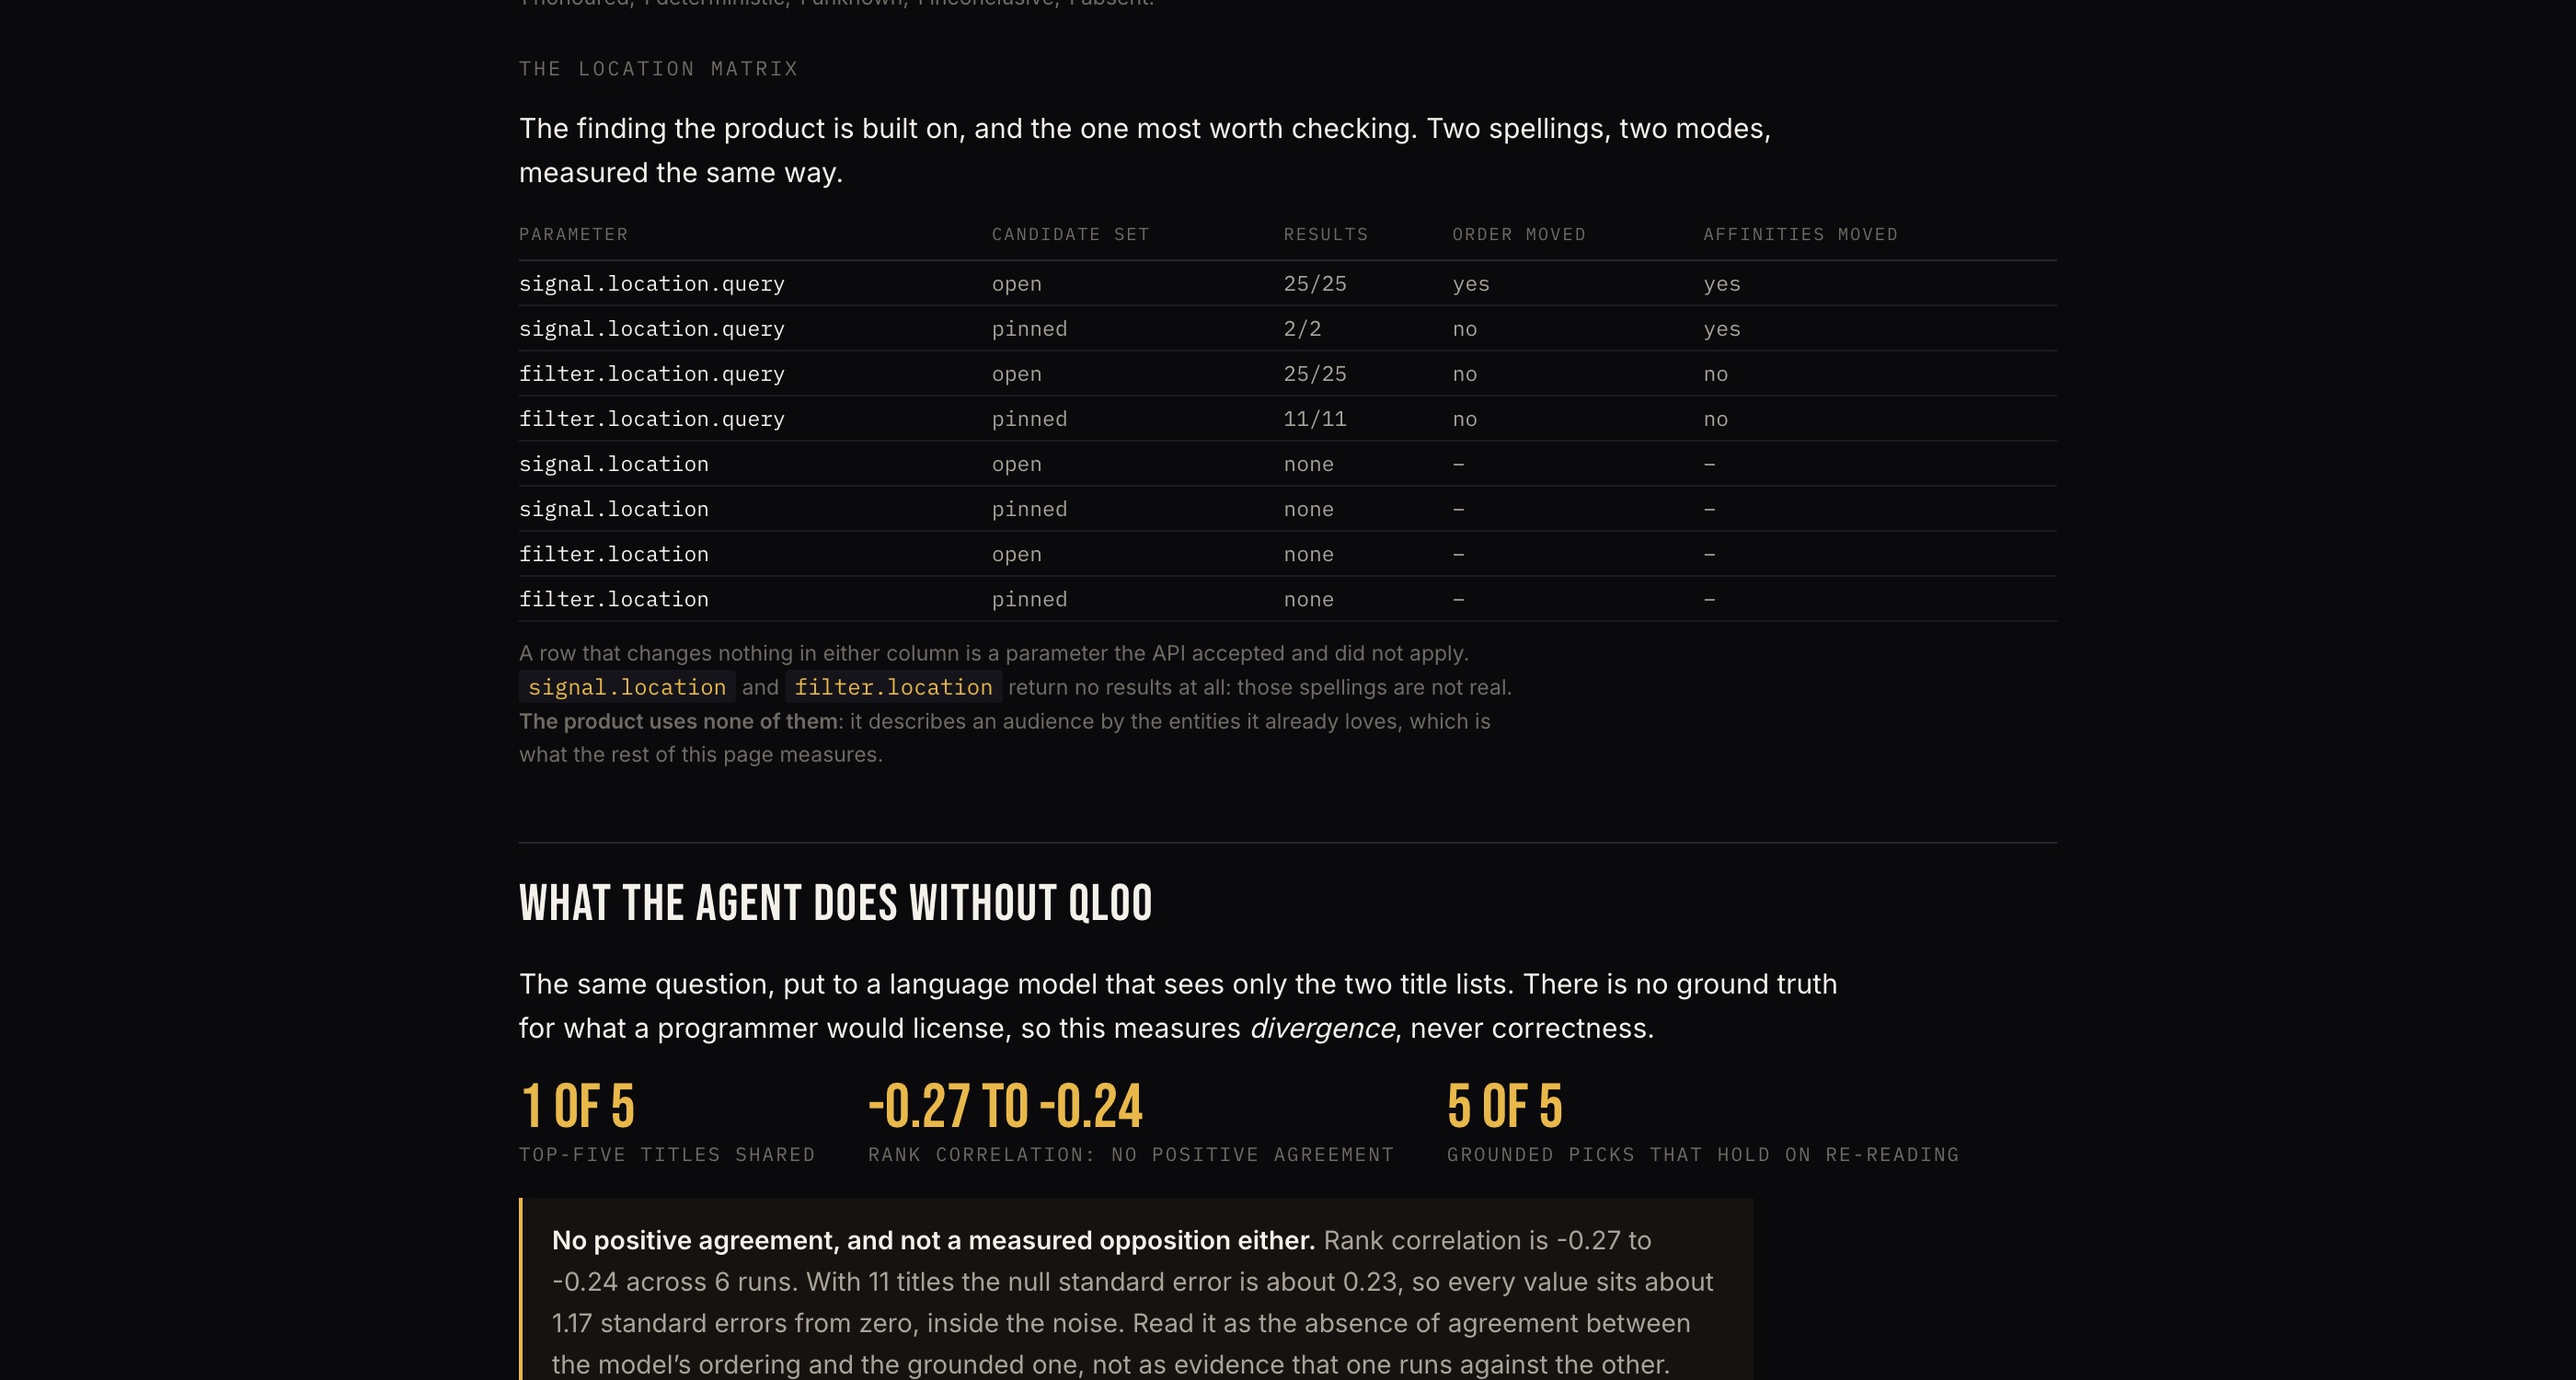
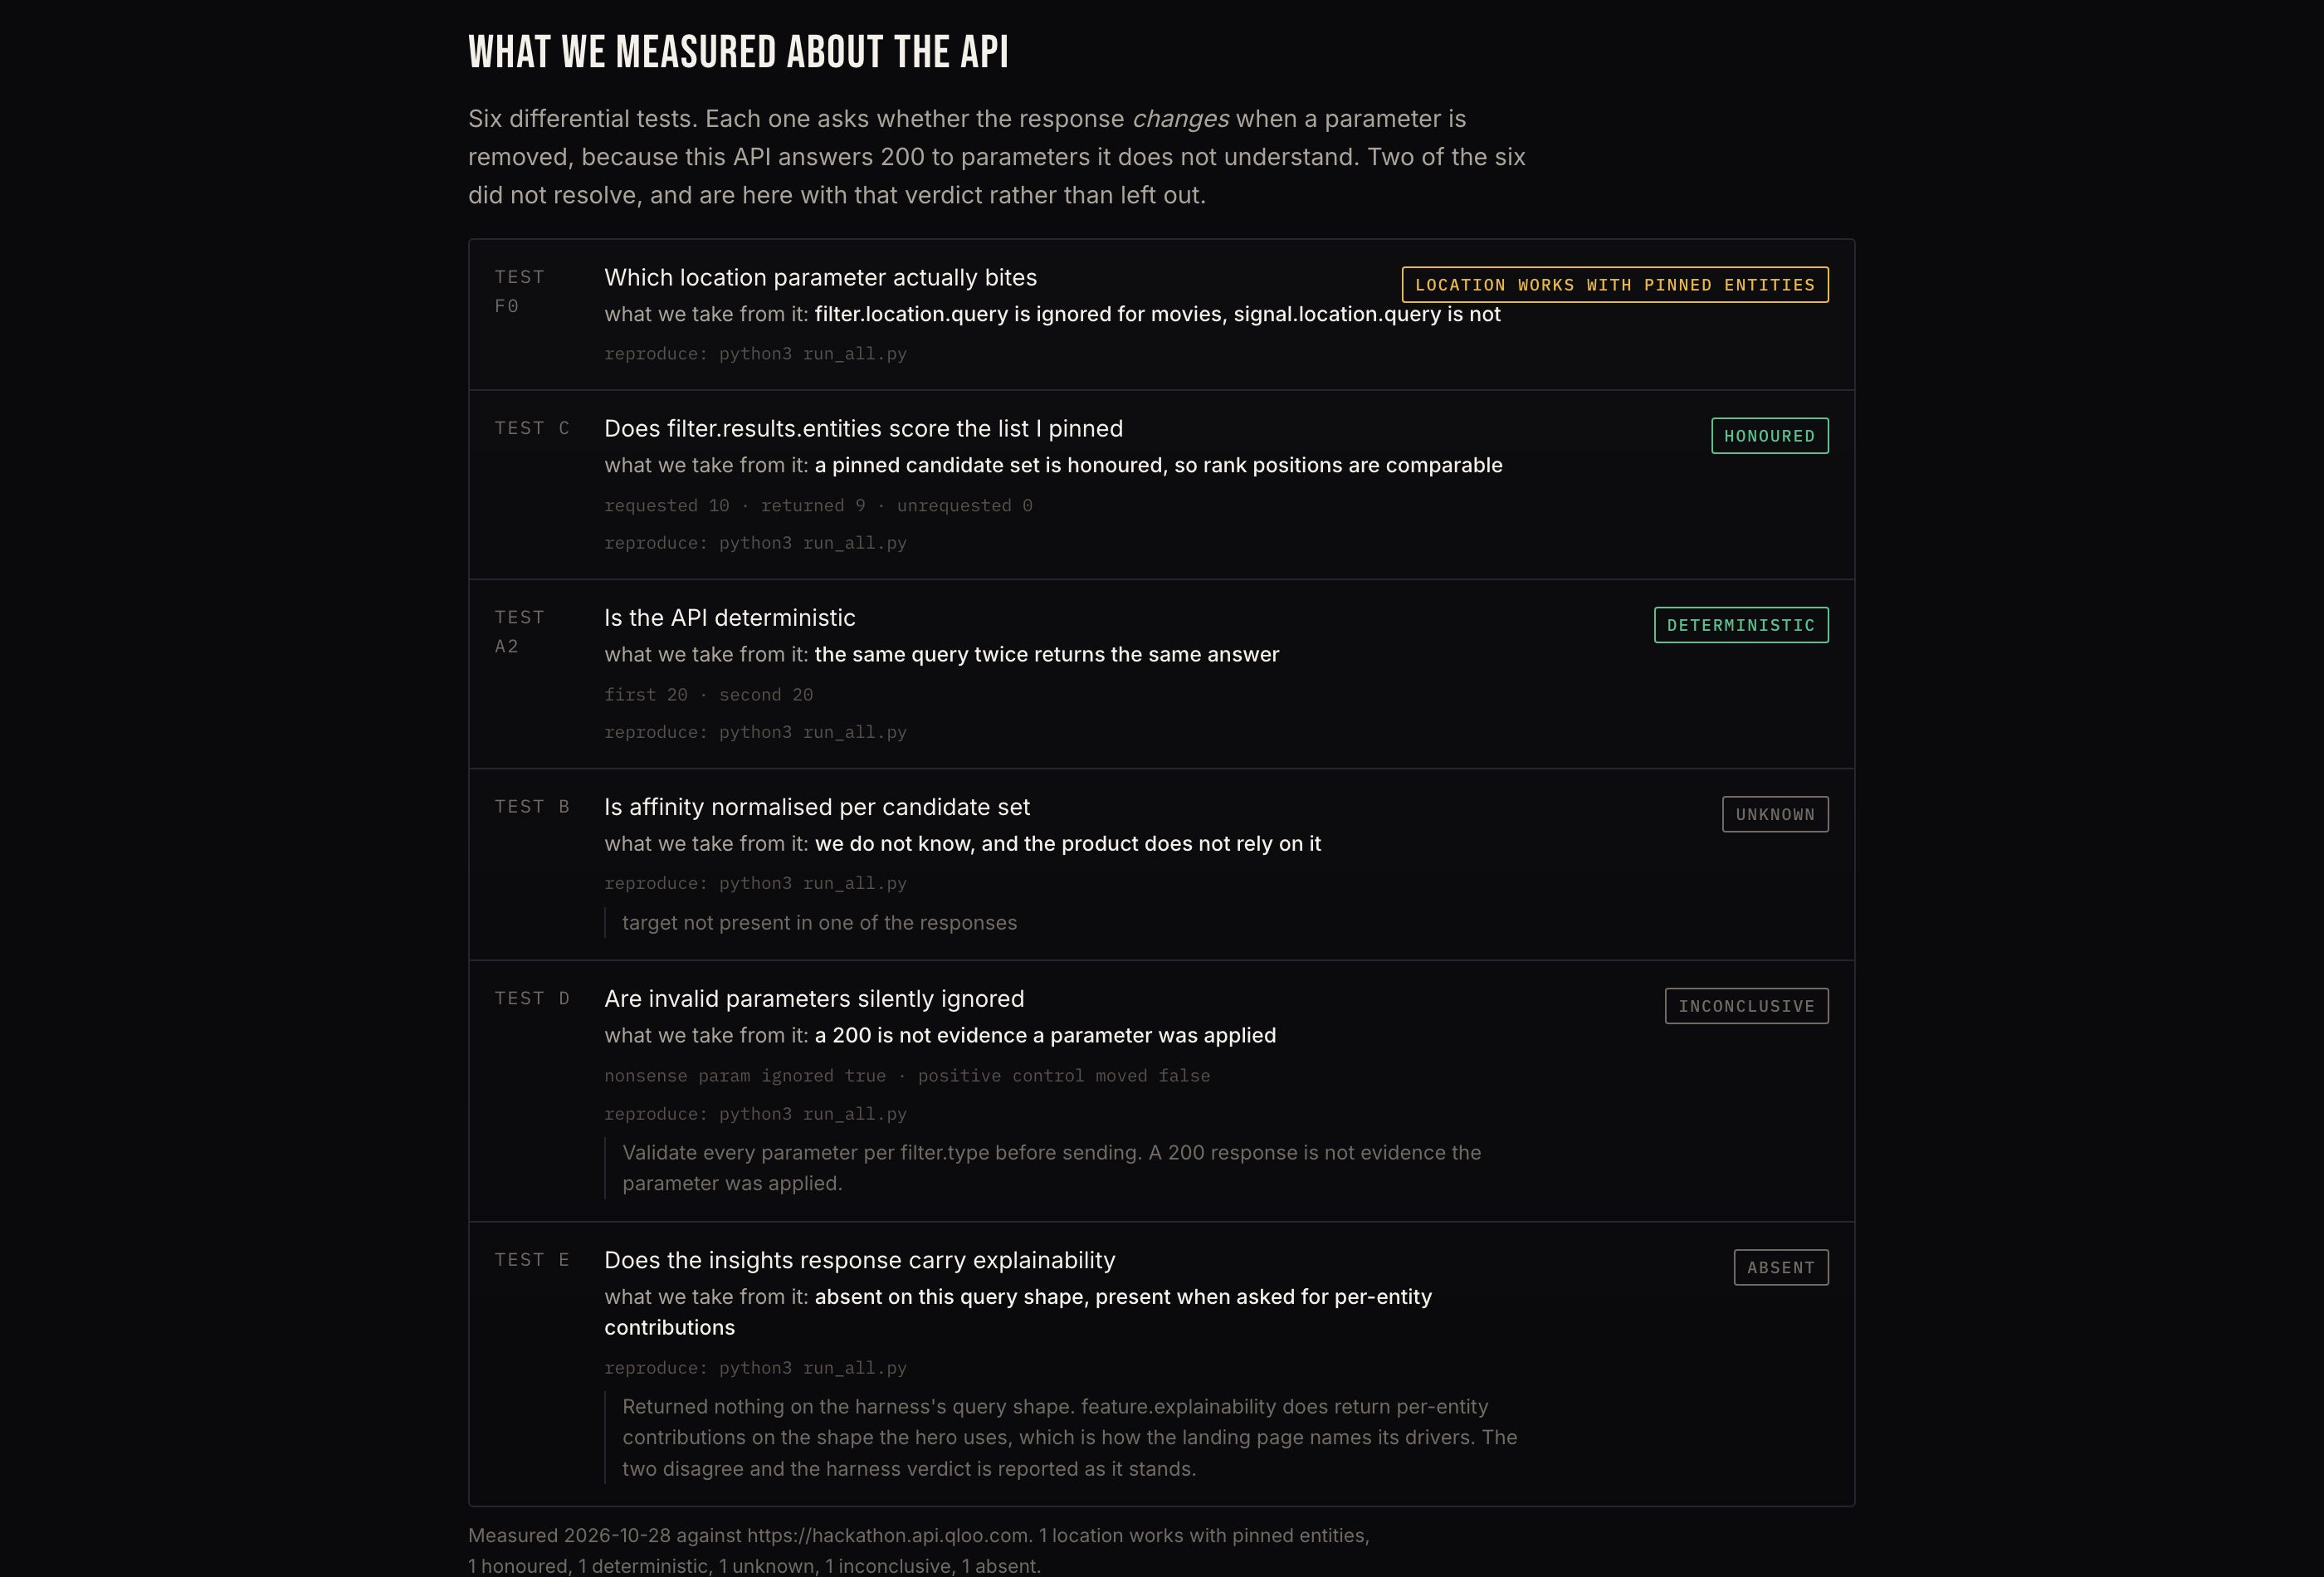
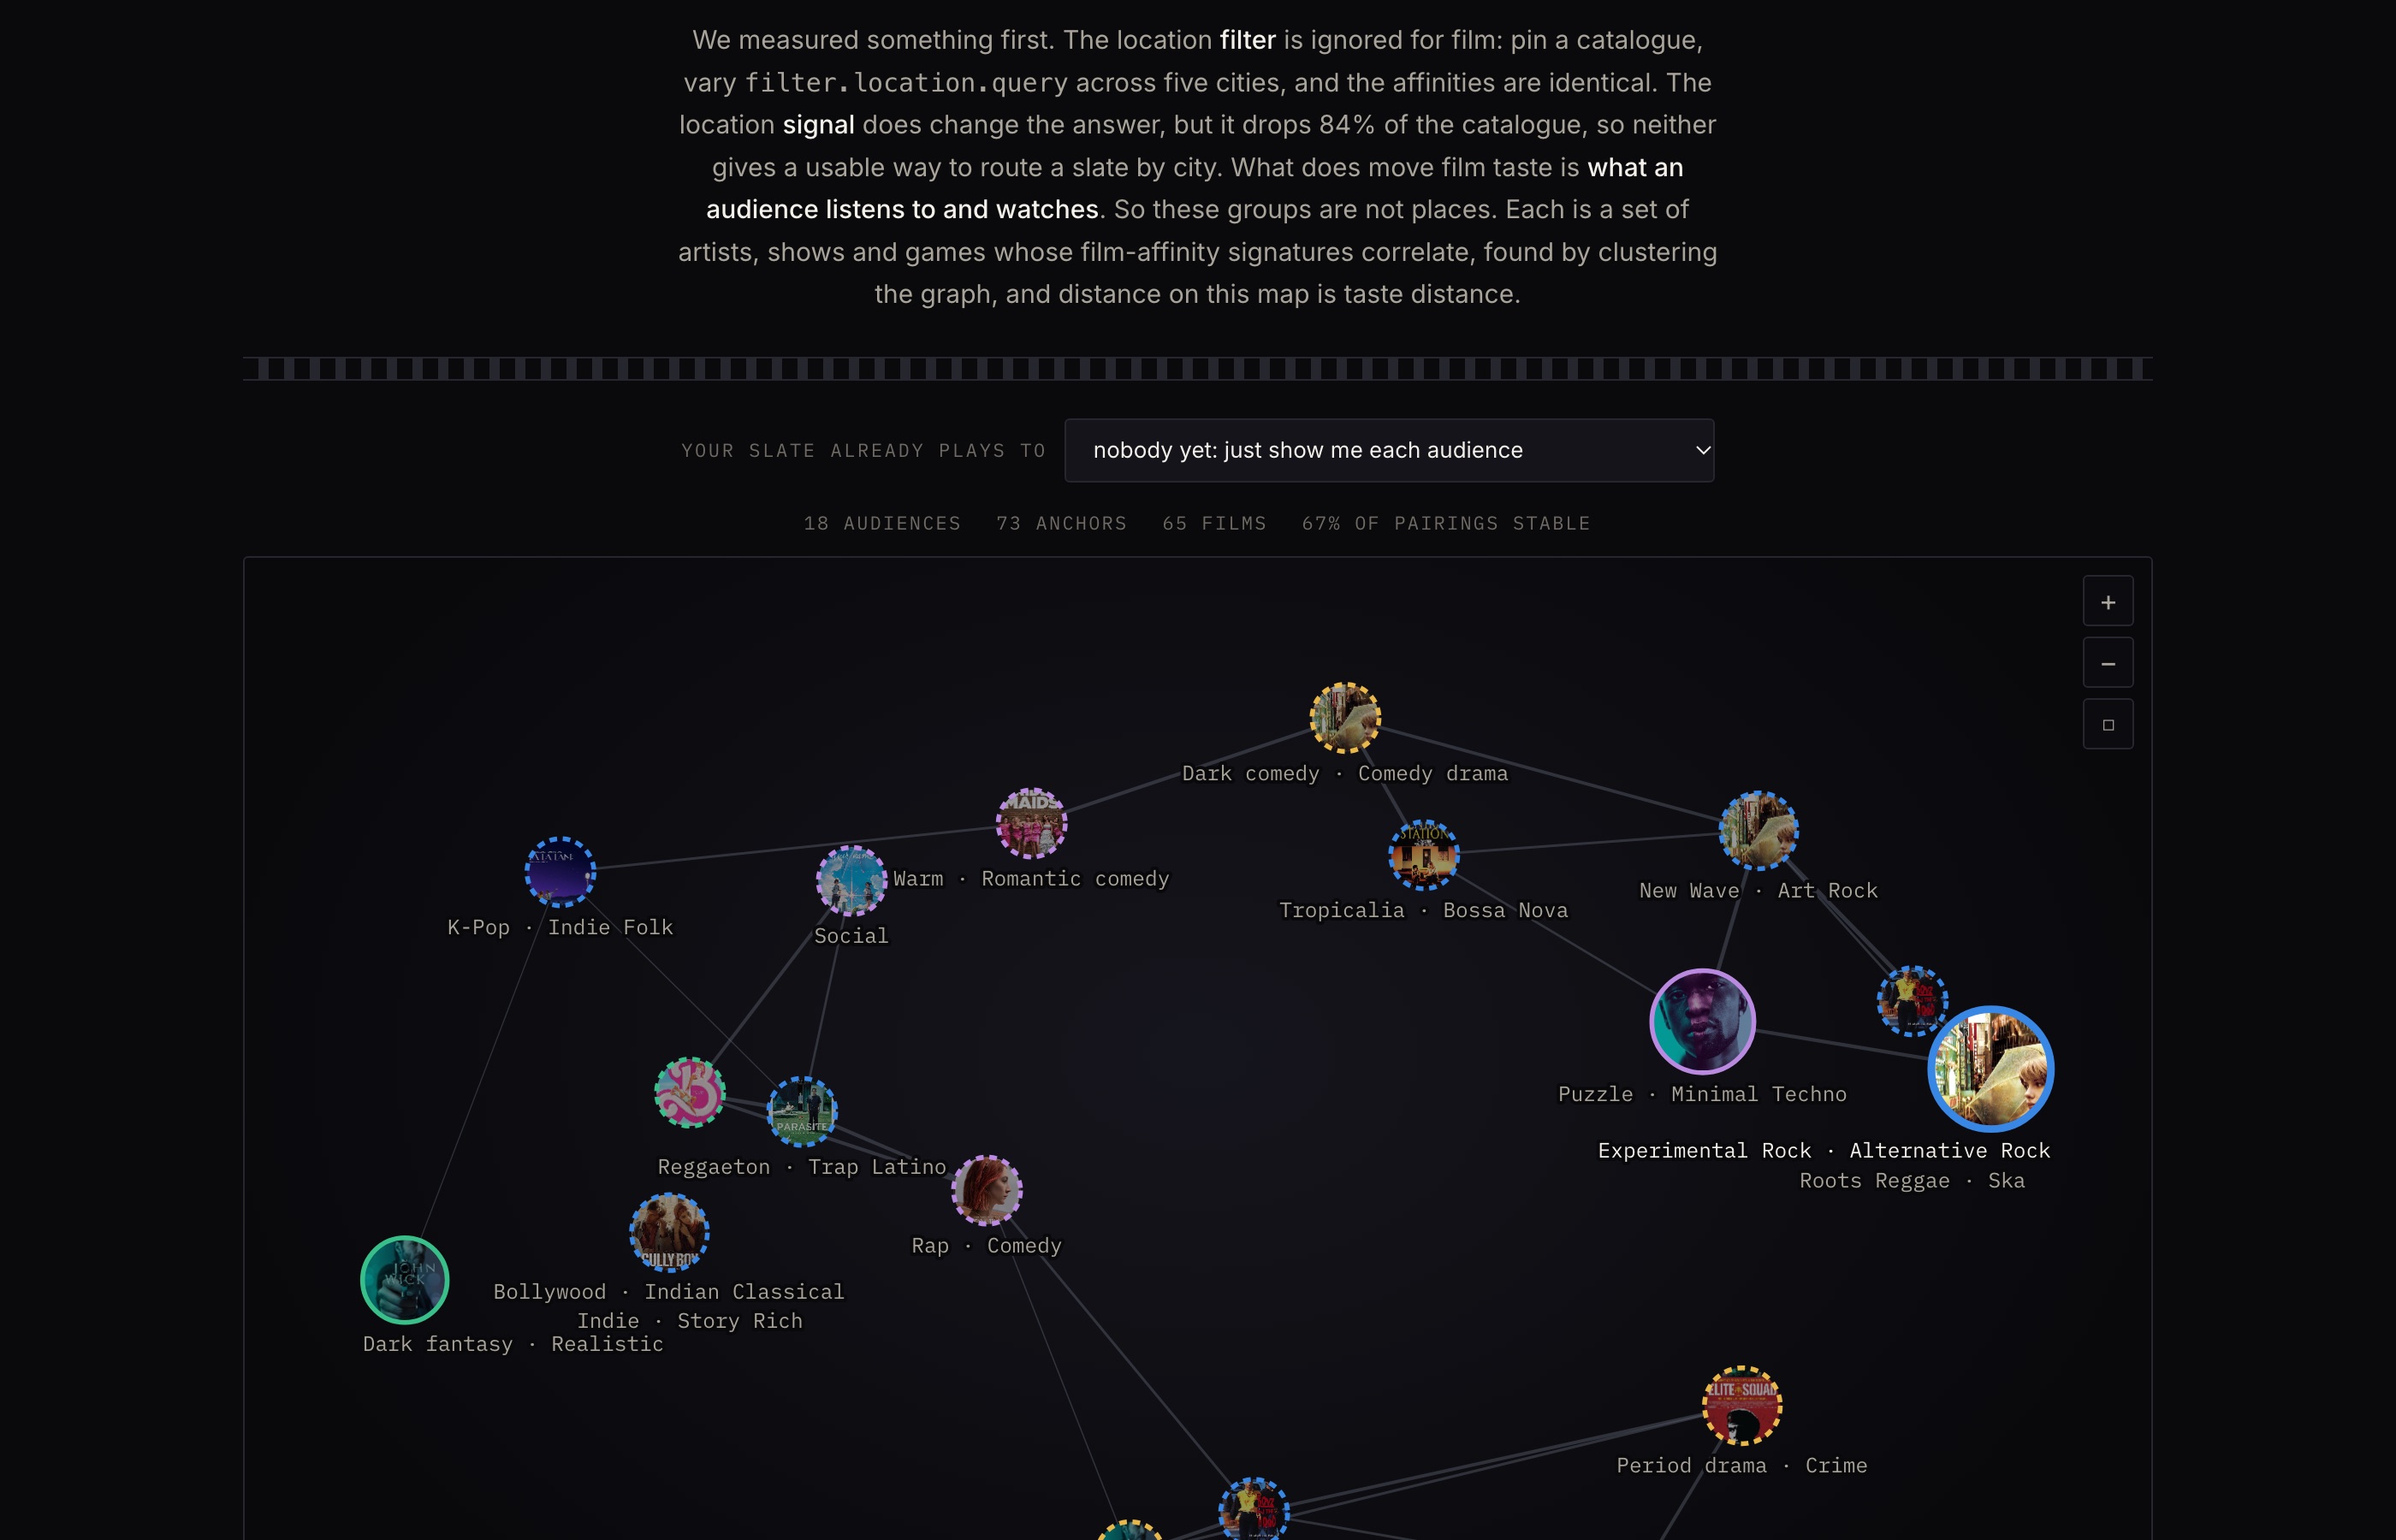
We decided to test the assumption against the API before building anything on top of it. It failed outright. Pin a catalogue and vary filter.location.query across New York, São Paulo, Tokyo, Mumbai and Berlin, and the affinities come back identical to four decimal places. Location does not move film taste in Qloo's model at all.
That single measurement rebuilt the product. If place is not the unit, what is? What an audience listens to and watches. So the agent stops assuming who an audience is and discovers it from the graph instead.
What it does
The Taste Atlas turns Qloo's taste graph into the decision a film sales agent actually makes: which titles to put in front of this buyer.
The Map. 18 audiences discovered by clustering 73 cultural anchors (musicians, TV shows, video games) by their film-affinity signatures across 65 films. Average linkage at correlation 0.75, laid out by multidimensional scaling so distance on the map is taste distance. Each audience names itself from the Qloo tags its members share. The whole map is precomputed, so exploring it costs no API calls.
The groups that come out are smaller and stranger than marketing segments: Racionais MC's with Snowfall and The Sopranos; Ben Klock with Fela Kuti, Journey and Breath of the Wild. No city, no genre, no postcode.
The Pitch desk. Bring your own slate, and describe a buyer the way the industry already does: by what they have already licensed. The agent builds the buyer's profile from those titles, ranks your slate against it, and measures each title against the audience your slate already plays to. It arrives prefilled with a worked example, so it works on the first click.
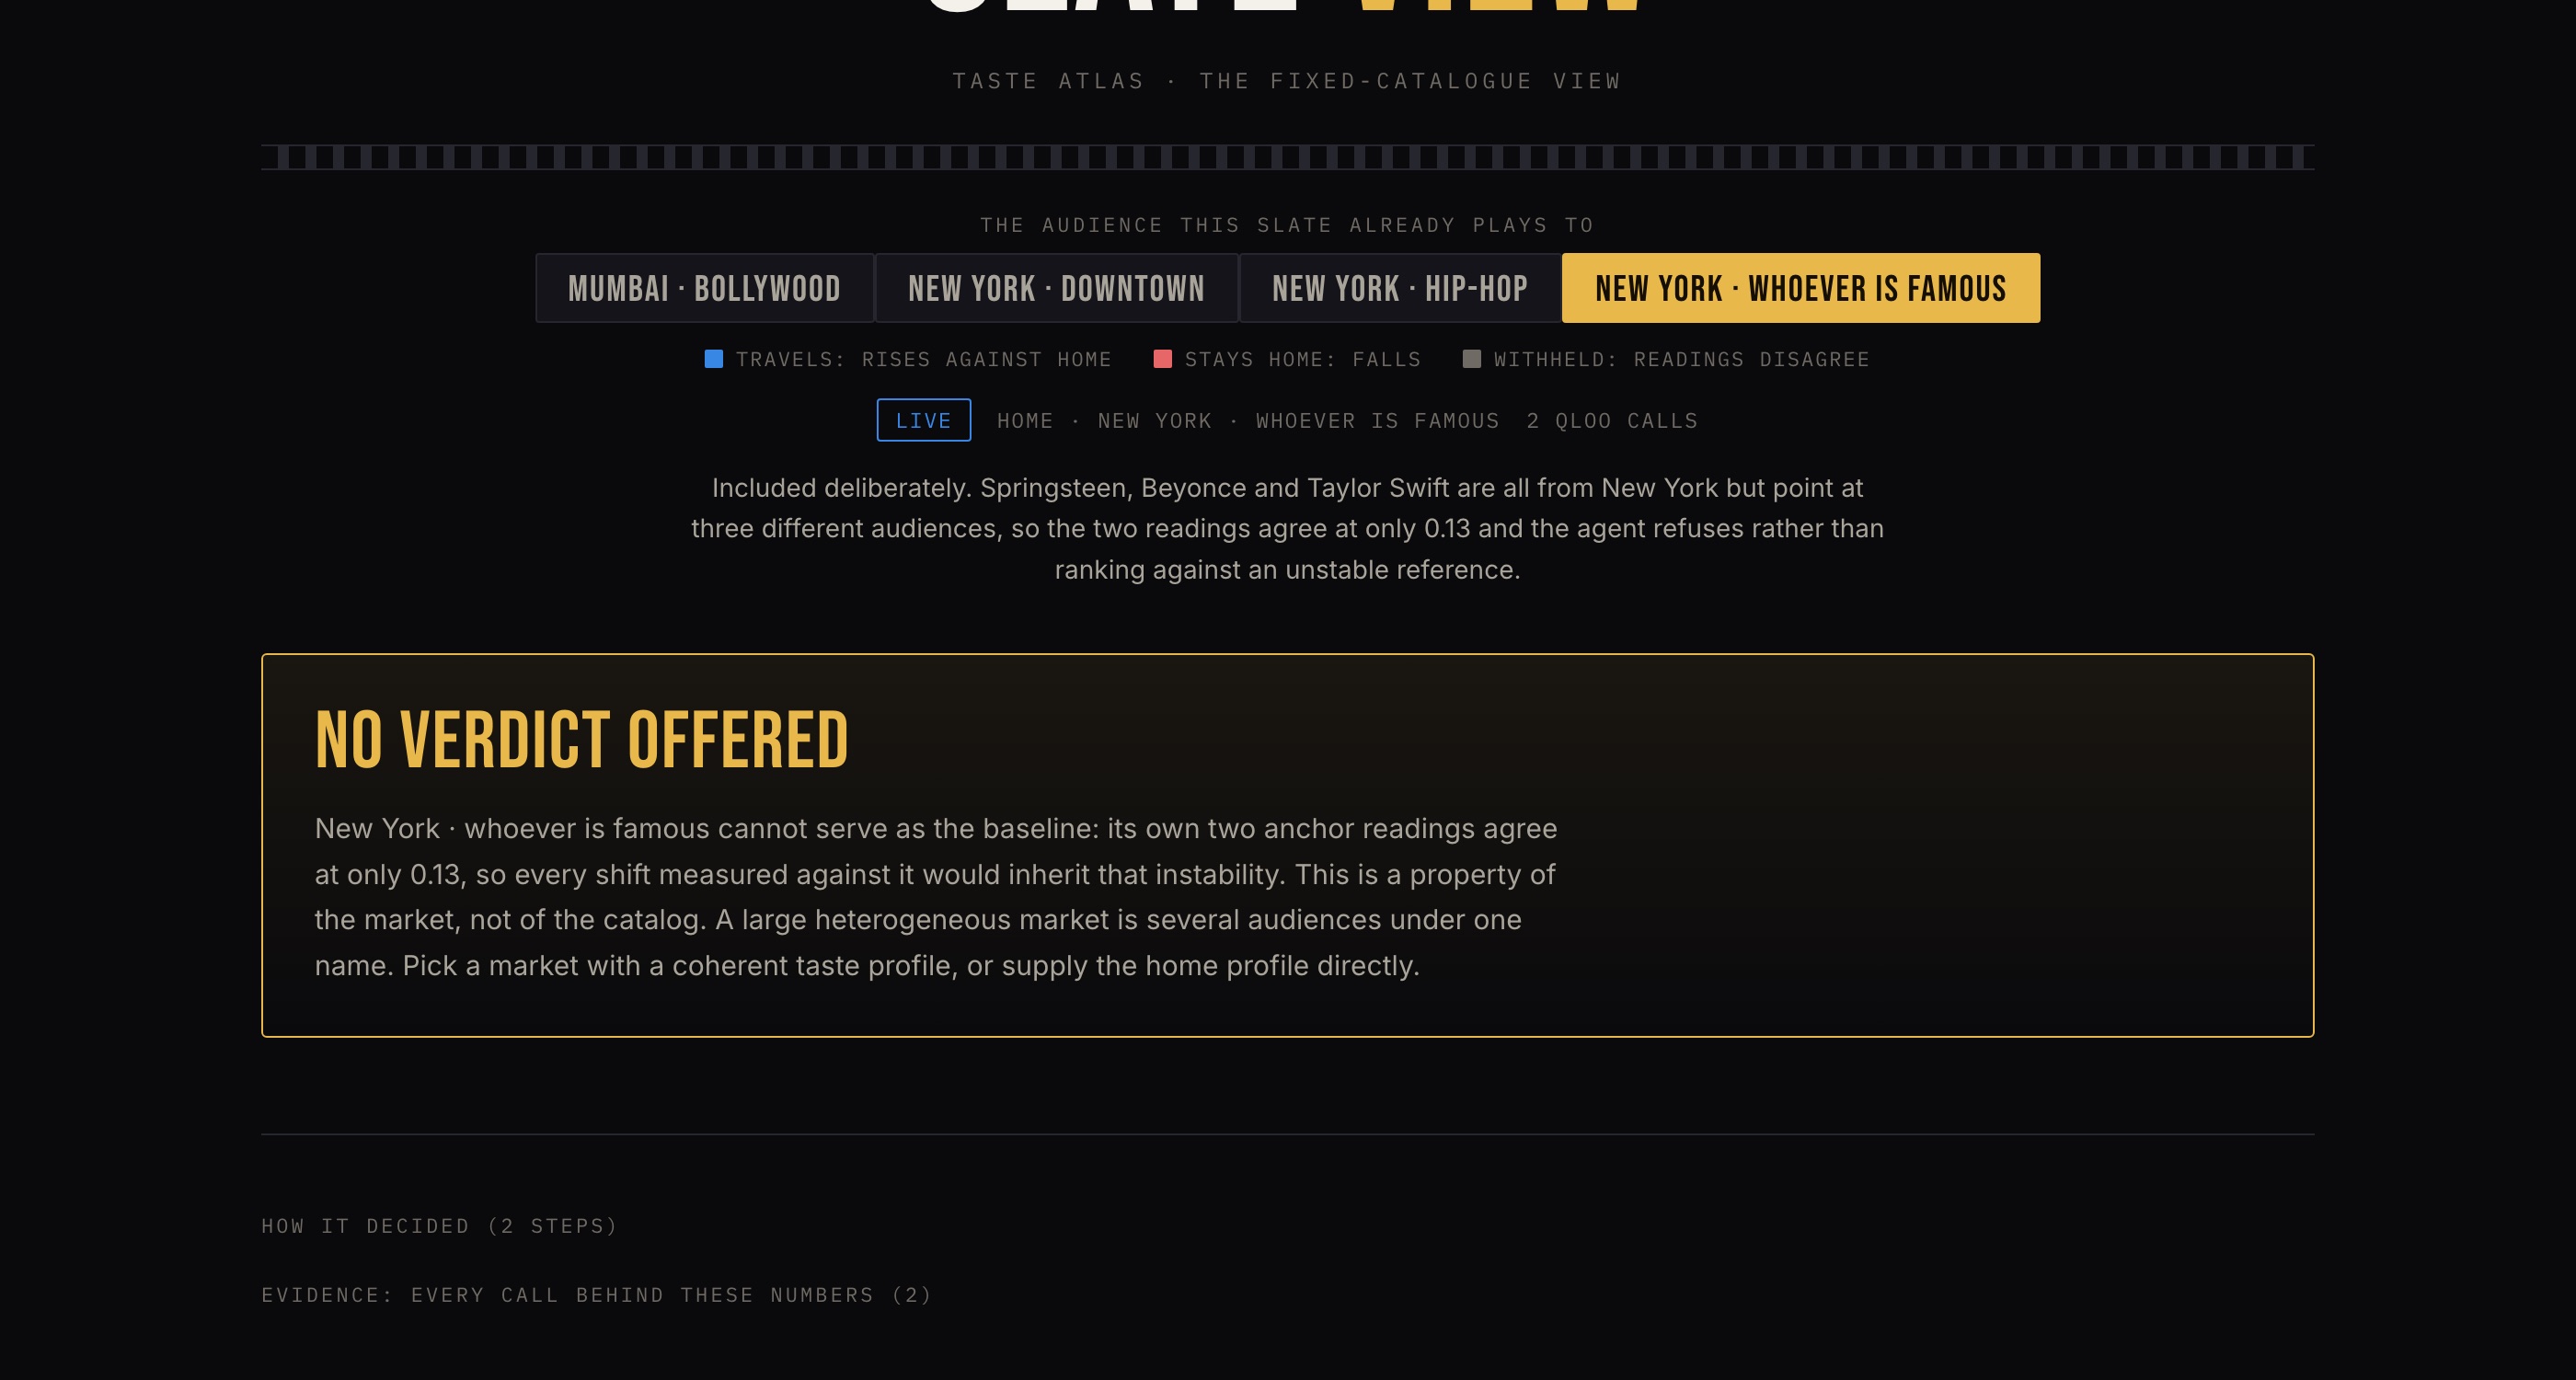
The Slate view. The same engine on fixed catalogues, including one preset that the agent refuses outright.
What makes it an agent rather than a wrapper
It plans which audience to probe next, choosing the one least like home, because a market that behaves like home teaches least about travel. It re-probes with a different anchor set when a reading comes back too flat to mean anything. And it is allowed to say no:
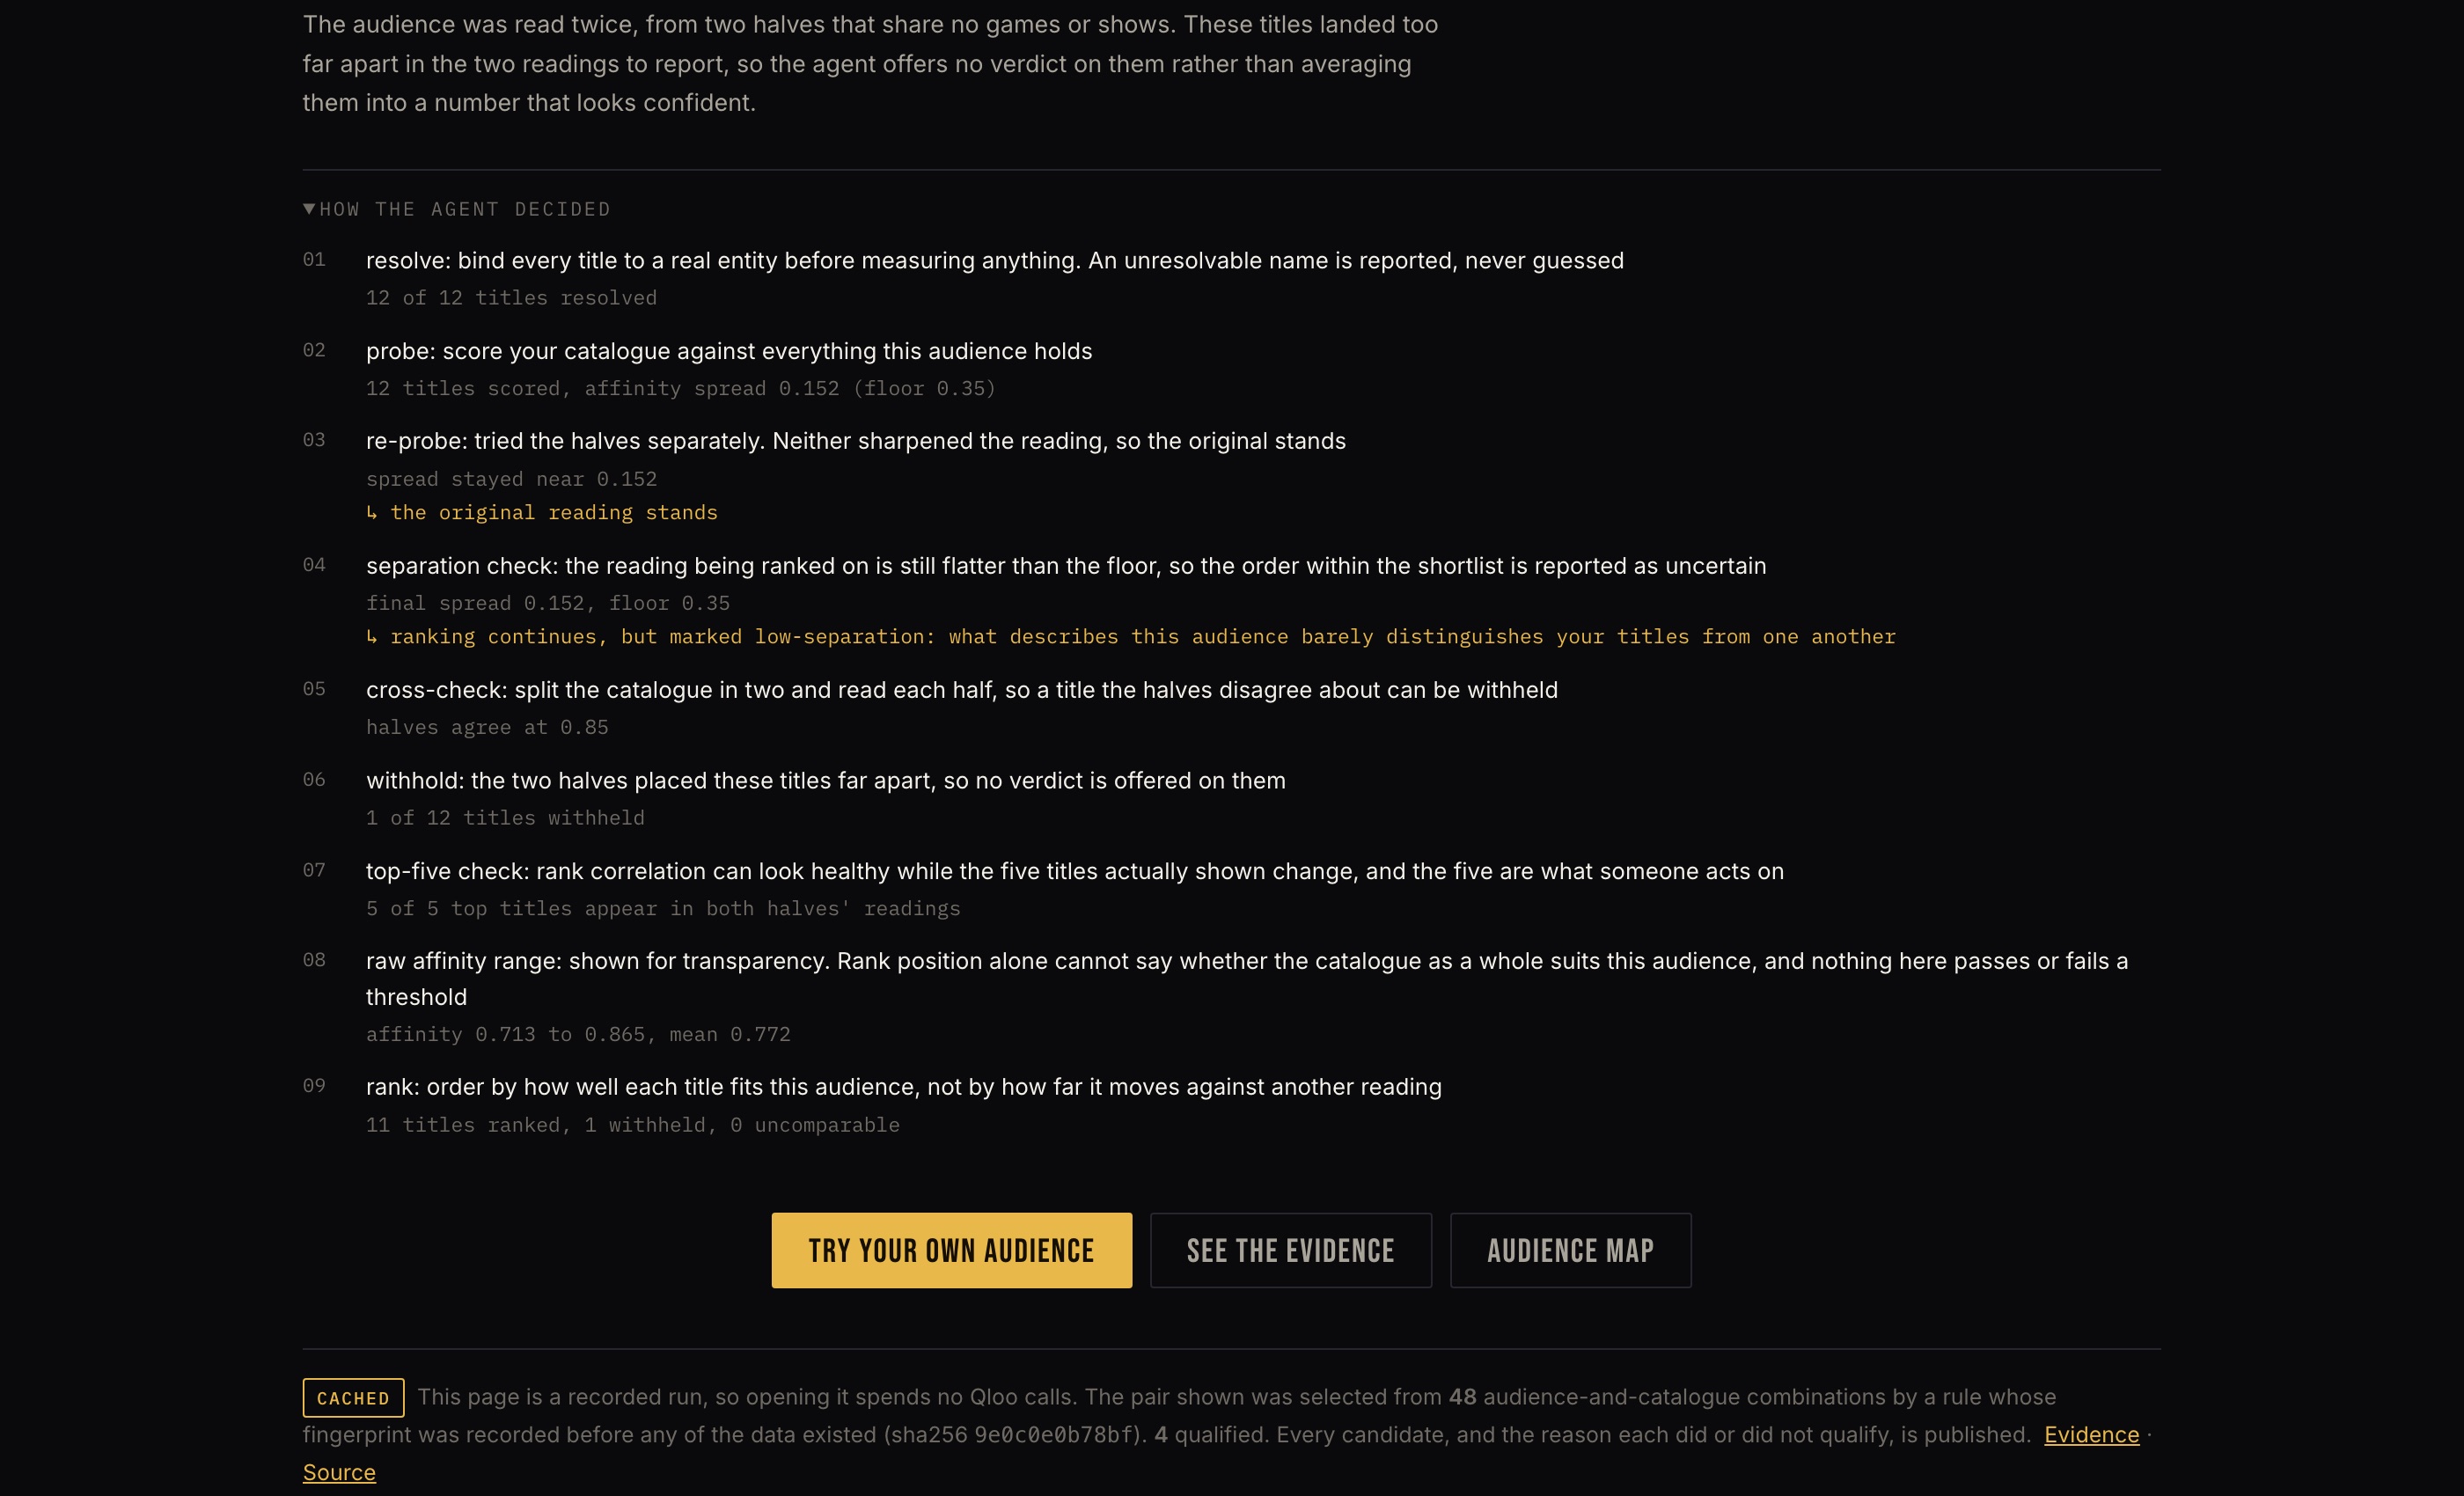
- It reads every audience twice, through two disjoint anchor sets. Where the two readings disagree about a title by more than tolerance, the title is withheld rather than averaged into a confident-looking number.
- Where coverage is too thin, it abstains and names the test that failed.
- Where the home baseline is itself unstable, it aborts. One shipped preset does exactly this: Springsteen, Beyoncé and Taylor Swift are three audiences wearing one city's name, their two readings agree at only 0.13, and the agent refuses to anchor a comparison on them.
Every step records its reason and what it passed over, visible in the "How it decided" tab. No claim renders without the API call that supports it.
Without Qloo there is no product
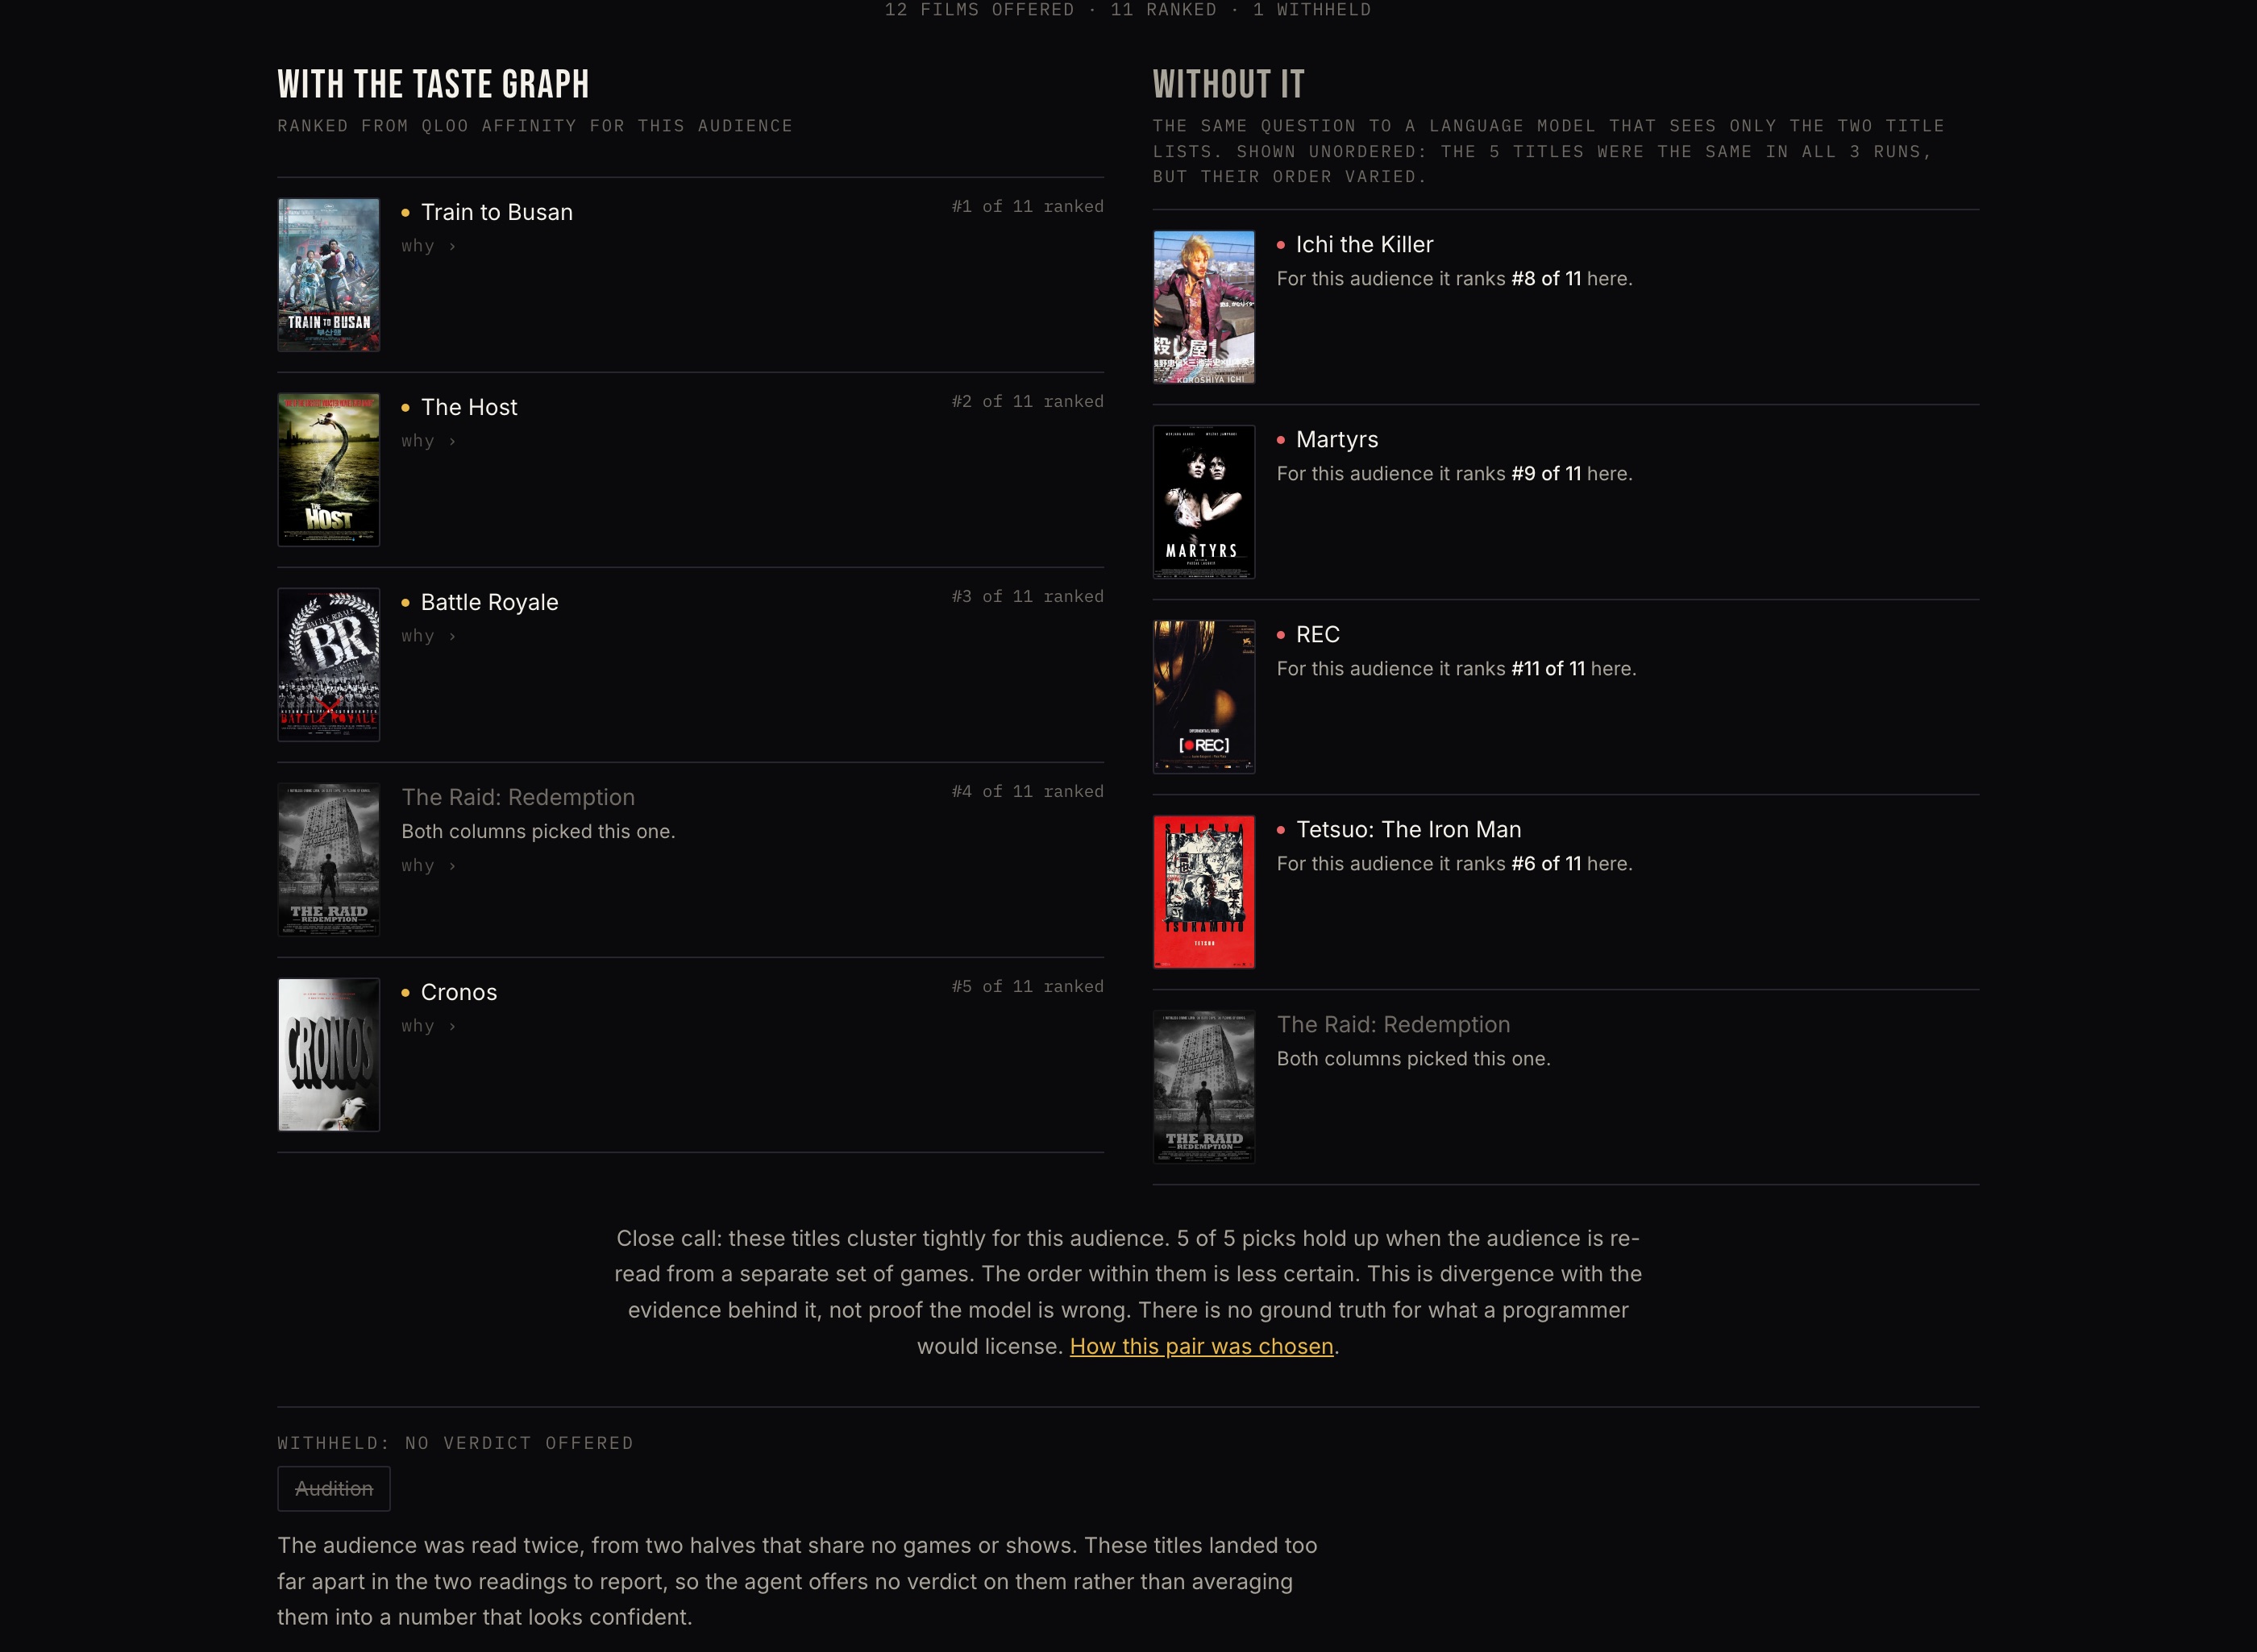
There is a "Without Qloo" tab that runs the identical agent with the taste graph removed, and reports the measured divergence rather than asserting dependence. The honest result: a frontier model is a strong baseline. It shares three to five of the top five, and its set of five is steady across repeats at temperature zero. The order it puts them in is not steady, so we compare sets rather than quoting a place from it.
Offered the chance to decline, it takes it: asked the same question with withholding explicitly available and preferred over a guess, the model withheld 6/7/7 of 12 across three runs, considerably more than this run's one. It also withheld three of the five titles the graph ranks highest here.
Neither of us can be shown right; there is no ground truth. What differs is what the decision rests on. This agent withholds a title when two disjoint readings of the audience place it far apart, a measurement it can show you. The model withholds on its own report of its confidence, with nothing behind it, and adding the option changed which titles it picked.
| Qloo surface | What it does here |
|---|---|
/search |
Resolves every film, anchor and buyer title; unresolvable names are reported, never guessed |
/v2/insights + filter.results.entities |
Scores a pinned slate inside one query, so rank positions are comparable by construction |
/v2/insights + signal.interests.entities |
Carries an audience: anchors for the map, a buyer's own catalogue for the pitch desk |
query.affinity, never popularity |
Ranking uses affinity only, with no fallback to global fame |
Entity tags |
Audiences name themselves (Bollywood, East Coast Hip Hop, Minimal Techno) from tags their members share |
properties.image |
Every poster on every screen comes from Qloo's own CDN |
/v2/tags, /v2/analysis/compare |
Used by the verification harness |
How we built it
Day one was a verification harness, not a feature. Thresholds were pre-registered and committed before any data was collected, with content-only hashing so an amendment is detectable. Every API parameter was differential-tested. That means asserting the response changes when the parameter is removed, because the Qloo API silently ignores invalid parameters, which means an untested parameter is indistinguishable from a working one.
That harness is what found the location result, and four other things worth knowing:
filter.location.queryis silently ignored for movies (identical to four decimals across five cities). It is honoured for places.affinityandpopularitysit side by side in every response. Reading the wrong one makes every audience look identical.- Affinity is not normalised per candidate set. The same entity scored inside two different pinned sets with the same signal returns the same value. It varies with the signal, not the set.
- Cross-domain signal strength varies enormously. TV shows (0.06), video games (0.08) and music (0.11) discriminate film taste sharply; brands (0.39), books (0.70), podcasts (0.72) and places (0.67–0.98) barely or not at all. Anchors are drawn only from the three that work.
takeis capped at 50. A larger value returns a 400 that reads downstream as "no data".
The stack is deliberately plain: stdlib-only Python, zero dependencies, served from a hand-rolled HTTP server on Cloud Run behind a Dockerfile. The statistics (Kendall tau-b, jackknife standard errors, Wilson and Newcombe intervals, bootstrap resampling, average-linkage clustering, classical MDS by power iteration) are all implemented from scratch, which keeps the whole thing auditable in one sitting. 45 commits, 27 tests.
Entity resolution is frozen into a cache, which cut a run from 65 Qloo calls to 10. The map ships every signature with the page, so routing a slate between two audiences costs nothing.
Challenges we ran into
The bug that would have killed the project for an artificial reason. An early version of the client read popularity where it meant affinity. Popularity is identical in every market, so every audience would have looked the same, and we would have concluded the graph had no regional signal and shipped that as a finding. The fix was to make the field read strict, with no fallback between fields: if affinity is absent, return nothing rather than something plausible.
Clustering that validated itself. The first stability check compared the consensus output against itself and reported tau = 1.0 everywhere, including for a market we already knew scored 0.13. And single-linkage clustering chained 21 of 23 anchors into one blob and then reported it as STABLE. Average linkage fixed the chaining; measuring stability per threshold gave the real number, 67%.
Verifiers that were wrong about the world. The external backtest string-matched city names, so "Lisboa" and "Lisbon" scored real restaurants as hallucinations, a 100% failure rate in both arms, which should have been the tell. Replaced with geometric verification. Separately, Wikimedia throttling was being recorded as "no article exists" for 16 of 25 titles; the fix was pacing plus returning (data, error) so a failure is distinguishable from an absence.
Ranking that promoted the wrong film. Sorting the shortlist by movement put Parasite above Sholay for a buyer who ranks Parasite 9th of 12. Movement is interesting; fit is the answer. The shortlist is now ordered by fit, with movement reported beside it.
An ablation that was measuring our own prompt. The LLM baseline appeared unstable and weak, until we noticed the model was ranking the buyer's catalogue back at us on four of five test buyers, because the prompt did not clearly separate the two lists. With labelled lists it became a strong, strong, steady baseline. We had already written the claim that the model was unreliable. We deleted it and shipped the result that made us look worse.
Later the same mistake nearly went out in the other direction: we wrote that the model was perfectly repeatable at temperature zero, on the strength of one prompt. On the hero prompt only 1 of 3 runs returned an identical full ordering. Its set of five was identical every time, which is the claim that survives, so the product now compares sets and never quotes a place from the model's own ordering.
Deploys that reported success while shipping nothing. Credentials expired silently three times, and the deploy script printed success-shaped output regardless. It now runs under a service account and compares the revision ID before and after, failing loudly if nothing changed.
Accomplishments that we're proud of
A measured negative result that reshaped the product. Location being inert is the kind of finding most entries will not look for, because it invalidates the obvious build. We found it on day one and pivoted the whole concept onto it.
The agent can say no, and does. Four titles withheld in the default run. One shipped preset that refuses outright. A tool that always answers is not trustworthy, and most hackathon entries always answer.
Validation that reports where it fails. 11 of 11 regionally-skewed films rank highest with their own home audience (p = 0.0005), and we label that a validity check, not a discovery, since Indian musicians favouring Indian films is what a working system should do. The result with weight is that 10 of 11 survive replacing every anchor artist with a different one (p = 0.0059): the effect belongs to the audience, not to the three names we picked. Cluster membership survives bootstrap resampling for 67% of pairings. An external backtest against Wikipedia pageview ranks, collected before any Qloo call, agrees in Mumbai (tau 0.39) and Berlin (0.20) and not in the other three markets. Reported either way.
An ablation that does not flatter us. We shipped the number that shows a plain LLM gets close, because the interesting claim is not "Qloo wins", it is "Qloo lets the tool know when to shut up".
What we learned
Test the API's parameters before trusting any of them. An API that silently ignores what it does not understand will let you build an entire product on a parameter that never applied. Differential testing, meaning you assert the response changes when you remove the parameter, should be the first thing written, not the last.
A validity check is not a finding. The distinction between "the pipeline carries signal" and "we discovered something" is easy to blur in your own favour, and we had to re-label our headline number once we were honest about which one it was.
The failure modes worth building for are the quiet ones. Every serious bug here produced confident, plausible, wrong output: popularity reading as affinity, clusters validating themselves, throttling reading as absence, deploys reporting success. None of them threw an error.
What's next for The Taste Atlas
Coverage beyond film. The engine is domain-agnostic, and Qloo knows artists, places, books, shows, podcasts and games, but anchor quality varies by domain, and we only measured it for film. The same discovery step should be re-run per domain rather than assumed to transfer.
More cross-checked clusters. Fifteen of the eighteen audiences are too small to split into halves that can disagree, so they ship labelled single reading. More anchors per cluster converts those into checked ones.
Buyer profiles from a real catalogue feed. Today a buyer is described by typing titles. Acquisitions teams already keep this list; reading it directly turns a demo into something used on a Tuesday.
Longitudinal re-measurement. Every number here is a snapshot of the graph in October 2026. The honest version of this tool re-runs its own validation on a schedule and shows when a conclusion stops holding.
Built With
- clustering
- css
- docker
- google-cloud-run
- google-gemini
- html
- javascript
- multidimensional-scaling
- python
- qloo
- qloo-api
- rest-api
- statistics
- svg

Log in or sign up for Devpost to join the conversation.