Inspiration
I'm a Georgia Tech student and I ride MARTA. The app says a bus is coming at 9:14. Sometimes it is. Sometimes it's 30 minutes late. And sometimes it's a ghost bus( on the schedule, but it never left the depot). You find out by standing at the stop until you give up and pay $18 for an Uber.
The data to catch this exists, MARTA publishes a live GTFS-Realtime feed of every vehicle. But nobody keeps score. Google Maps predicts your next bus; no one tells you whether that route keeps its promises. During the hackathon I pointed a poller at MARTA's own feed and found that ~49% of scheduled trips that day never appeared on GPS. That number is why this project exists.
What it does
Transit Ledger ATL is an independent accountability layer for Atlanta transit:
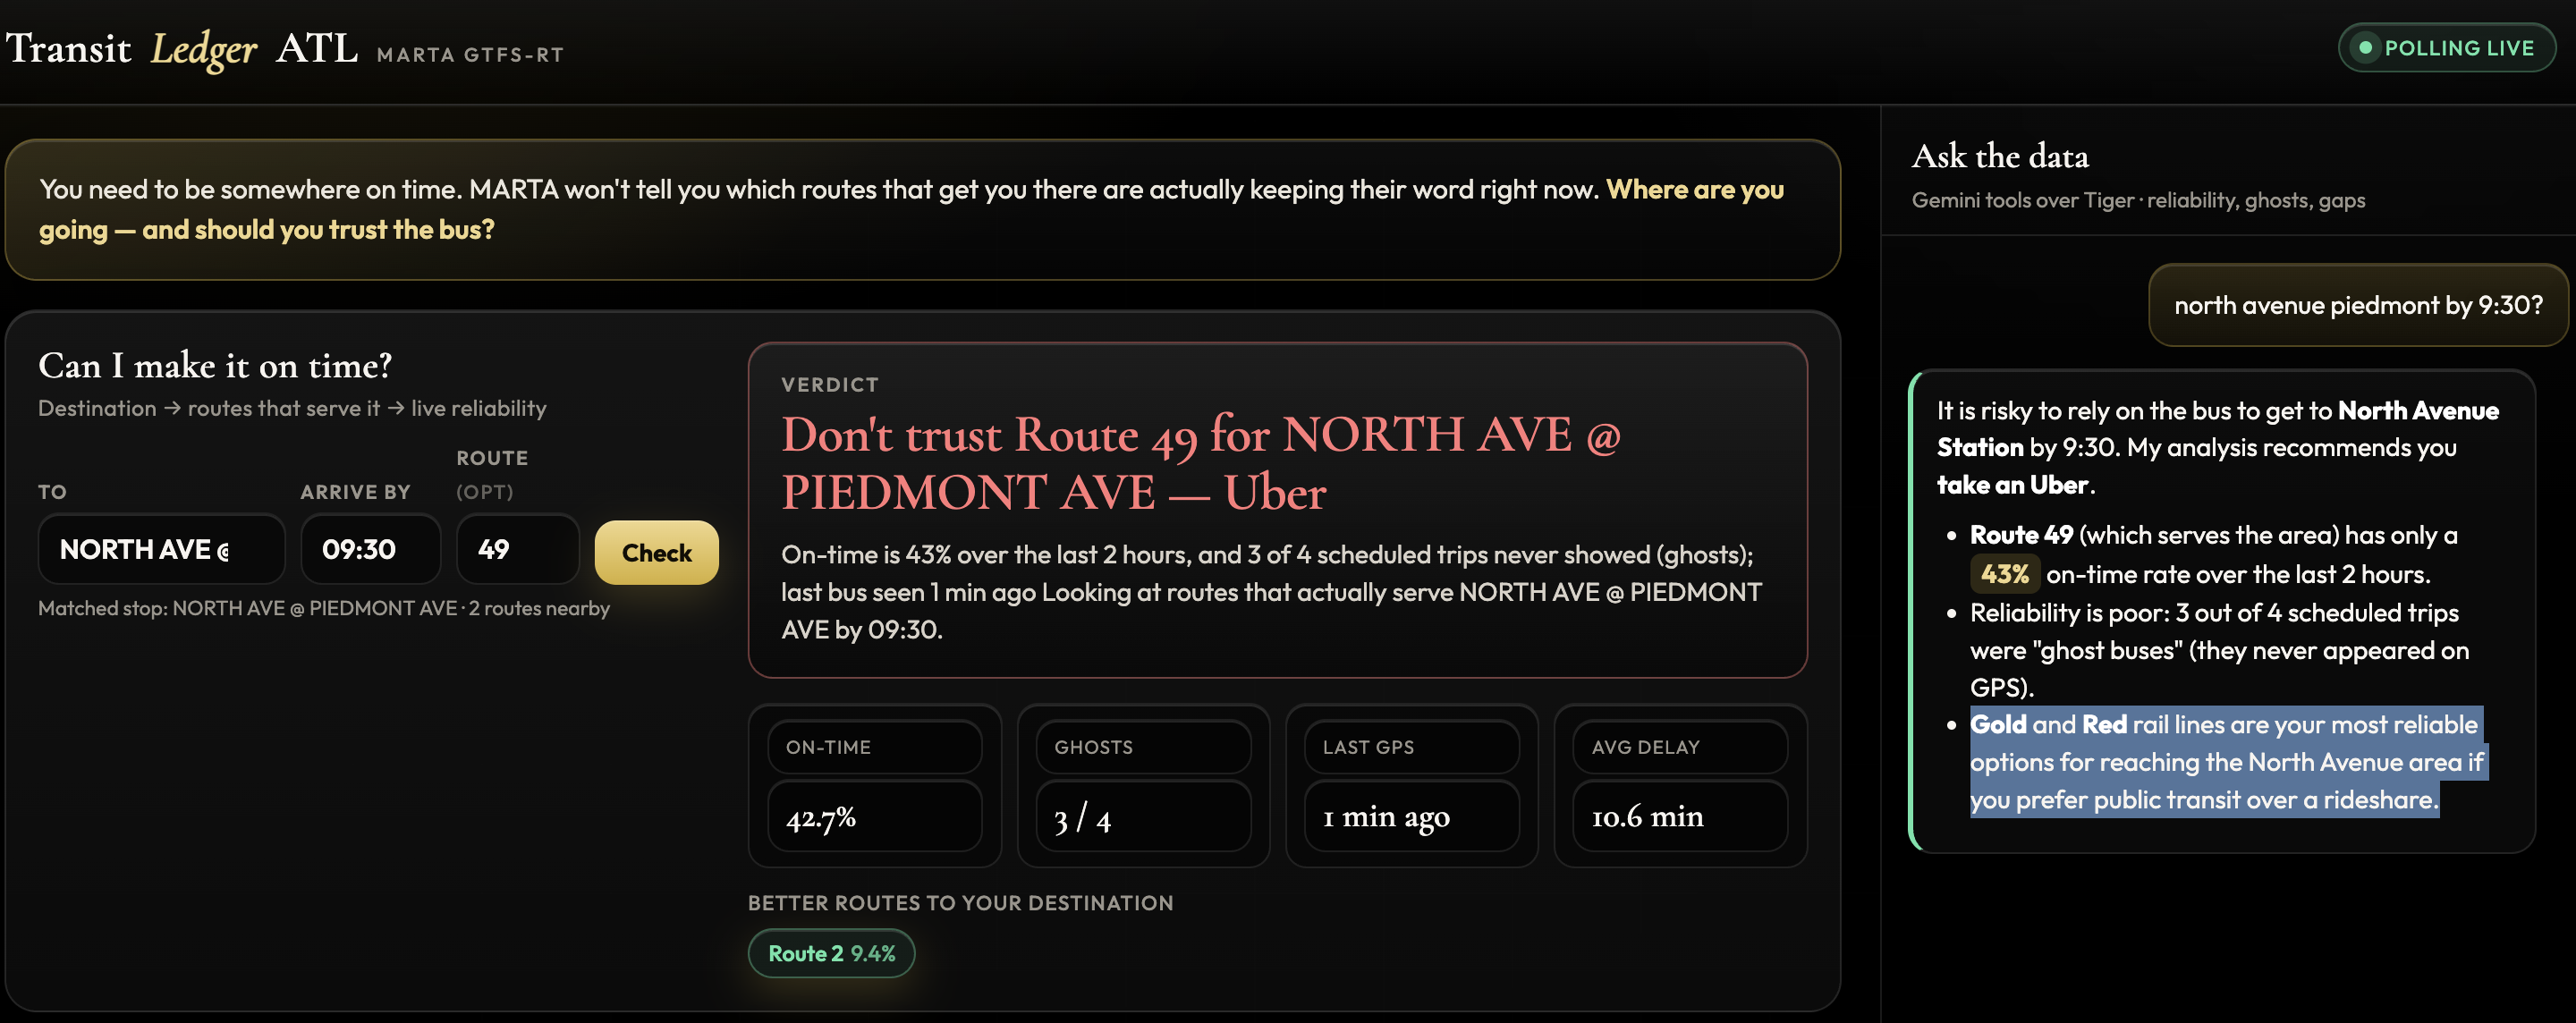
- Bus or Uber? Type where you're going ("Georgia Tech, arrive by 9:30") — it finds every route serving that destination and returns a verdict backed by a live track record: on-time %, ghost no-shows, minutes since last GPS ping, and better alternatives.
- Ghost-bus detection — joins live GPS against today's static timetable to catch trips that should be in service but never showed.
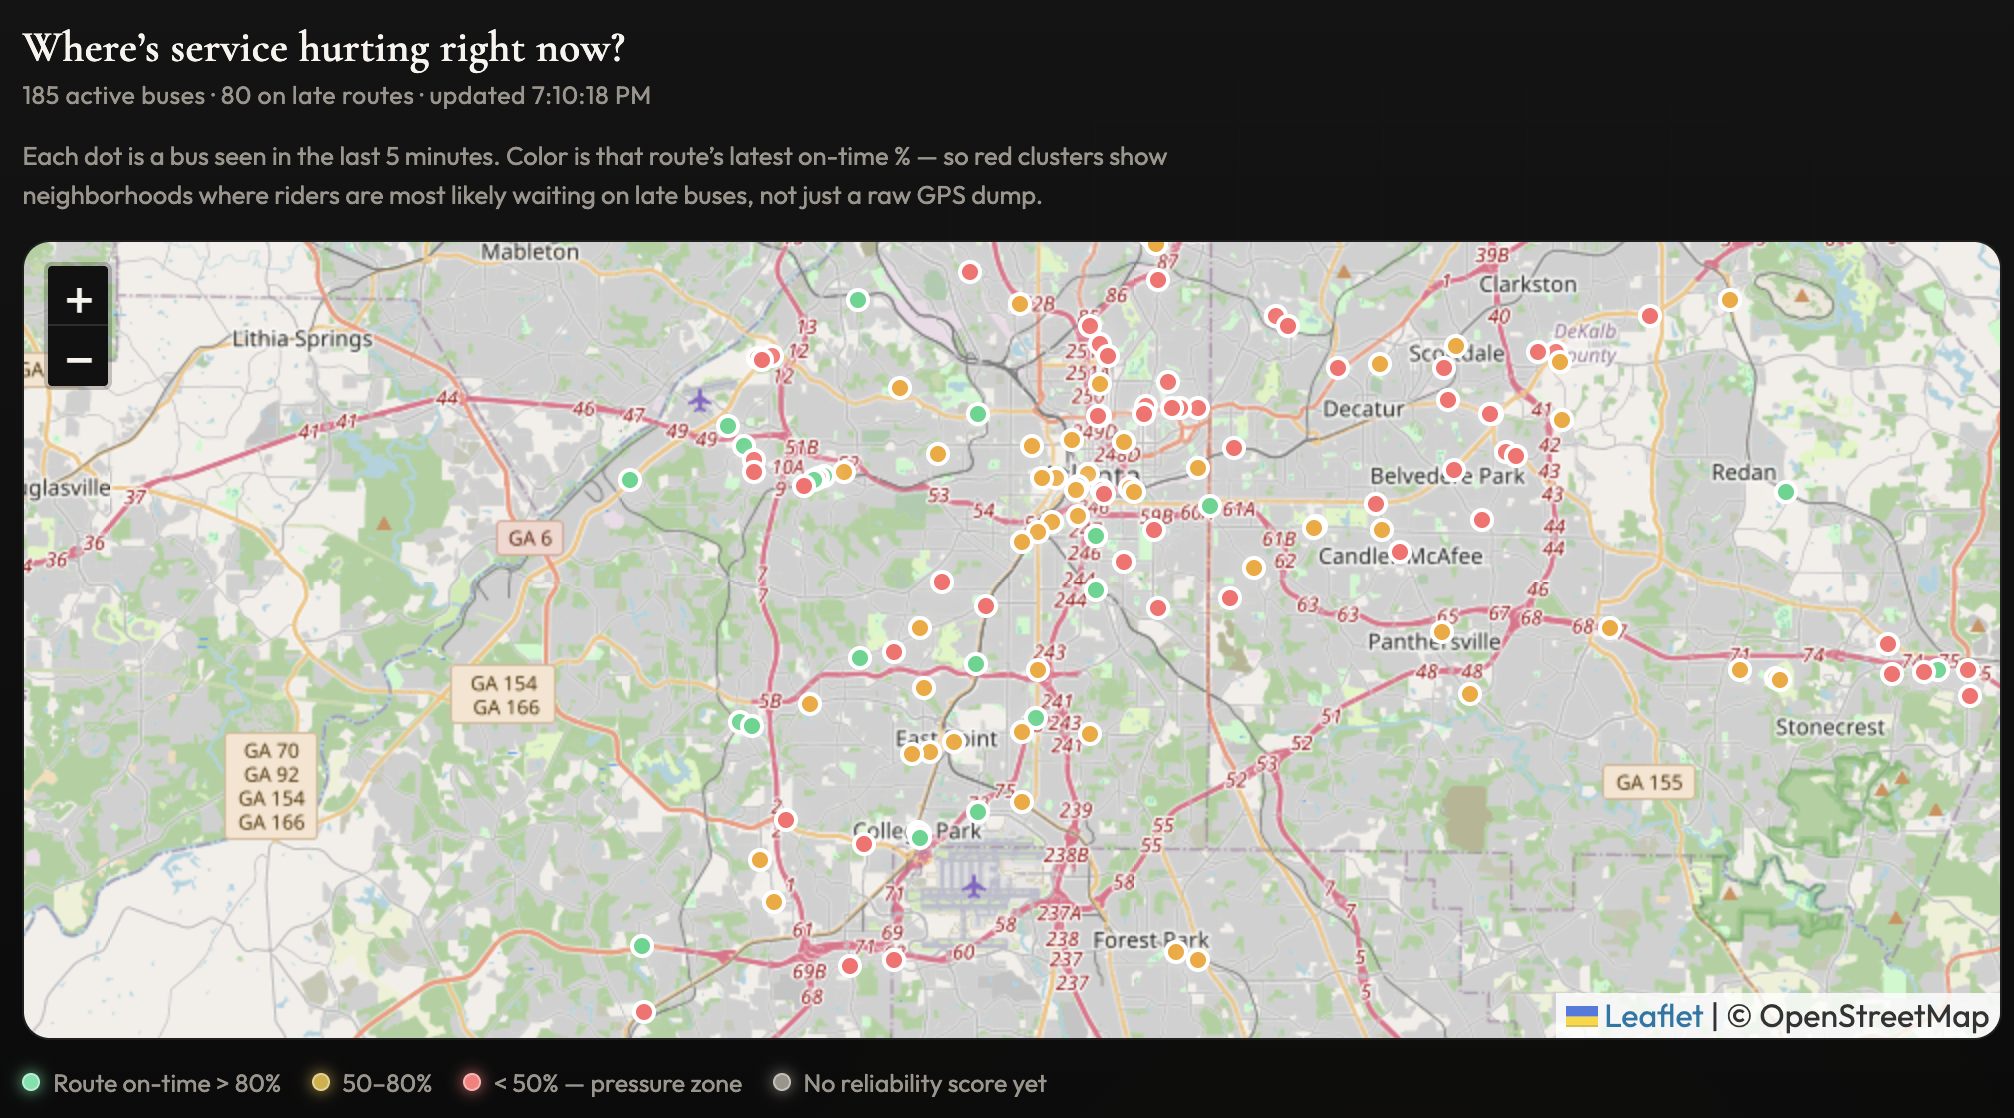
- Live pressure map — every active bus, colored by its route's reliability. Red clusters show which neighborhoods are being failed, not just which routes.
- Ask the data — a Gemini chat with function-calling tools wired into the live database.
- Campus briefing — a durable Render Workflow that pulls the day's stats and has Gemini write a rider-facing morning briefing.
How I built it
- Ingest — A Render Cron Job polls MARTA's GTFS-Realtime feed (protobuf) every minute. MARTA only sends absolute predicted times, not delays, so the poller diffs each prediction against the static GTFS timetable to compute every delay itself.
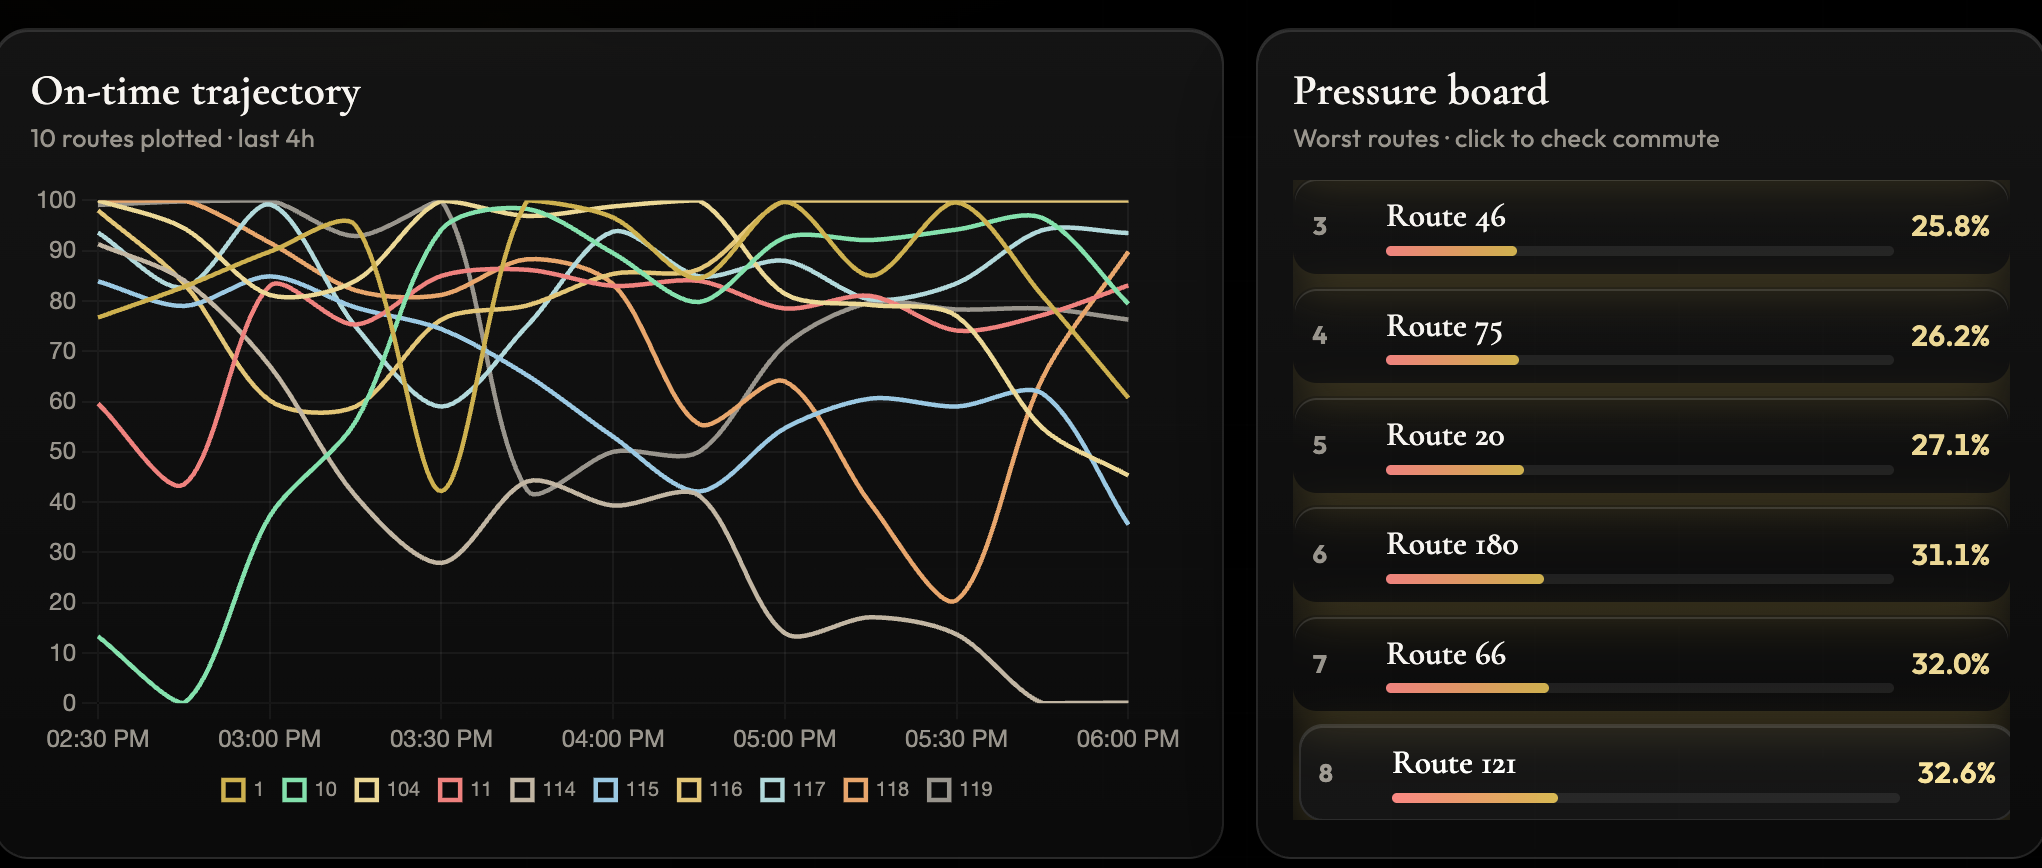
- Store — Everything lands in Tiger Data (TimescaleDB): two hypertables ingesting ~2,900 vehicle positions and ~226,000 delay samples every 10 minutes. A continuous aggregate (route_reliability_15m) keeps every route's on-time % precomputed, so every verdict and chart is a lag-free index scan — no GROUP BY at request time. Columnar compression kicks in after 2 hours to keep it on a tiny instance. On-time is defined as |delay| ≤ 5 minutes vs. the static schedule.
- Reason — A Render Workflows service (@renderinc/sdk) runs a durable task graph — campusBriefing fans into gatherStats (query Tiger) → writeBriefing (Gemini) → storeBriefing (back into Tiger) — with per-task retry and backoff.
- Serve — A Render Web Service (Express + vanilla JS) does the rider-facing work: the bus-vs-Uber verdict engine, the Gemini function-calling chat with five tools over live SQL (reliability, ghosts, headway gaps, worst routes, commute verdict), a live Leaflet map colored by route reliability, and the workflow-written campus briefing. The web + cron services deploy from a render.yaml Blueprint. Challenges I ran into
- MARTA's feed doesn't include delays. It sends absolute predicted times only — so I had to parse the full static GTFS (a ~55MB stop_times.txt), build a schedule index, and compute every delay myself by diffing predictions against the timetable.
- "Georgia Tech" doesn't exist. GTFS stop names are street intersections ("NORTH AVE NW @ FOWLER ST"), so searching the campus name matched Georgia Piedmont Tech on the other side of town. Fixed with a landmark→coordinates alias layer and haversine nearest-stop resolution.
- Gemini free-tier limits — I burned through the daily quota of one model mid-hackathon and had to swap models and make the model configurable. The workflow's retry/backoff isn't decoration; it's load-bearing.
- Blueprints don't support Workflows yet, and Gemini 3.x requires echoing thought_signature parts back in multi-turn tool loops — both cost me time in docs.
What I learned
Continuous aggregates genuinely change the architecture — I never wrote a GROUP BY at request time. Durable, retried task graphs are the right shape for anything touching a flaky external API. And the most damning insight came from ~40 lines of SQL: the hard part of civic tech isn't the model, it's getting the data into a shape where the truth is one query away.
What's next
Stop-level (not route-level) scoring, a weekly "MARTA report card" published automatically by the workflow, and alerts for routes whose ghost rate spikes — because riders deserve receipts.Sometimes it is. Sometimes it's 30 minutes late. And sometimes it's a ghost bus — on the schedule, but it never left the depot. You find out by standing at the stop until you give up and pay $18 for an Uber.
The data to catch this exists — MARTA publishes a live GTFS-Realtime feed of every vehicle. But nobody keeps score. Google Maps predicts your next bus; no one tells you whether that route keeps its promises. During the hackathon I pointed a poller at MARTA's own feed and found that ~49% of scheduled trips that day never appeared on GPS. That number is why this project exists.
What it does
Transit Ledger ATL is an independent accountability layer for Atlanta transit:
Built With
- chart.js
- claude
- cursor
- gemini
- gtfs-realtime
- protobuf
- render
- render-workflow
- tiger-data
- timescaledb
- typescript


Log in or sign up for Devpost to join the conversation.