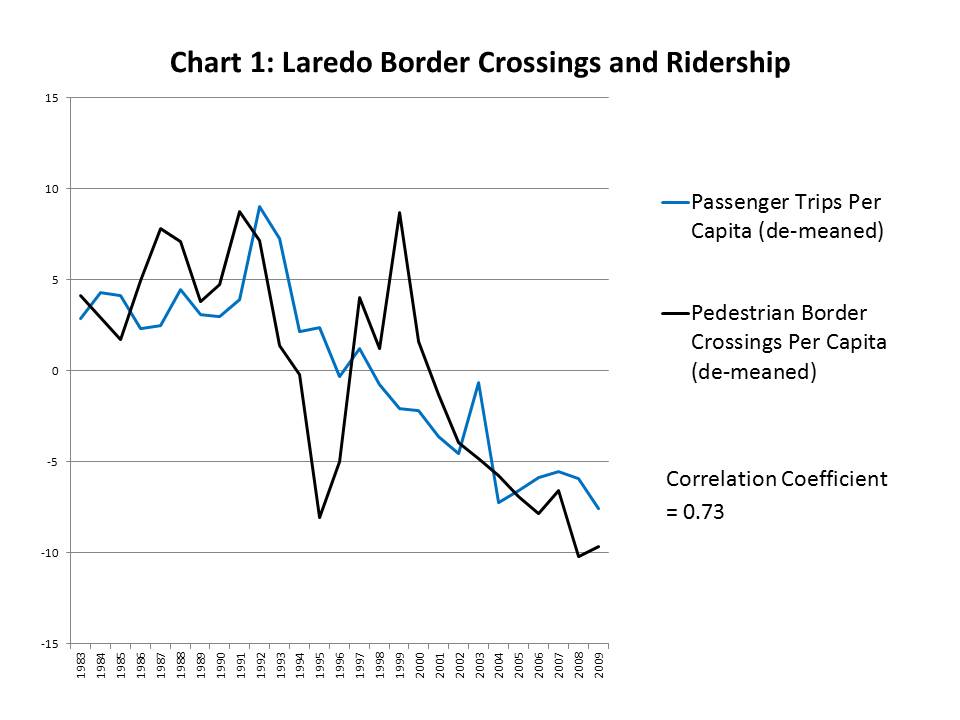
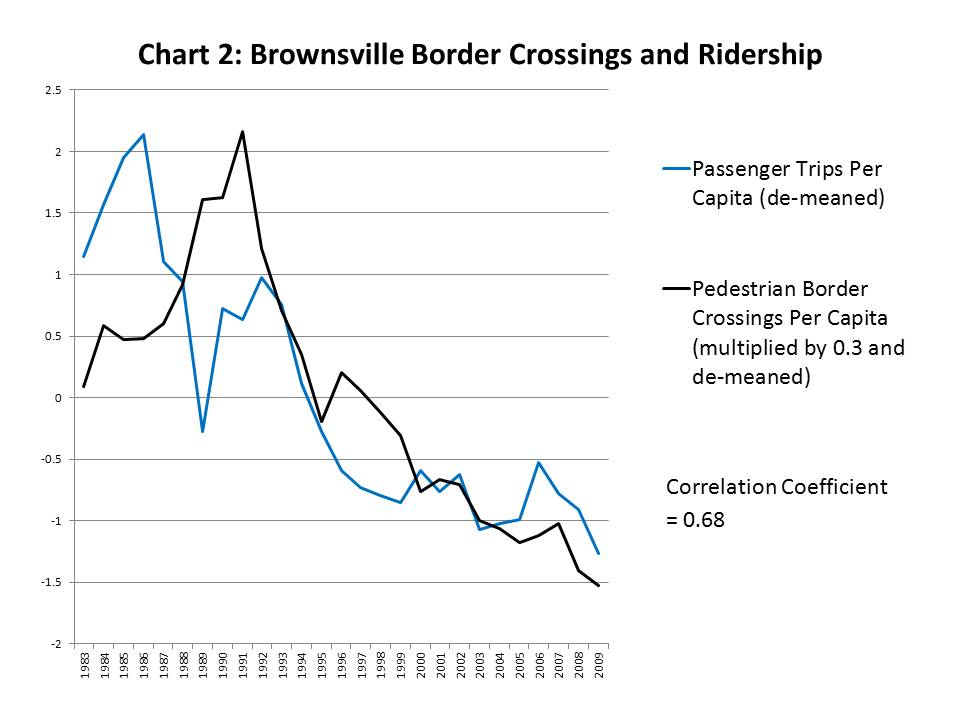
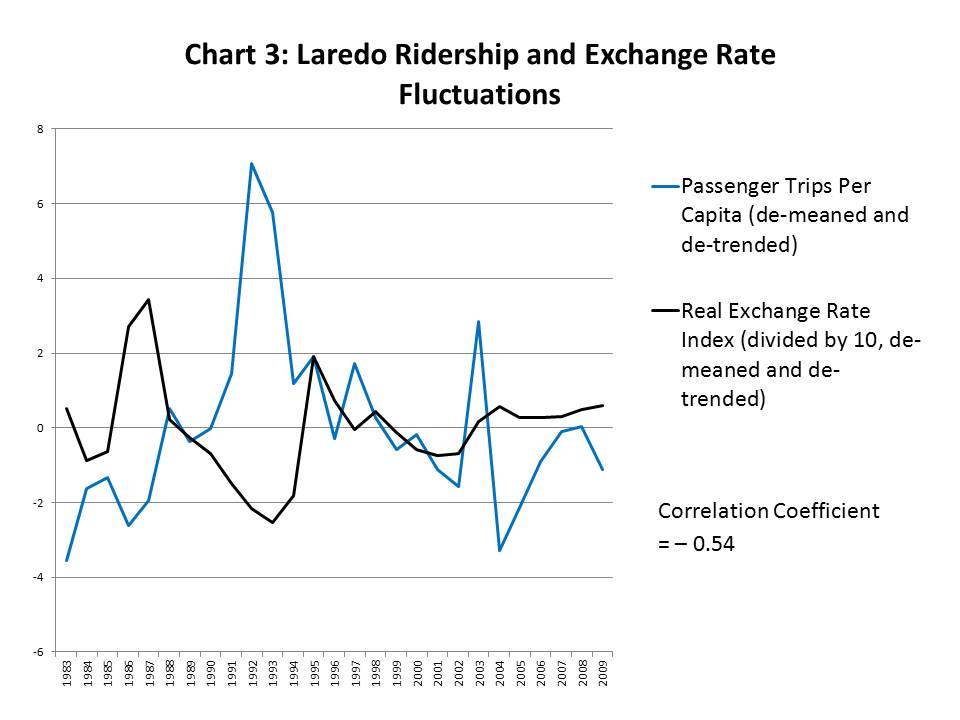
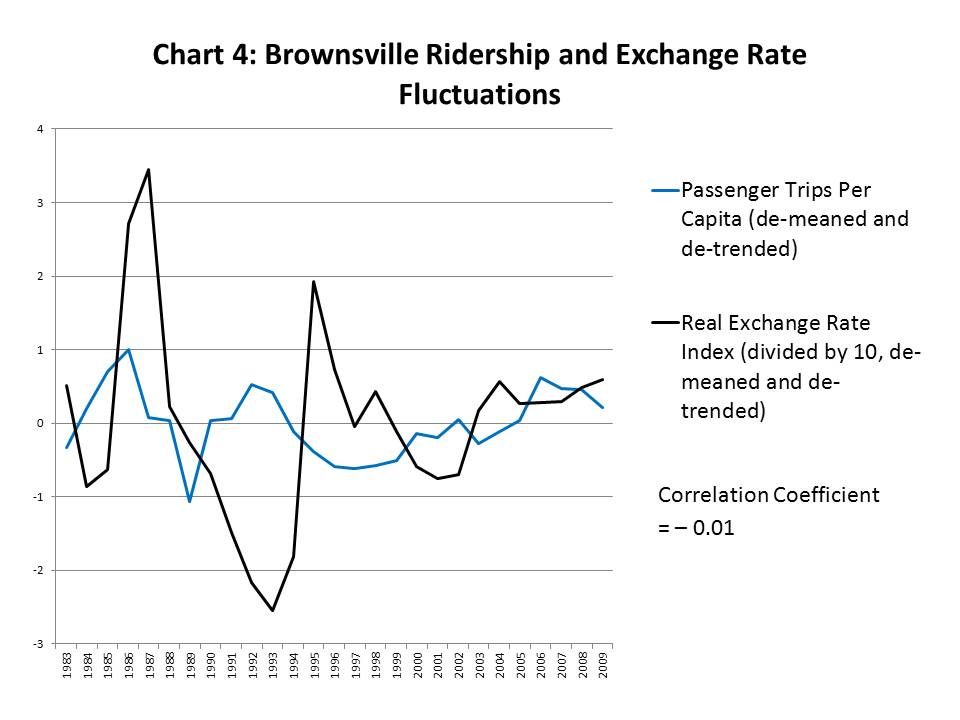
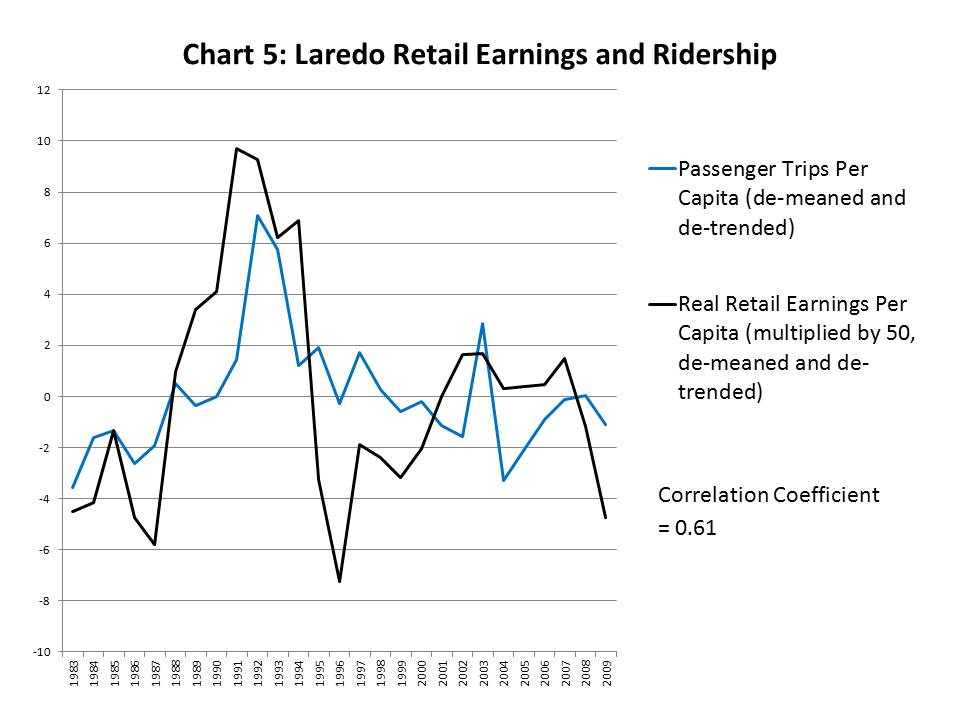
In 2009, 6.6 million pedestrians crossed the border from Mexico into Laredo and Brownsville, Texas. It is likely that many of these border crossings were for the purpose of shopping (Charney & Pavlakovich-Kochi, 2002; Ghaddar & Brown, 2005). In fact, shopping by Mexican visitors is a major contributor to the economies of Texas border cities (Patrick & Renforth, 1996; Coronado & Phillips, 2007). Mexican nationals who walk through the ports of entry have access to the central business districts of both cities, but may be unable to reach more remote shopping centers by foot. Improved bus terminals and other public transportation infrastructure near the ports of entry can provide pedestrian border crossers with access to shopping centers, thus increasing retail exports and furthering regional economic development. To illustrate the role of public transportation in linking cross-border shoppers with retailers, six charts were developed using data from the National Transit Database and other sources. They show the relationship that exists in Laredo and Brownsville between transit ridership and pedestrian border crossings (charts one and two), exchange rate fluctuations (charts three and four), and retail earnings (charts five and six). The data presented in the charts have been de-meaned and, in some cases, re-scaled so that they can be compared on the same chart. Also, the variables in the last four charts have been de-trended to allow examination of the short-term interactions between them. The following also refers to transit demand regression equations estimated for Brownsville and Laredo. The strong positive correlation coefficients in the first two charts indicate that pedestrian border crossings and transit ridership move in tandem. The regression results indicate that an additional one thousand pedestrian border crossings result in an extra 269 public transportation trips in Brownsville and 173 in Laredo. But these estimates do not tell us whether those using transit for cross-border visits are U.S. or Mexican citizens. Nor do we know whether they cross the border for work, shopping, or some other activity. While the dataset does not allow us to eliminate these uncertainties, we can gain some insight by examining the response of ridership to fluctuations in the real exchange rate index. An increase in the value of the Mexican peso relative to the U.S. dollar is expressed as a decrease in the real exchange rate index. The third chart and the estimated demand equation show a strong negative relationship between the real exchange rate index and transit ridership in Laredo (though there seems to be less correlation in the case of Brownsville). This negative relationship indicates that transit patronage increases when the peso is strong relative to the dollar. The most likely explanation for this phenomenon is that Mexican nationals respond to a decrease in the exchange rate by making more shopping excursions across the border and, therefore, increase their utilization of Laredo’s transit system. This negative relationship is not consistent with the hypothesis that U.S. nationals use transit to cross the border and shop in Mexico. The fifth and sixth charts show a strong positive relationship between de-trended real retail earnings and transit ridership. This indicates that short-term cycles in the retail sector coincide with cycles of transit patronage. Unfortunately, it is not possible from the chart alone to determine if a causal relationship exists. However, it is interesting to note that a positive correlation would be expected if pedestrian border crossers increase retail activity, as previous studies have indicated, and if they utilize transit for shopping, as charts one through four suggest. Investments in public transportation infrastructure that aim to increase the mobility of pedestrian cross-border shoppers may have a positive impact on the retail sector in Brownsville and Laredo and, indirectly, on the regional economy.
Transit in a Border Zone
Updates

Leave feedback in the comments!
Log in or sign up for Devpost to join the conversation.