-
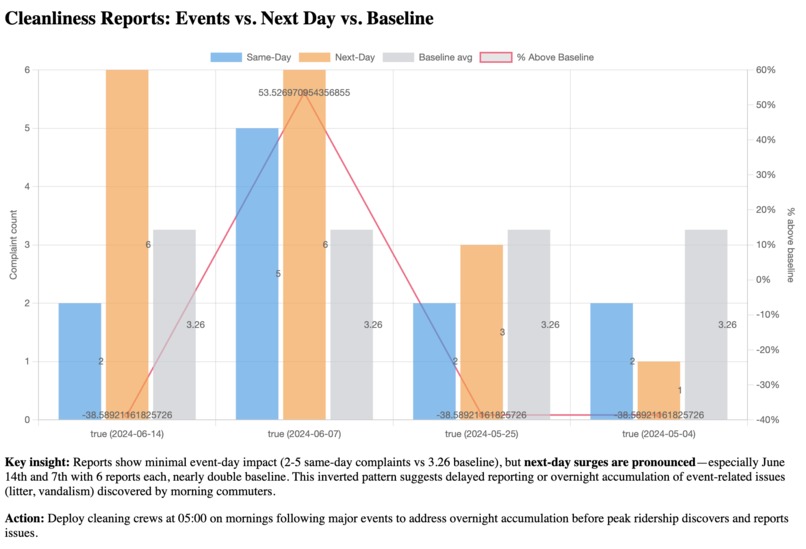
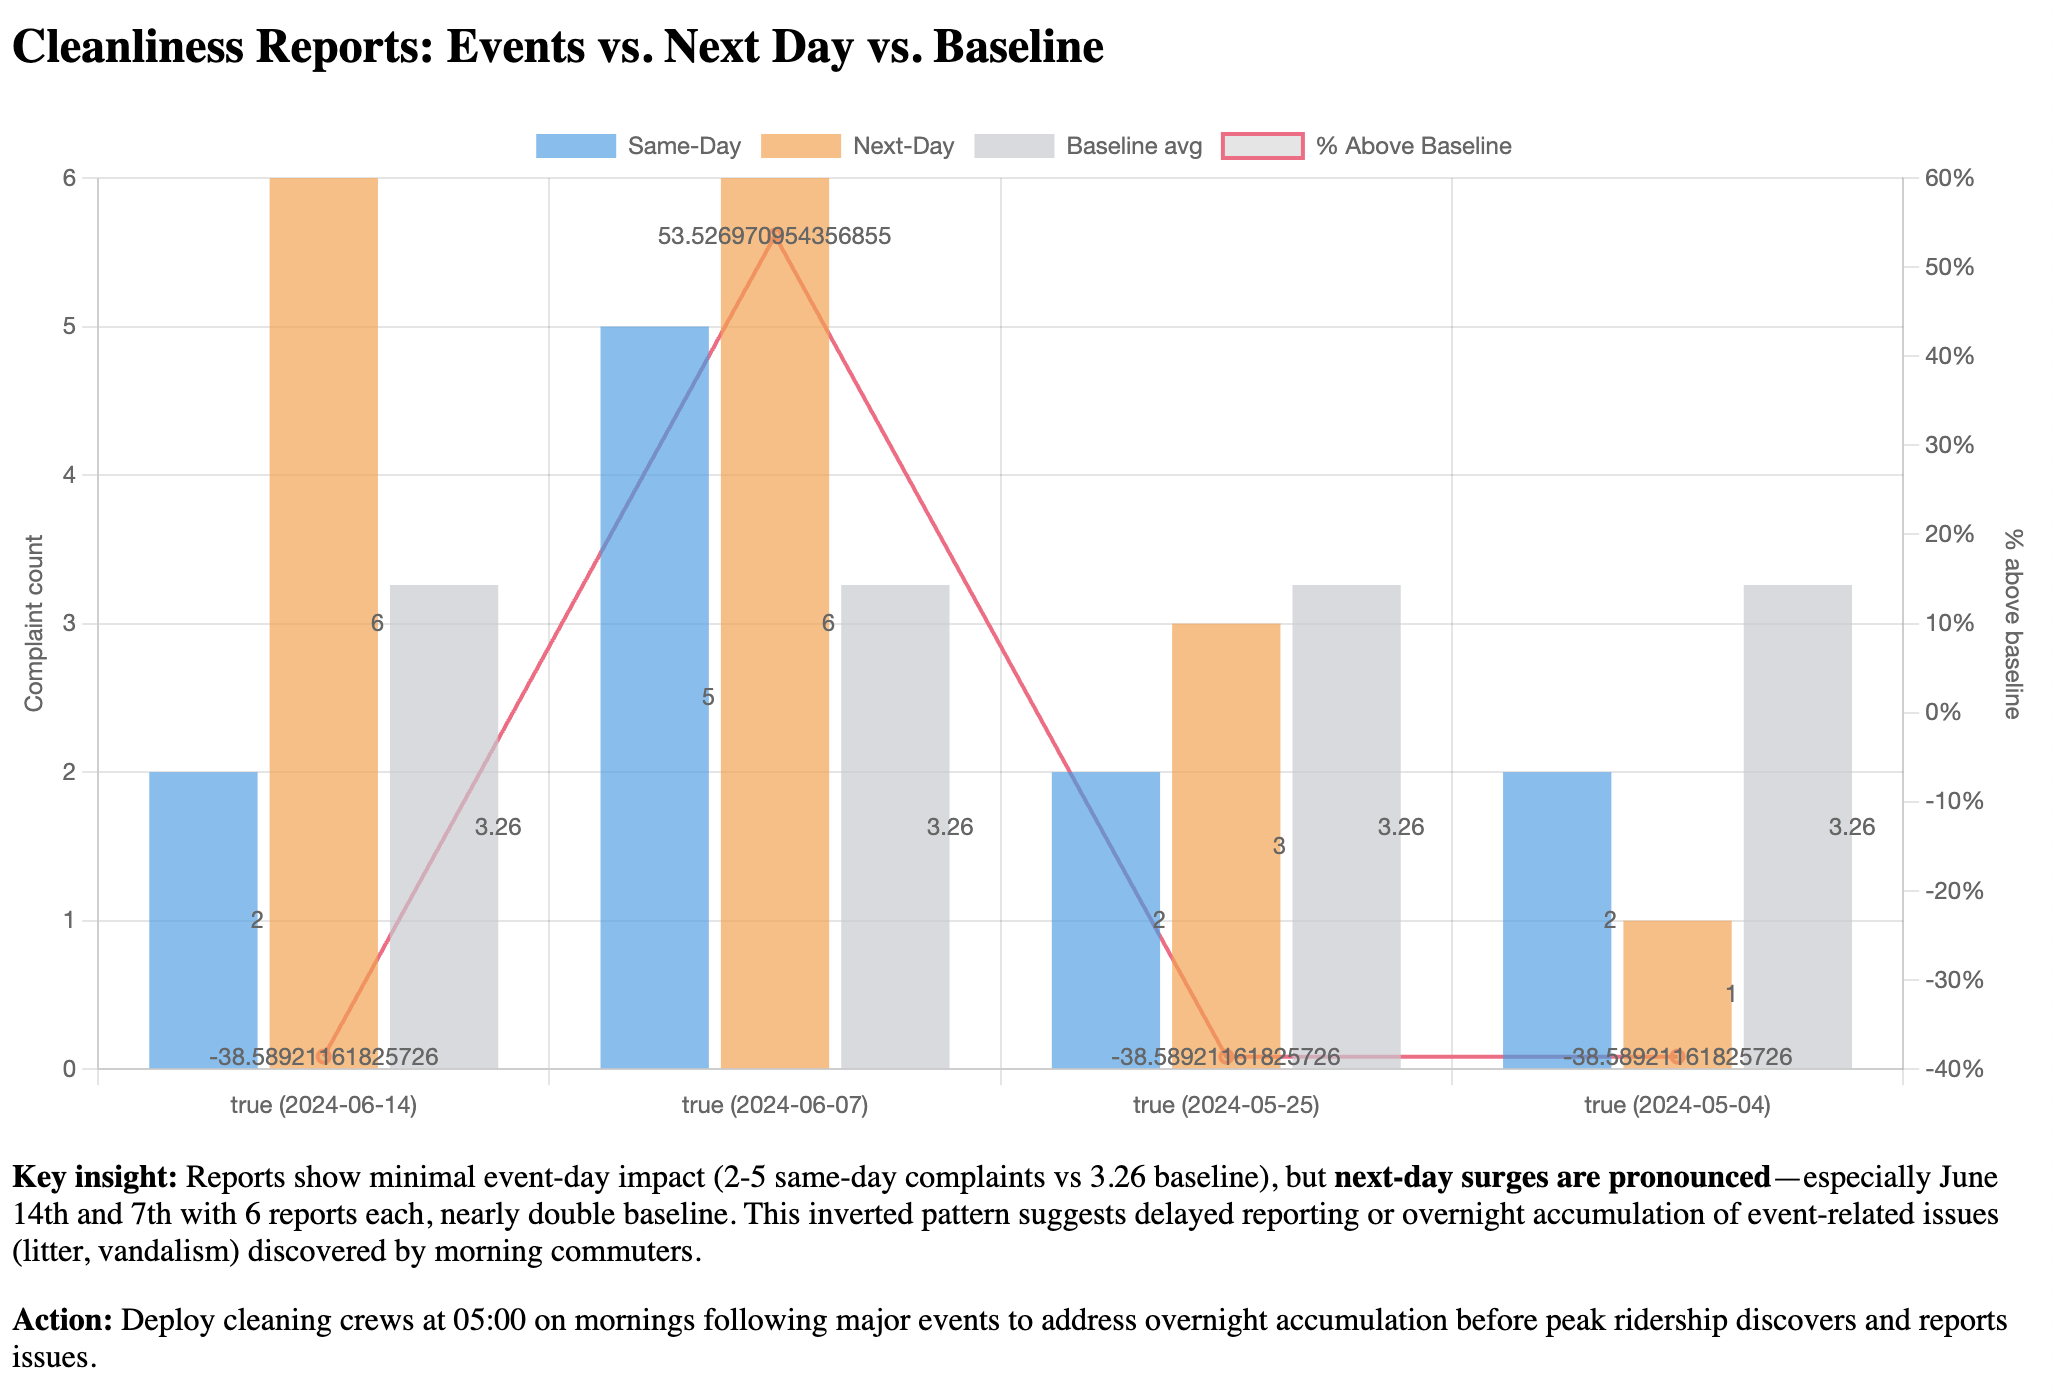
Links cleanliness complaints with previous night city events
-
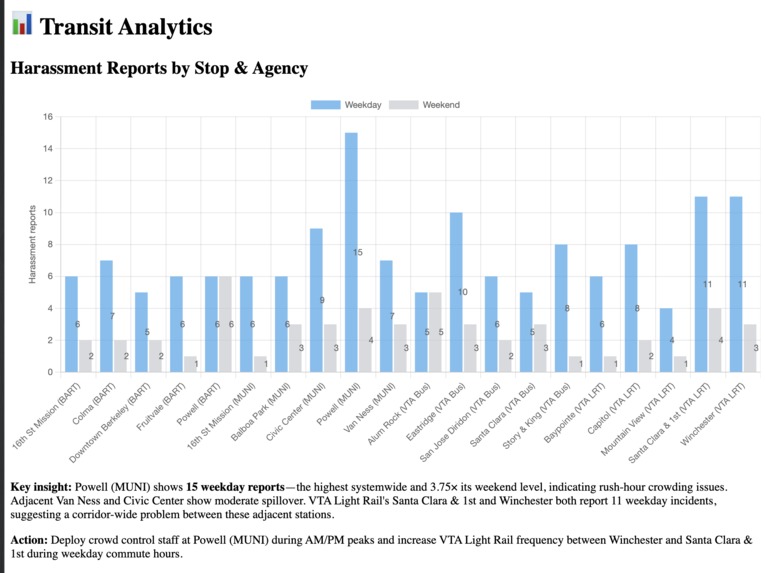
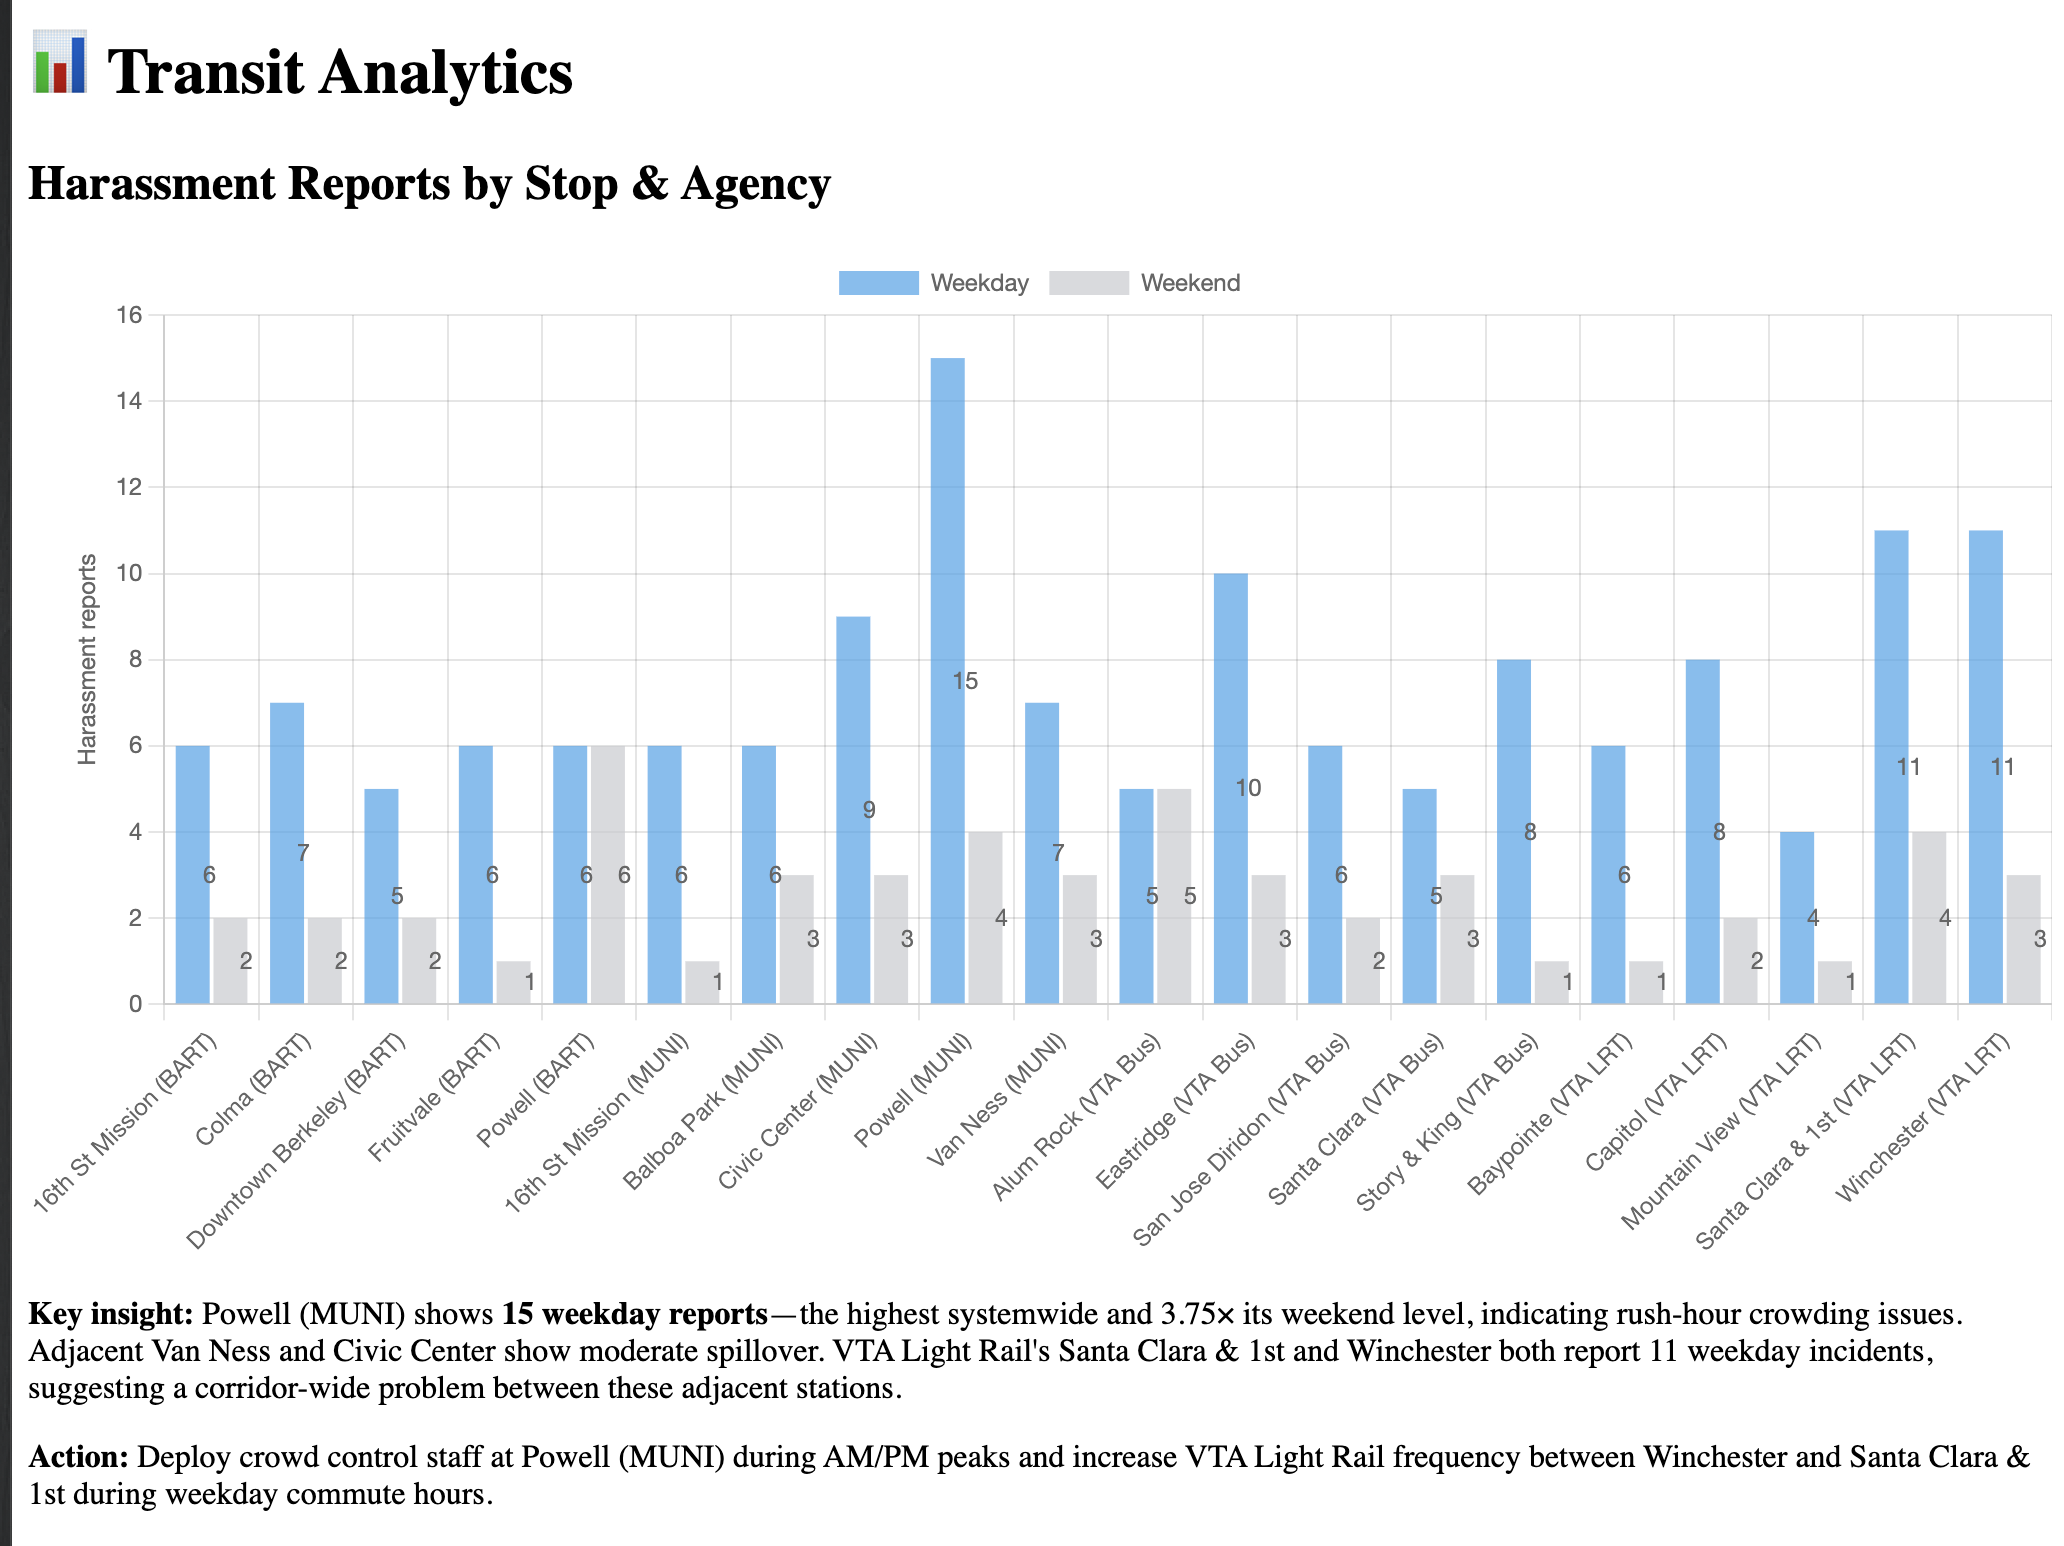
Analyzes relationships between adjacent stations
Inspiration
Transit agencies drown in citizen complaints but lack staff to sift patterns fast enough to act. We wanted an AI co-pilot that surfaces the "why" behind the numbers -- not just another dashboard. At the same time, we believe in transparency: riders should be able to make their complaints public so everyone can stay informed, empowered, and safe together.
What it does
- Ingests complaint records - we created a synthetic mirror of SFMTA public feedback data
- Slices data automatically into actionable segments: rush hour vs. off-peak, equipment failures in heat waves, concert/sports event days, high-incident stops, and more
- Plots each slice with Chart.js for intuitive exploration
- Summarizes the story using Claude 4 Opus. Our prompt includes examples and special logic (e.g., merging adjacent stations so that insights move beyond single stops) to generate clear, high quality insights
How we built it
- ✨ Synthetic data: Generated 1,000 realistic complaints mirroring public transit patterns across five years.
- 🛢️ Supabase Postgres stores incidents; Claude adds auto-tags to help organize them.
- 🧠 Claude 3 Opus summarizes each chart with markdown insights. Prompt includes few-shot examples, adjacent-station logic, and chart JSON.
- 📈 Next.js 13 + React-ChartJS-2 render the dashboard. Plugins add baselines, hotspots, and annotations.
- 🧊 Caching with Supabase: Summaries are stored under chart_id so we don’t hammer Claude every time.
Challenges we ran into
- No public datasets or PII allowed: We built a synthetic dataset statistically resembling real complaints while preserving privacy
- LLM anchoring bias: Claude hallucinated "no reports" when the JSON started with multiple zeroes (midnight-4 AM where no reports are made). Solving via pre-filtering and prompt tuning to prevent early-token bias from dominating.
Accomplishments that we're proud of
- 🌍 Aligned with UN SDGs:
- SDG 11 (Sustainable Cities & Communities): boosts trust and usage of public transit
- SDG 5 (Gender Equality): safer commutes through proactive harassment alerts
- SDG 3 (Good Health & Well-being): crowding insights help riders avoid unhealthy over-packed vehicles
- SDG 9 (Industry, Innovation & Infrastructure): AI-driven, low-cost analytics for civic infrastructure.
- ⚡ From CSV → dashboard → AI summary in ~3 s average round-trip
- 💸 Entire stack runs on Supabase free tier plus < $5/month for Claude API calls
What we learned
- Synthetic data can be just as powerful for prototyping real-world civic tech
- Few-shot prompting (feeding 5-7 formatted examples) gave Claude a consistent executive tone; zero-shot was hit-or-miss.
- Don’t feed your LLM raw zeros without thinking about positional anchoring bias.
What's next for Transit AI
- 📱 Public-facing dashboard for real-time safety & crowding info - riders can choose to make complaints public or anonymous. Women and vulnerable riders get real-time flags for trains/stations with rising harassment reports from others (crowd-effort). Live crowding + peak-hour heat-map, letting anyone plan a quieter or less-packed trip.
- 🗓️ Event integration (Eventbrite, city APIs) to detect cleanliness/crowding issues around big venues.
- 🔄 Swap in real 311 data from public transportation agencies - exact schema, just a simple Supabase import. Capture more insights.
- 📩 Share weekly PDF insight packets with the city’s transit ops team.
- 💬 Community feedback loop. Open source the API so advocacy groups can build add-ons (e.g., accessibility widgets, language-specific safety tips).
- 🧠 RAG-based querying (Retrieval-Augmented Generation) - use Supabase pgvector to push raw reports into a vector store and answer questions like, "Why are failures high at 85 °F?" by doing a similarity search for relevant historical incidents
- 🛠️ Trip-planner plugin — let journey apps like Google Maps pull in safety & crowding scores.
- 📊 ML classifiers — small models (logistic regression, XGBoost) to auto-detect likely harassment reports or maintenance issues.


Log in or sign up for Devpost to join the conversation.