Inspiration
Inspired from the RailVision Analytics challenge.
What it does
How we built it
Used Python to analyze the mathematical models to optimize the solution
Challenges we ran into
A team member quit, so plans were interrupted and we were down a member.
Accomplishments that we're proud of
What we learned
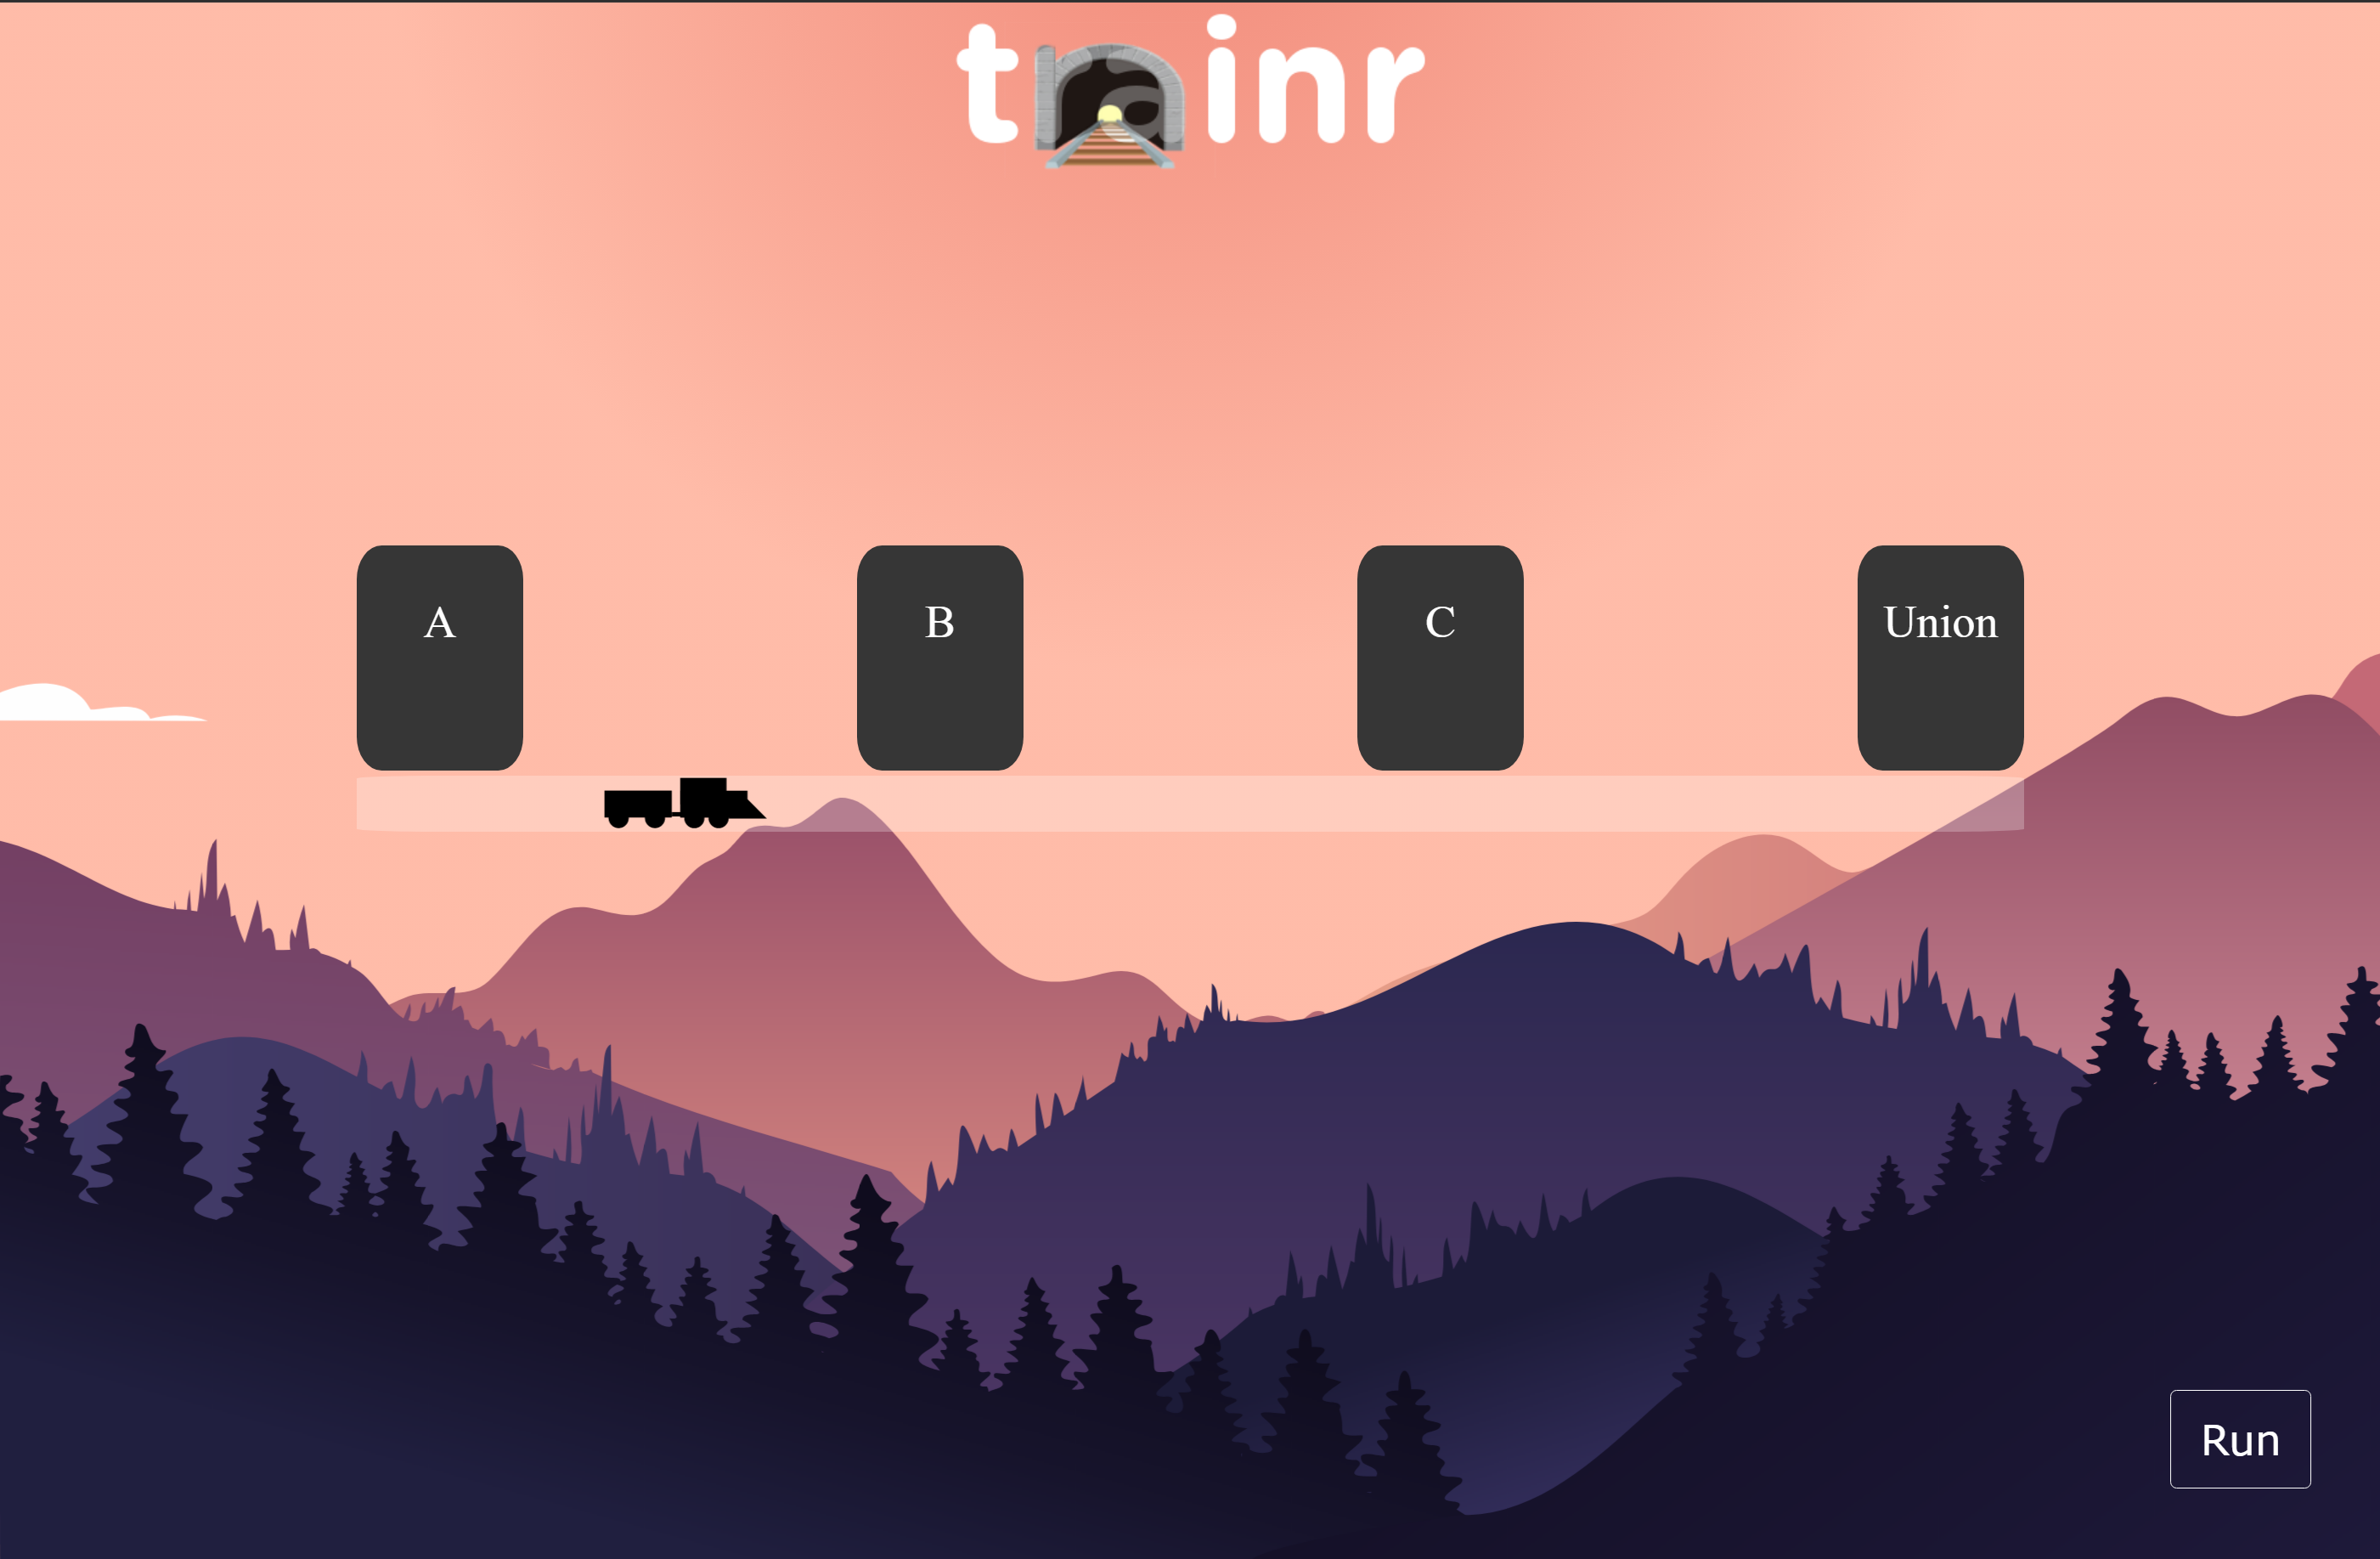
Learned to create SVGs in Figma and staggered CSS animations with keyframes.
What's next for trainr
It would be cool if the number of people at each station at any given time could be displayed alongside the trains.


Log in or sign up for Devpost to join the conversation.