-
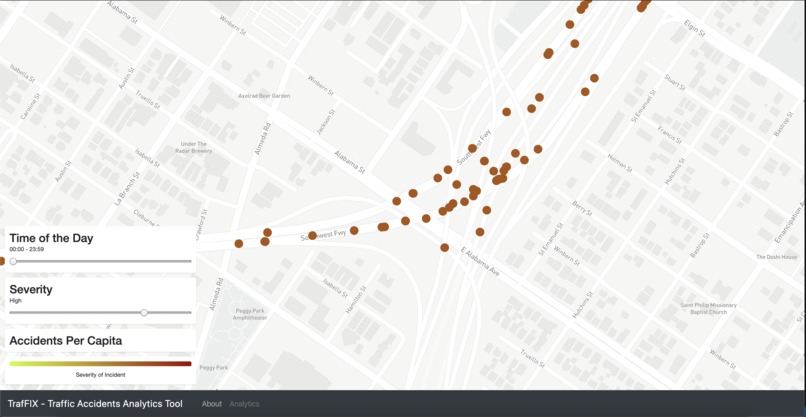
High severity accidents on junctions.
-

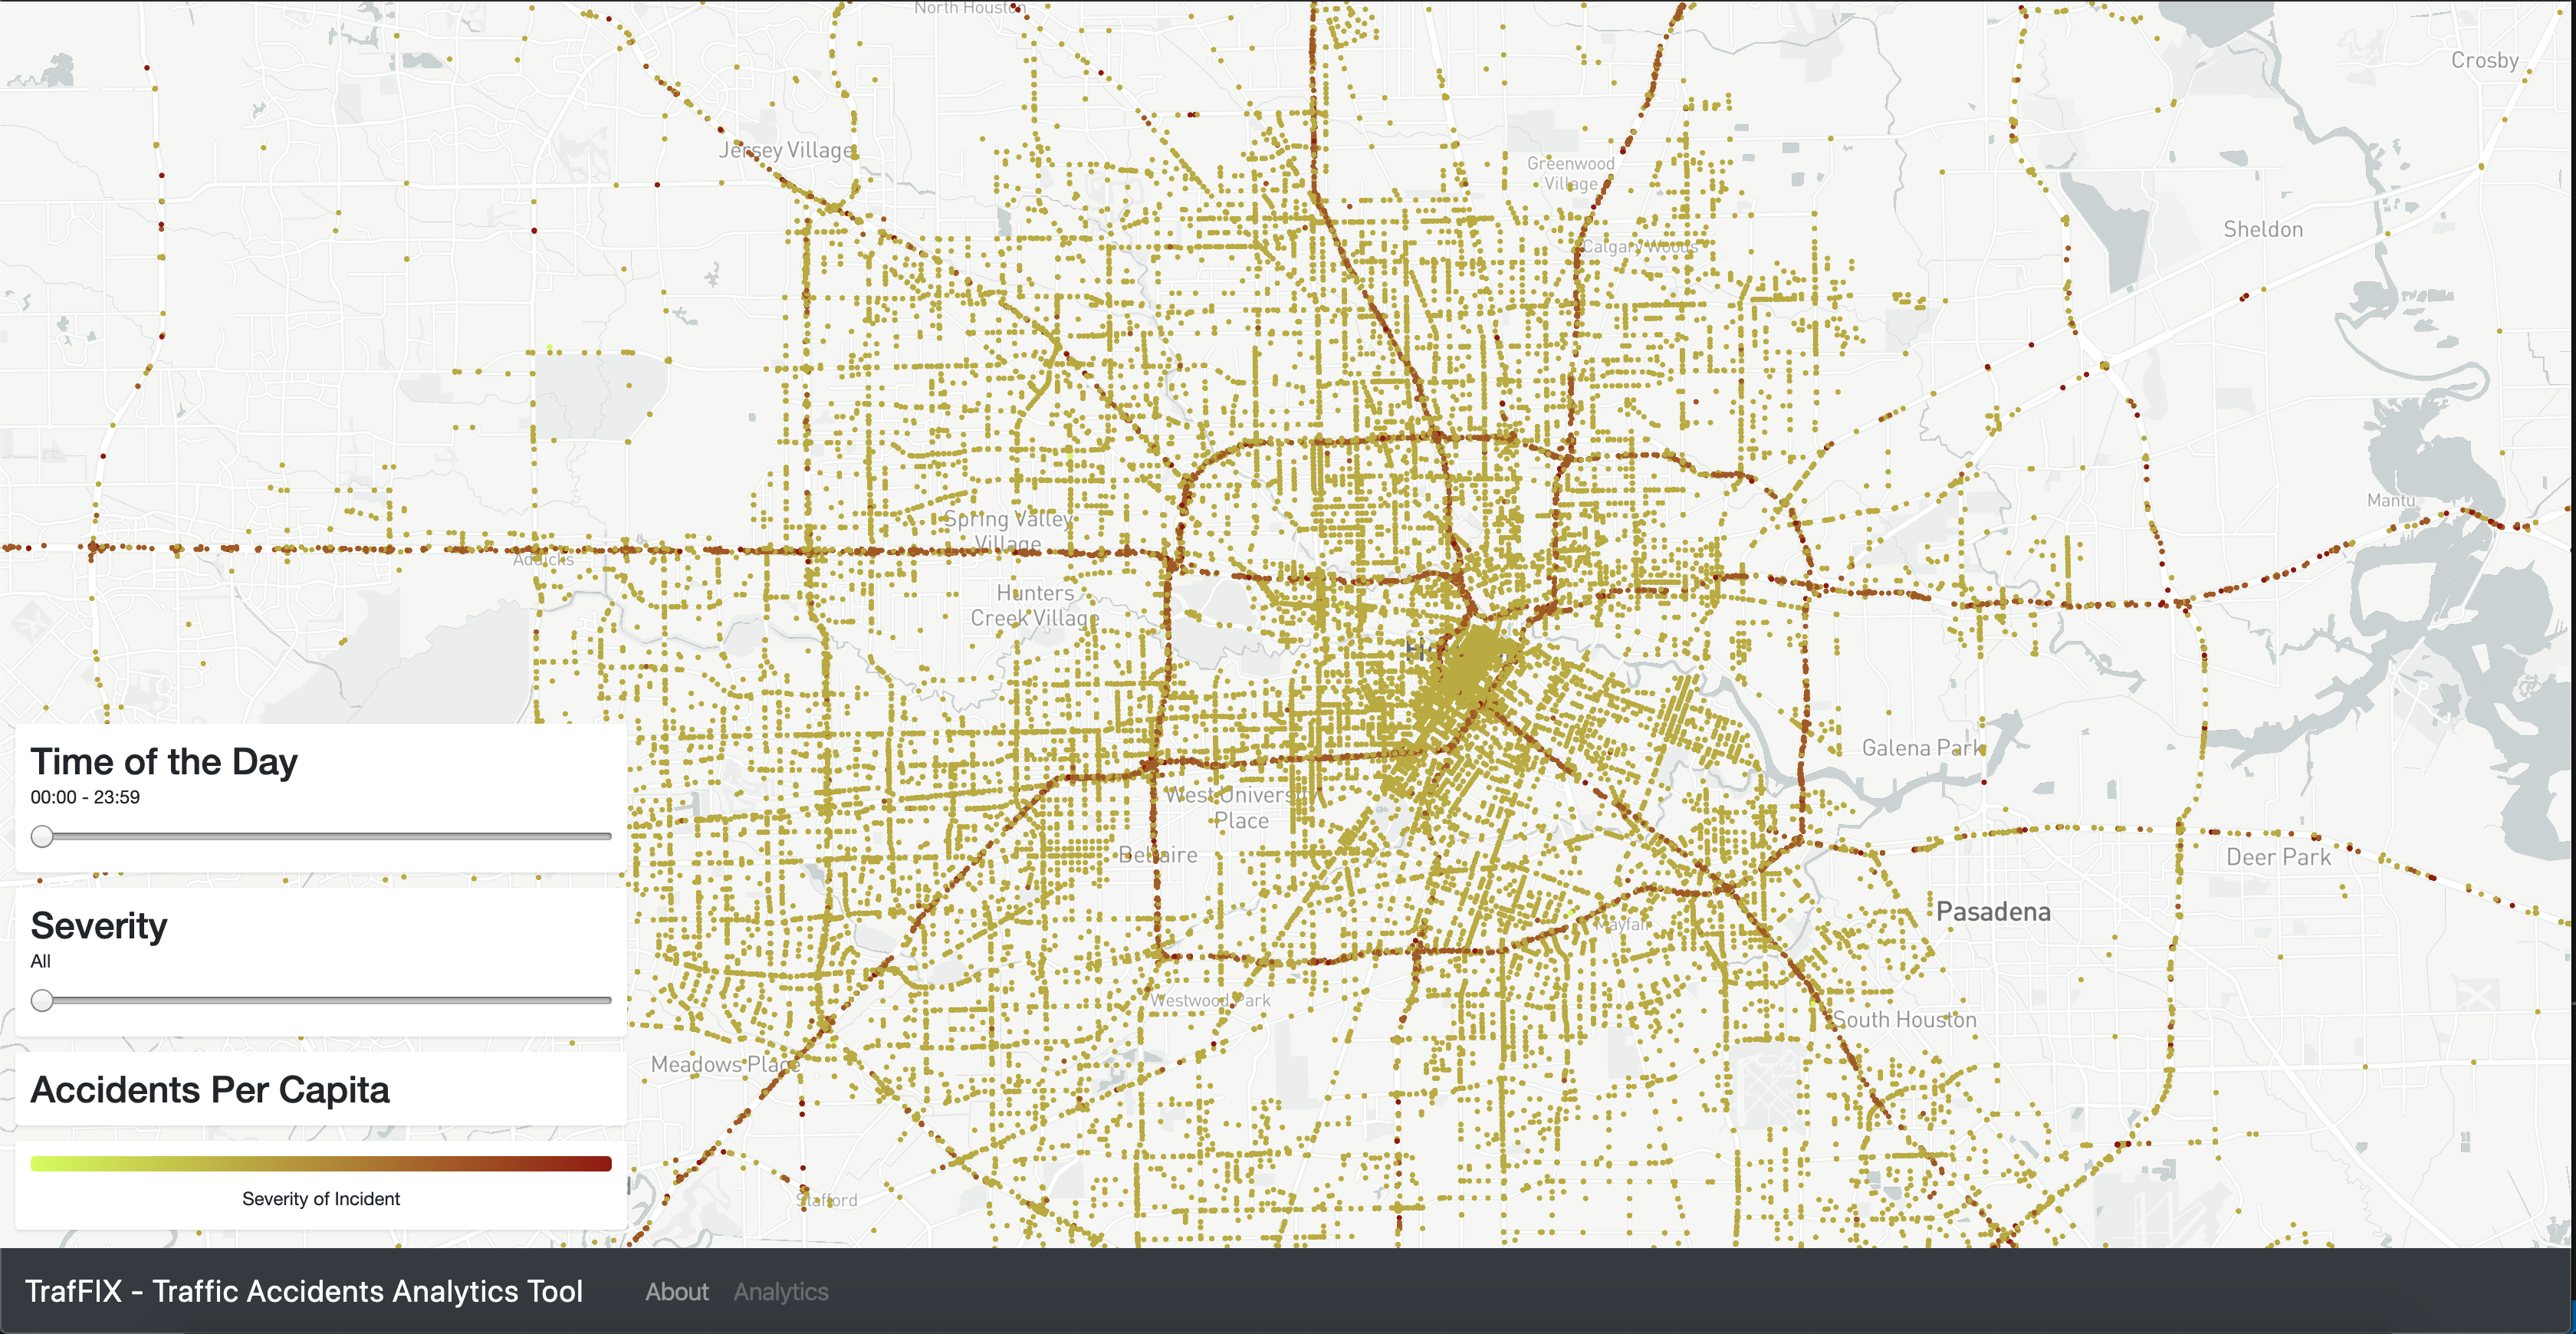
Houston accidents map.

Inspiration
-
What it does
TrafFIX allows users to explore car accident data across the country through an interactive map. With TrafFIX, you can learn precisely when and where accidents occur in your hometown!
How we built it
Out team used the accident data provides by State Farm!
Our team built TrafFIX using a series of tools including Django, Mapbox, and Jupyter notebooks. The frontend is implemented using javascript and the geo-spatial visualization library Mapbox. Using Pandas, we build a data pipeline to clean the data, analyze it, and export it to a JSON format designed for visualization.
Challenges we ran into
Large File Sizes
One of the challenges we faced throughout the project was working with large amounts of data! The full dataset provided by State Farm is larger that 1 Gigabyte. Cleaning the data in an efficient manner was a challenge, as it required us to clean the data set using functional programming.
Time Constrains
Our team was challenged by the time constraints of the hackathon. We hoped to include more analysis of the data, but wrangling the data turned into a larger challenge than we anticipated.
Accomplishments that I'm proud of
Data cleaning and Normalization
We are proud that we we were able to get our data pipeline up and running! We were able to fill in certain fields in the data using statistics. Many of the features in the dataset were distributed normally, so we were able to fill in empty spaces with random samples with respect to their mean and standard deviation.
Data Visualization
Working with more than 3 million data points is not easy. We used many techniques like parallel programming, clustering, and client-side optimization to plot more than 3,000,000 points in our map. Further, we selected the color scheme carefully to enhance the user experience.
What we learned
We learned that working with large datasets in a small amount of time is not easy as there are always so many unforeseen circumstances that may affect the delivery of the product. We also learned how to create priorities to deliver a MVP.
What's next for TrafFIX - Traffic Accidents Analytics Tool
We would like to increase the number of filters and show statistics for individual accidents. Further, we would like to group accidents happened at the same locations to give further information on how to improve that section of roads.

Log in or sign up for Devpost to join the conversation.