-
-
HomeScreen
-

Real-Time Dashboard
Motivation
Public transit forms the backbone of cities across the world. The City of Edmonton alone ingests tens of millions of riders, defined as the number of passengers who board a bus in a given amount of time, each year.
These metrics inform policy decisions by providing the basis for demand modelling, and help provide answers to questions like,
"How many people would still ride the bus if the price was raised by x amount of dollars?"
These key decisions therefore rely heavily on precise ridership metrics. The current automated passenger counting system meant to provide this value for each bus has a major flaw. It counts the ridership for one passenger upon the completion of two steps:
- Tapping to pay when a passenger gets on
- Tapping out when a passenger gets off
Most individuals perform the first step but neglect the second one. This issue is exacerbated by the existence of programs such as the "U-Pass" for university students, where holders pay a seasonal fee and then experience essentially free travel, providing them with no economic motivation for tapping out.
Furthermore, based on the Edmonton Transit Report from 2016, students make up roughly 22% of public transit ridership, furthering the inaccuracy in the existing data.
As such, there is a significant need for a methodology that is able to provide near-accurate estimates for public transit ridership without added infrastructure costs, and this is precisely what our proposed solution provides, as detailed below.
What it does
LiveBusesVolumes takes live video feeds from existing cameras and turns them into actionable insights for transit authorities.
🔹 Real-Time Passenger Counting
We use smart object detection models to count how many people are on a bus at any given moment—without storing any personal data.
🔹 Instant Insights
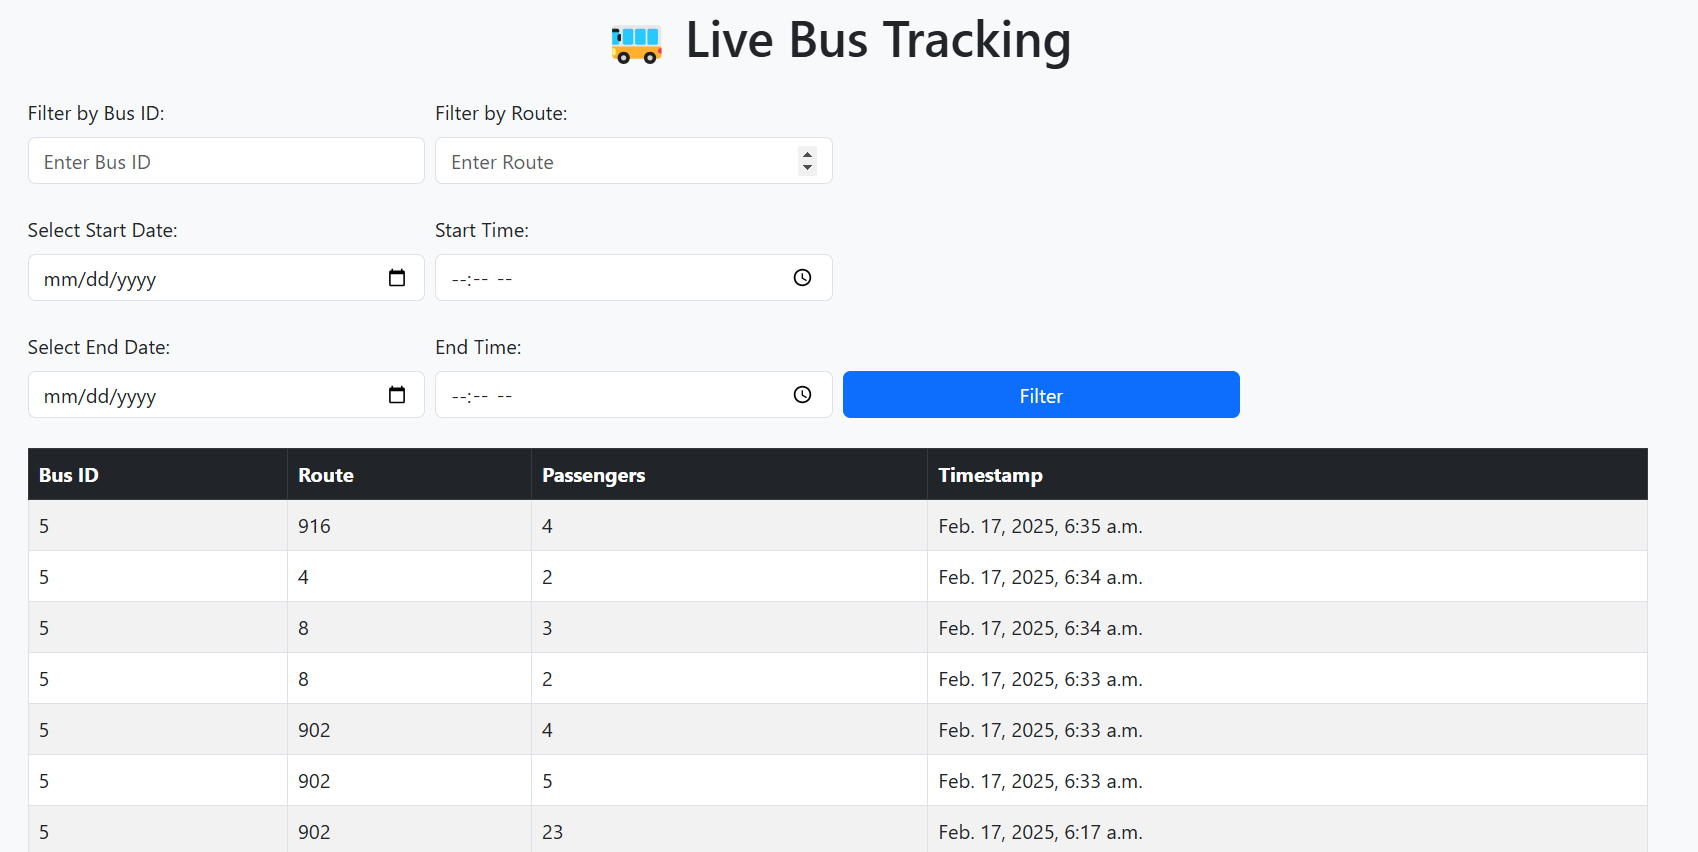
The data flows through our system and shows up on a dynamic dashboard, helping transit agencies quickly see where the demand is high.
🔹 Optimized Transit Operations
With real-time data, cities can adjust bus routes, add more buses in crowded areas, and even react faster in emergencies.
How we built it
🏗 Using What We Have
We started with the cameras already in place on buses, in stations, and around the city. No need for expensive new hardware.
🔄 Data Pipeline
We set up Apache Kafka to take in live video streams, which then flow to Apache Flink for real-time processing. This helps us run our machine learning model—YOLOv8 with OpenCV—to count passengers accurately.
📦 Containerization
We wrapped everything in Docker containers to ensure a smooth transition to deployment.
📊 Dashboarding
Finally, we built a user-friendly dashboard that shows all these insights in real time, making the data easy to understand and act on.
Challenges we ran into
No project is without its bumps along the road:
🔐 Privacy First
Making sure we only counted people without capturing any personal details was a major challenge. We needed our system to be both smart and respectful of privacy.
⚡ Real-Time Hurdles
Handling live video streams with minimal delay meant fine-tuning Kafka and Flink to work seamlessly together, even when hundreds of feeds were coming in at once.
📈 Scaling Up
As the number of cameras increased, so did the load on our system. We had to ensure our infrastructure could handle it without breaking a sweat.
🌤 Variable Environments
Different lighting, weather conditions, and camera angles meant our machine learning model had to be robust enough to handle a variety of scenarios.
Accomplishments that we're proud of
We’re really proud of what we’ve built:
✅ Robust Data Pipeline: Our integration of Apache Kafka and Flink handles live feeds from hundreds of cameras without missing a beat.
✅ Privacy by Design: We achieved our goal of processing data without ever storing personal information, proving that innovation and privacy can go hand in hand.
✅ Scalable and Flexible: Containerizing our solution ensures that our system can grow with the needs of any city or transit agency.
✅ Real-Time Impact: Our dashboard provides immediate insights that can help transit authorities make data-driven decisions on the fly.
✅ Innovative Features: From live bus tracking with GPS overlays to spatial fragmentation analysis, we’ve packed in features that provide depth and clarity to the raw data.
What we learned
Working on traffig-gang:LiveBusesVolume has been a real eye-opener.
While our solution is up and running, we quickly realized that there’s always room for improvement. Every bug we fixed, every tweak we made, and every unexpected challenge taught us something new.
We learned that innovation isn’t a destination—it’s a continuous journey.
We're excited by the progress we’ve made, and even more thrilled about the endless possibilities ahead as we keep refining our system.
What's next for traffig-gang:LiveBusesVolume
🚀 Our journey is just beginning. Here’s where we see this project headed:
🔍 Deepening Analytics
We’re looking to refine our spatial analysis further, which could lead to smarter seating recommendations and even bus design insights.
🏙 Smart City Integration
Next up is integrating our system with other smart city initiatives—think adaptive traffic signals, smart parking, and more—creating a holistic urban mobility solution.
⏳ Enhanced Real-Time Features
We plan to add more predictive analytics and improved real-time updates via WebSocket connections, so transit agencies can anticipate changes rather than just react to them.
🏛 Policy and Community Collaboration
We’re eager to work with local governments and transit agencies to embed these insights into everyday urban planning and emergency response strategies.
🤝 Building a Community
Finally, we want to foster an open-source community around this project, welcoming contributions and ideas to continuously improve and expand its capabilities.


Log in or sign up for Devpost to join the conversation.