Inspiration
The inspiration behind the project was the learnings about the impact of system failures on customer experience from my internships at SMRT Trains Ltd., Singapore.
What it does
We present an alternative maintenance scheduling strategy to reduce maintenance costs related to the upkeep of the ferries and terminals. In this particular solution, we will be looking at Ferry Maintenance of BC Ferries, which run about 20 ferries over 12 routes and connect 8 terminals. Our project makes data-driven predictions about unplanned downtime or breakdowns at the terminal and of ferries for future ferry trips. This is done with the aim that the operators can then use these predictions to schedule issue-specific maintenance as well as to adapt operations and logistics of ferries, routes, and terminals.
How we built it
We utilized data provided by BC Ferries for CANSSI NCSC Ferry Delays Kaggle Competition. It included data involving records about the sailing of 61,880 sailings occurring between August 2016 and March 2018 and an indicator is provided describing whether or not the sailing was delayed.
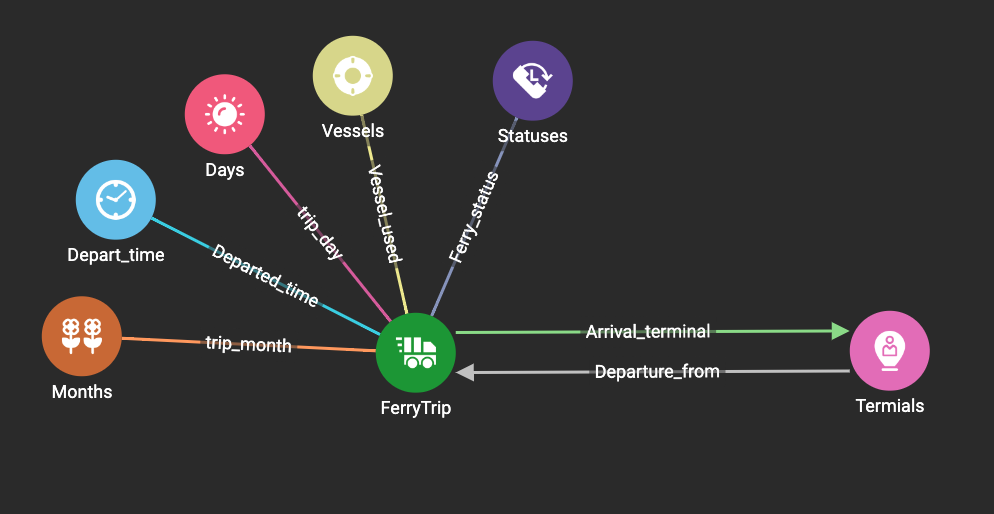
Utilizing data from readily available and established sources also reduces the cost and effort of implementation of tracking sensors on ferry equipment which usually follows when switching to a predictive maintenance routine. We used the TigerGraph platform to represent the relationships within the data. Then a series of algorithms from the TigerGraph Data Science Library was used to predict a trip’s status ( ‘Status’ label attribute in the FerryTrip vertices).
To get predictions on the ‘Status’ label of a ferry trip, we first used a community detection algorithm on training data from the Tiger Graph Data Science library to identify clusters of Trips and neighboring vertices with some status labels such as On-time, Operational Delays, Mechanical difficulties with the vessel, Extreme tidal conditions, Mechanical difficulties with terminal equipment, Heavy traffic volume, and Vessel start-up delays. After training data were clustered, we loaded testing data on a classification algorithm within the cluster to predict the ‘status’ label of test ferry trips. The output of the algorithm produces a list of Ferry Trip with Status attribute for every vertex.
Challenges we ran into
The first challenge was finding an easily accessible, transparent, and telling data source to use. The second major challenge involved designing a schema that let users explore insights via Build Graph Patterns and also run algorithms from the TigerGraph Data Science Library. However, the hardest challenge was finishing the project on time. I had taken on a rather ambitious project to do all by myself.
Accomplishments that we're proud of
I am proud of being able to predict unplanned downtime or breakdowns at the terminal and of ferries for future ferry trips by using readily available and established sources. Usually, when a switch from scheduled to predictive maintenance is made, it incurs additional costs because of the installation of sensors and trackers. However, being able to predict failures with just past ferry records makes me feel accomplished.
What we learned
A majority of my learning revolved around GSQL, graph analytics, and graph databases. In addition, I read a lot on prediction models and utilizing core machine learning fundamentals on graph databases.
What's next for Predictive Asset Maintenance Plan
- Integrating traffic congestion levels on nearby bridges to predict traffic volume-related issues.
- Integrating passenger volume information by utilizing TransLink(train) ridership and volume
- Use data with more detailed issues/breakdowns not only when on a trip but also outside operational hours.
- A further improvement can be done by integrating real-time tweets about ferries to improve the prediction of traffic volume-related delays/holdups.
Built With
- gsql
- tigergraph


Log in or sign up for Devpost to join the conversation.