Inspiration
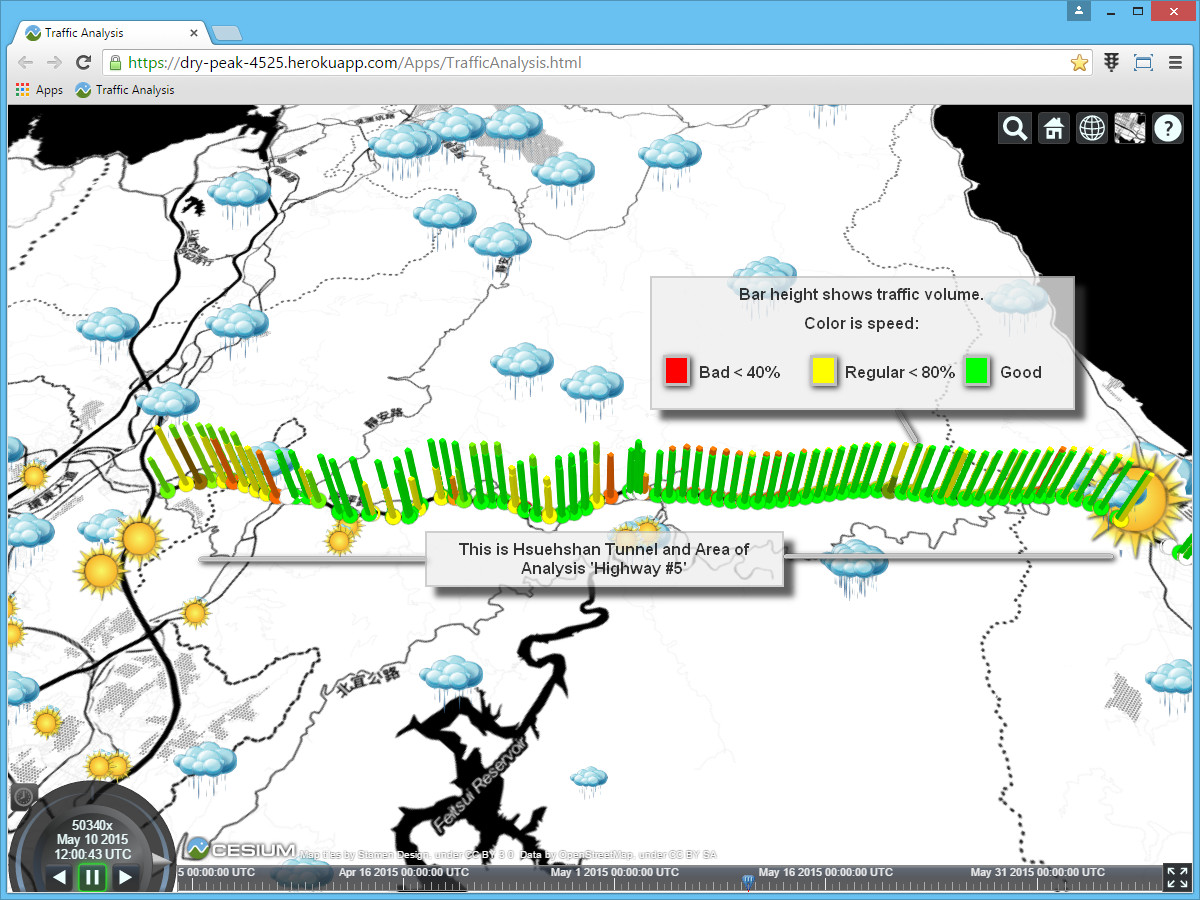
Hsuehshan Tunnel highway #5 has a shape that allows to be used as the baseline for a chart that is served from czml (json) file.
What it does
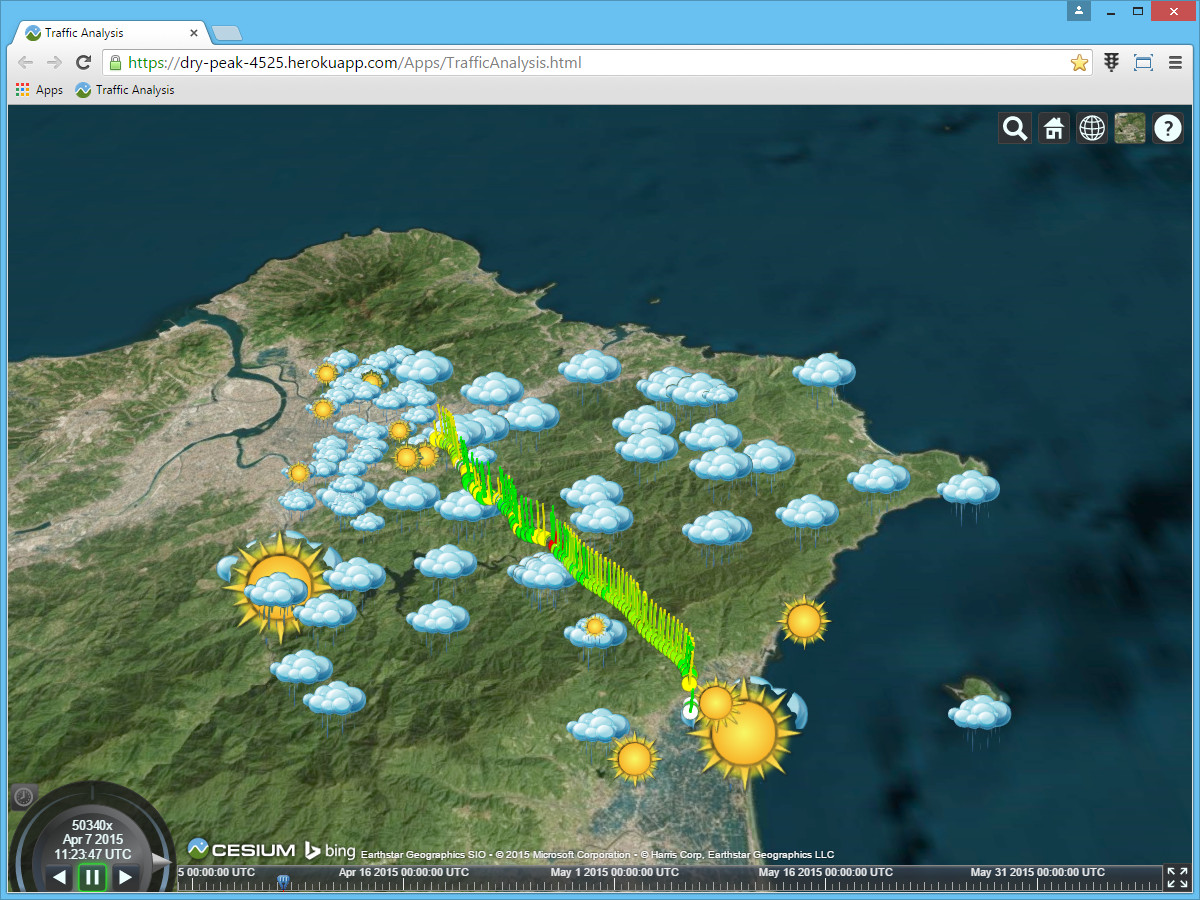
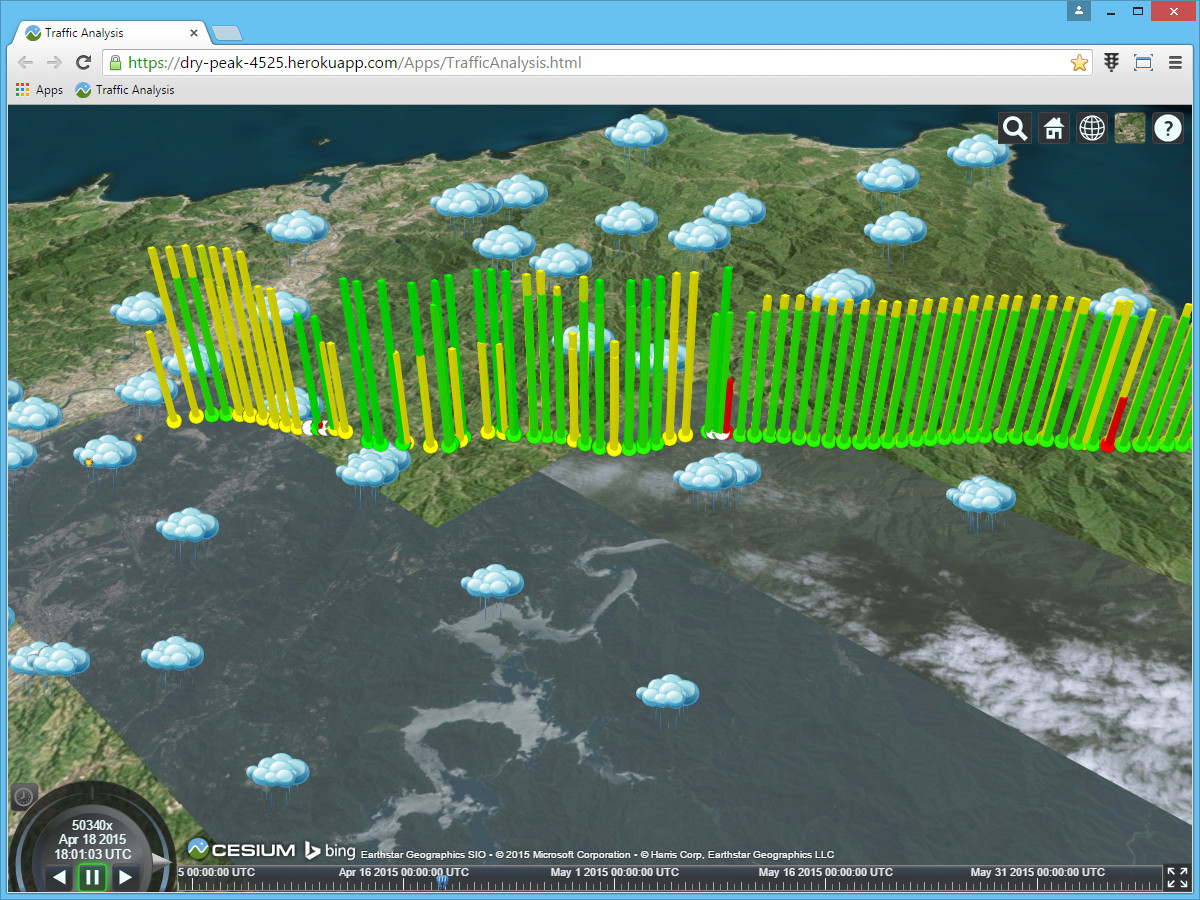
Visualize traffic information and combine it with weather info.
How I built it
Converted original json to postgresql. Then, I used node.js to create the czml (json) file that is injected to the visualization.
Challenges I ran into
Conversion from original structure to my final format required a bit of work. I didn't found much examples of cesium format so I went through a few trial test cycles.
Accomplishments that I'm proud of
I think semaphore colors assigned to speed chart are good in combination with the volume illustrated by bar height. Heights and speed values are normalized.
What I learned
Cesium javascript library and also their czml format.
What's next for Traffic Analysis
Run analysis on more variables.

Log in or sign up for Devpost to join the conversation.