-
-
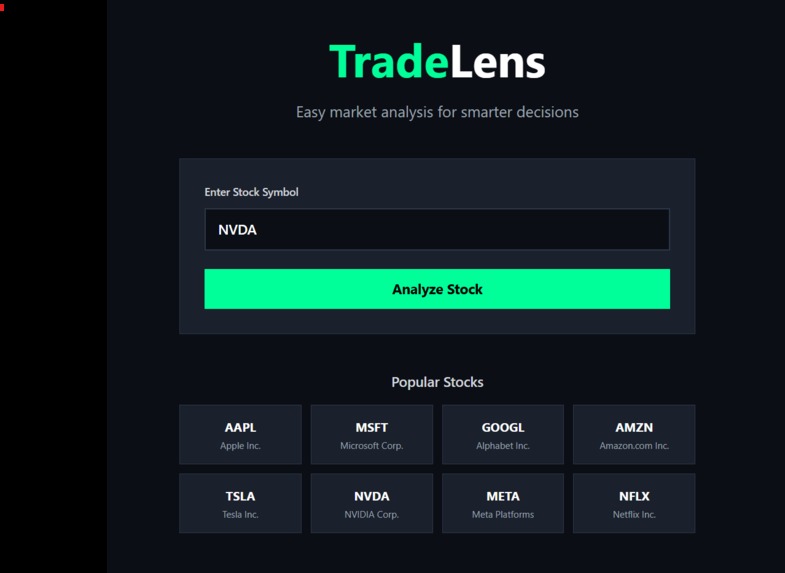
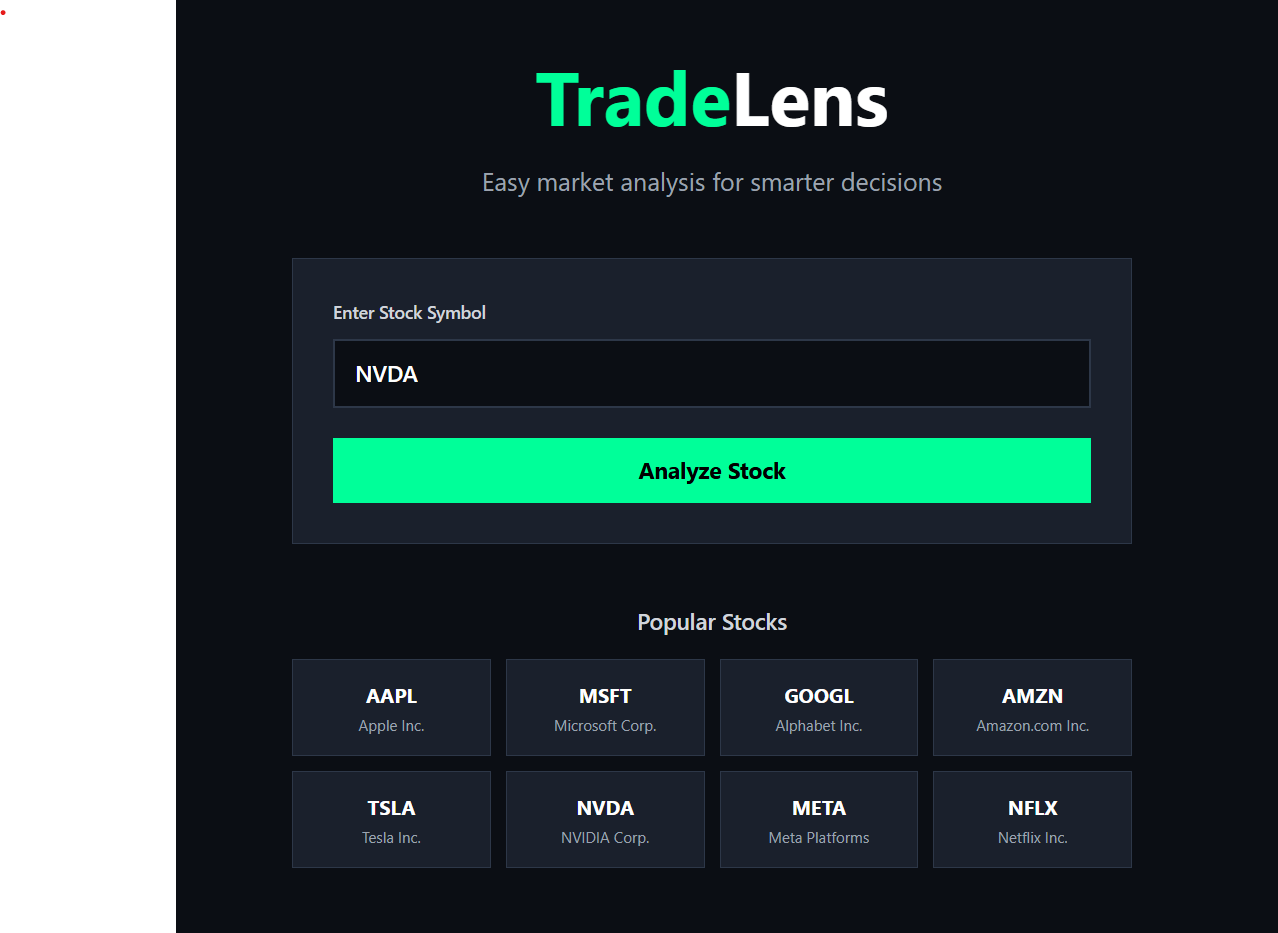
Frontpage
-
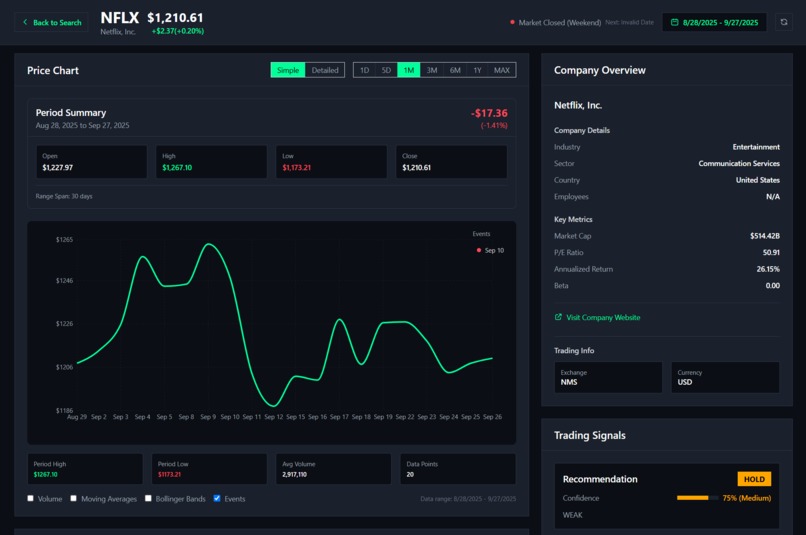
Dashboard Overview
-
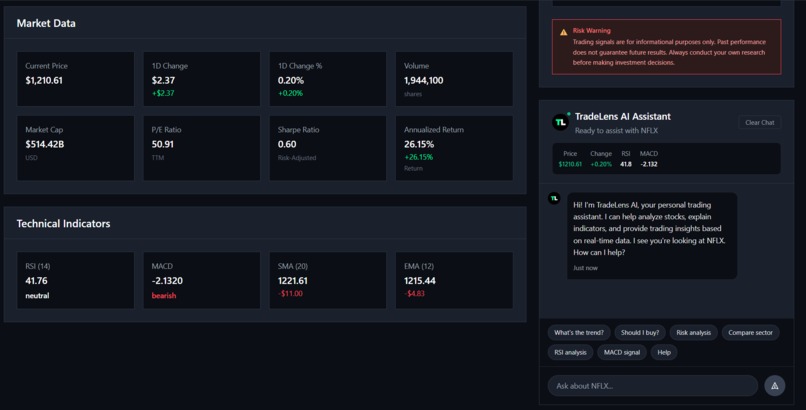
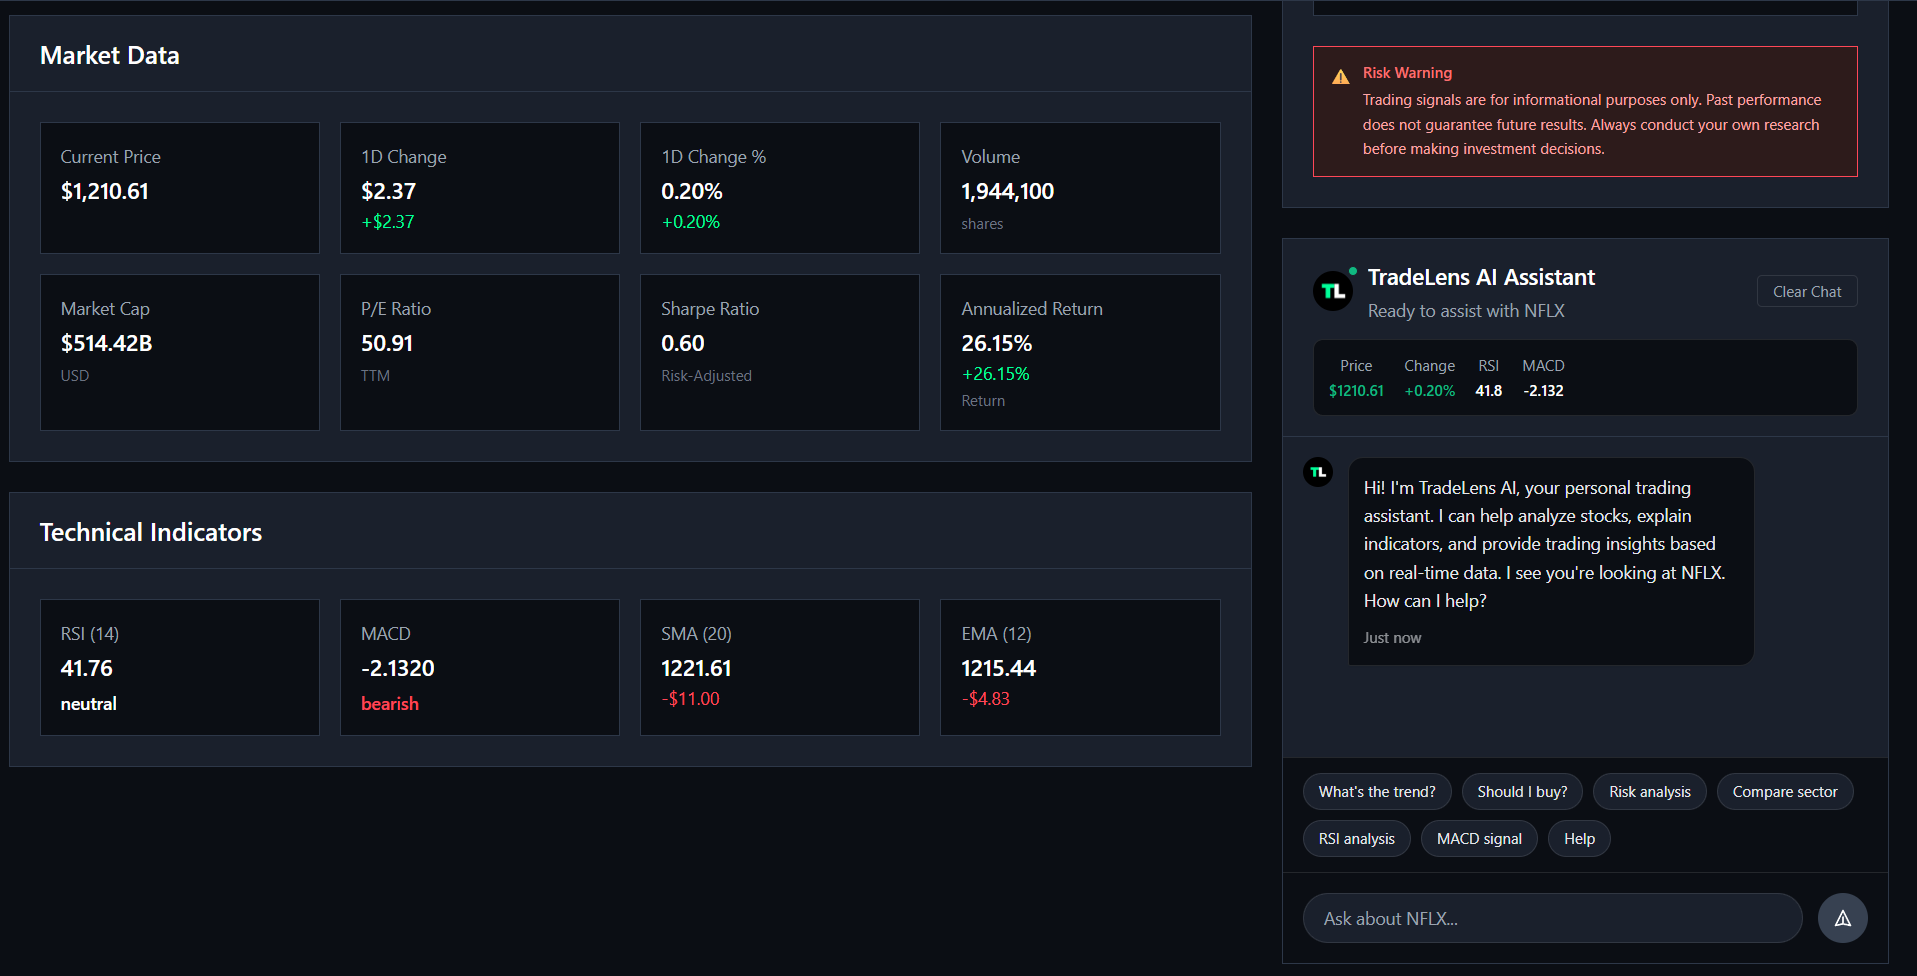
Stock Analysis & Chat Assistant
-

Technical Indicators & Trading Signals

Inspiration
The stock market can feel overwhelming especially for beginners trying to make sense of thousands of stocks, complex technical indicators, and fast-moving market conditions. Even experienced traders spend countless hours analyzing data, interpreting charts, and tracking market news before making decisions.
We created TradeLens with one mission: to simplify stock market decisions. By transforming raw, fragmented market data into clear, actionable insights, TradeLens makes professional-grade trading tools accessible to everyone from beginners learning the basics to seasoned investors refining their strategies.
What it does
TradeLens is a comprehensive stock analysis platform designed to simplify market intelligence while maintaining institutional-level depth and accuracy. It combines real-time data, technical analysis, AI-driven insights, and news integration into one intuitive interface.
Key Features
- Real-Time Stock Analysis: Live price, volume, and fundamental data.
- Technical Indicators: RSI, MACD, moving averages, Bollinger Bands, and more.
- Interactive Charts: Multi-timeframe visualizations with technical overlays.
- AI-Powered Trading Assistant: Contextual trading insights and sentiment analysis.
- Risk Assessment: Volatility and sentiment-driven buy/sell/hold recommendations.
- Sector Comparison: Benchmark stock performance against industry peers.
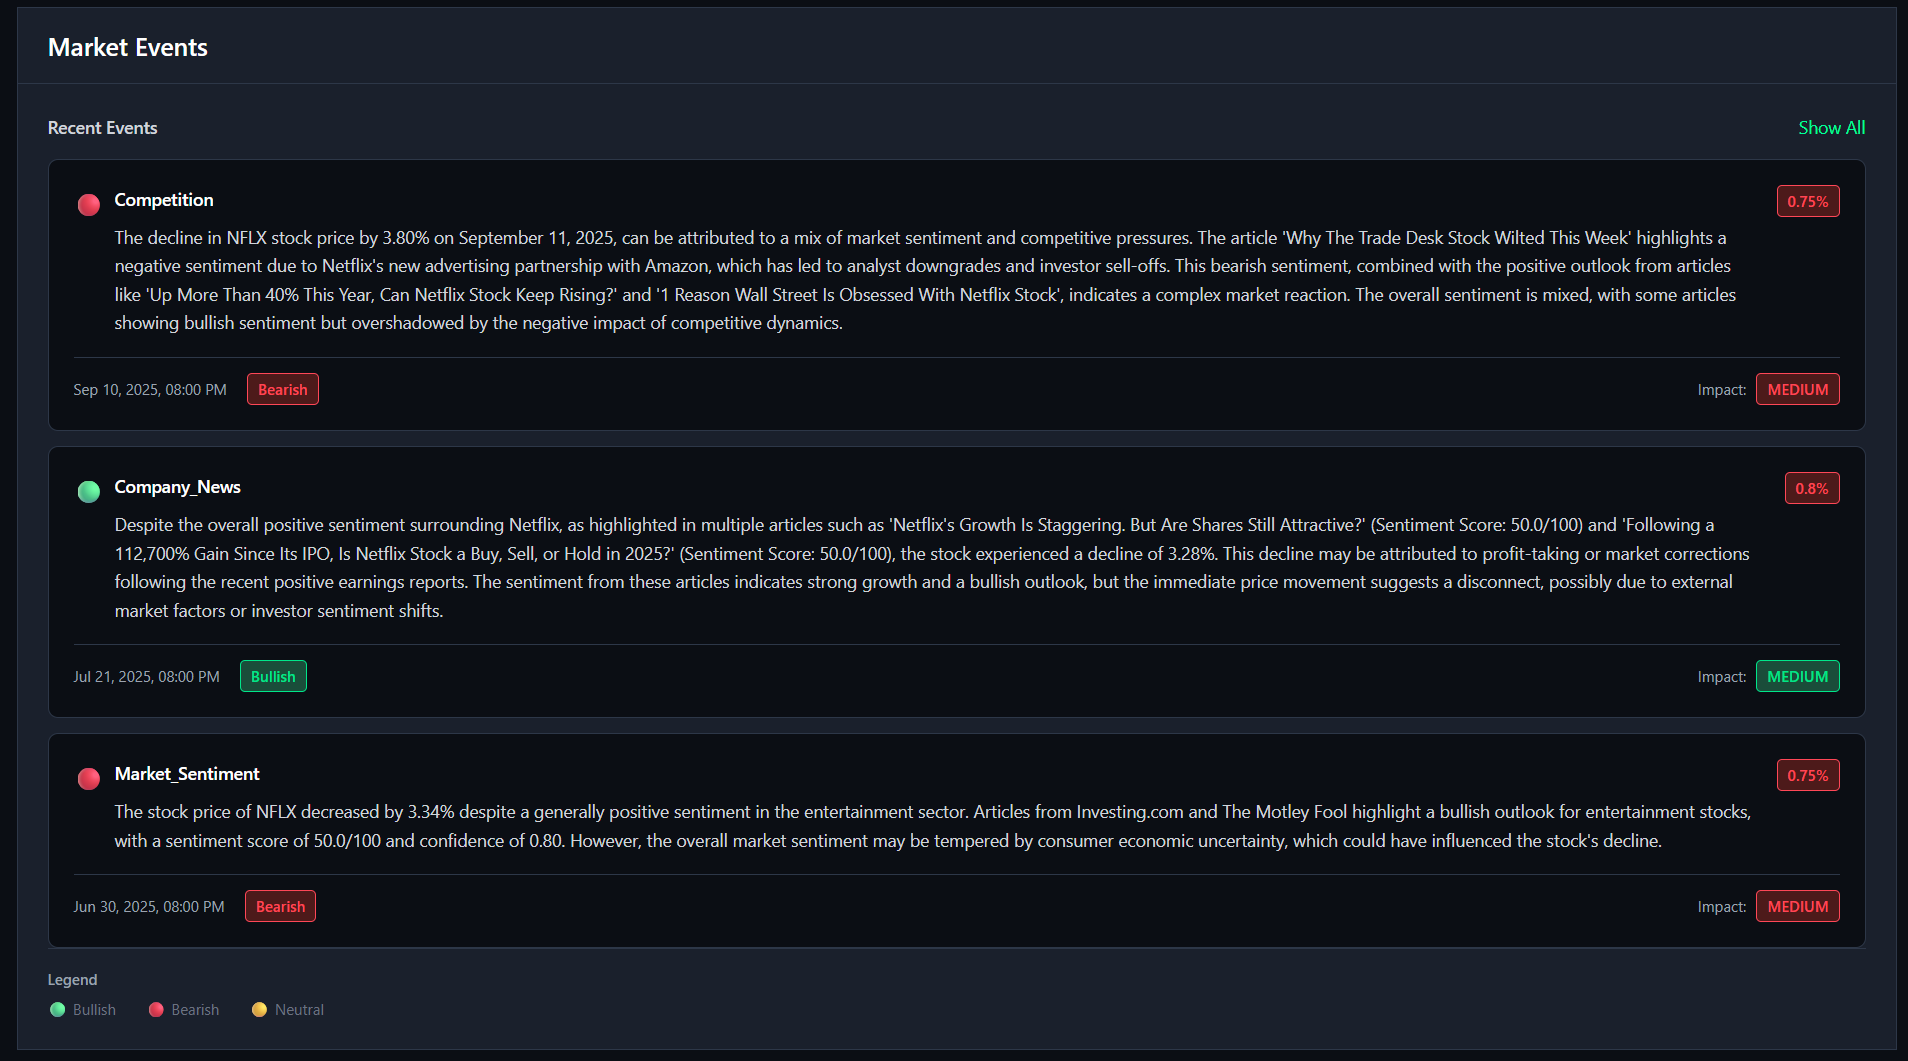
- News Aggregation: Real-time event tracking and news relevance scoring.
How we built it
Frontend Development
We built the frontend with React and TypeScript for maintainability, scalability, and type safety. The interface follows a modular, component-based design.
Technologies Used
- React Router – Seamless navigation
- Tailwind CSS – Responsive dark-themed design
- Recharts / Chart.js – Data visualization
- Axios – API communication
Backend Infrastructure
The backend is powered by Python Flask, exposing RESTful APIs to fetch and process market data in real time.
Technical Analysis Engine
We implemented all technical indicators from scratch to ensure precision, flexibility, and full control over calculations. Two of the most fundamental indicators RSI and MACD are defined below.
1. Relative Strength Index (RSI)
The Relative Strength Index (RSI) measures the speed and magnitude of price movements and helps identify overbought or oversold market conditions. It is calculated as:
$$ RSI = 100 - \frac{100}{1 + RS} $$
where:
$$ RS = \frac{\text{Average Gain}}{\text{Average Loss}} $$
- Average Gain: Mean of all positive price changes over a specified period (commonly 14 periods).
- Average Loss: Mean of all negative price changes (absolute values) over the same period.
An RSI value above 70 typically indicates an overbought condition, while a value below 30 indicates an oversold condition.
2. Moving Average Convergence Divergence (MACD)
The MACD is a momentum indicator that shows the relationship between two exponential moving averages (EMAs). It is calculated as:
$$ MACD = EMA_{12} - EMA_{26} $$
where:
- ( EMA_{12} ): 12-period Exponential Moving Average
- ( EMA_{26} ): 26-period Exponential Moving Average
Additionally, a signal line is calculated as:
$$ \text{Signal Line} = EMA_9(MACD) $$
The signal line is used to identify bullish and bearish crossovers:
- When the MACD crosses above the signal line → potential buy signal.
- When the MACD crosses below the signal line → potential sell signal.
These indicators form the foundation of our analysis engine and power many of the platform’s AI-driven trading insights.
Challenges we ran into
- Real-Time Synchronization: Balancing multiple API data sources while staying within rate limits.
- Mathematical Precision: Implementing indicators like RSI and MACD to professional-grade accuracy.
- Performance: Rendering large, continuously updating datasets without lag.
- Cross-Browser Consistency: Ensuring a uniform UI/UX across devices and browsers.
- API Rate Limits: Designing around strict data provider constraints.
- Type Safety: Structuring complex data types safely across the entire TypeScript codebase.
Accomplishments that we're proud of
- Seamless Data Integration: Unified multiple financial APIs into one cohesive system.
- AI-Driven Insights: Built a trading assistant that offers predictive, contextual recommendations.
- Professional UI/UX: Created an interface that rivals institutional trading terminals.
- Technical Accuracy: Indicators match results from professional platforms.
- High Performance: Sub-second query responses, even with heavy data loads.
- Fully Responsive Design: Works seamlessly across desktop and mobile devices.
What we learned
Technical Skills
- Advanced React state management for real-time data.
- Implementation of complex financial indicators and algorithms.
- RESTful API design for high-frequency data pipelines.
- Data-intensive performance optimization.
Domain Knowledge
- Market structure, trading psychology, and sentiment behavior.
- Practical use of technical analysis methodologies.
- API ecosystems and financial data architecture.
- Financial-focused UI/UX design principles.
What's next for TradeLens - Trading Simplified
The future of TradeLens goes far beyond stock analysis. Our next development phase focuses on transforming it into a complete AI-powered trading companion capable of analyzing, predicting, simulating, and guiding users through every stage of their trading journey.
Portfolio Tracking & Watchlists
TradeLens will feature a comprehensive portfolio management dashboard that continuously tracks user holdings, custom watchlists, and real-time profit/loss data. By combining this with predictive modeling, the system will offer:
- Personalized rebalancing strategies based on volatility and sector momentum.
- Risk-aware recommendations aligned with user-defined tolerance.
- Performance forecasting based on AI-generated price trends.
AI-Driven Smart Alerts
Smart Alerts will evolve into predictive notification systems. Instead of simple price triggers, users will receive:
- Trend Shift Warnings: Alerts for momentum reversals.
- Breakout Probability Signals: Warnings for impending breakout conditions.
- Reversal Zone Predictions: Proactive alerts for trend exhaustion.
Predictive Analytics Integration
We will integrate AI Stock Predictor, which leverages ML models like LSTM, ARIMA, and ensemble regressors alongside sentiment data to forecast:
- 5-Day Price Movements: Short-term, high-accuracy forecasts.
- Custom Time-Horizon Trends: Predictions tailored to trading goals.
- Volatility Ranges: Insights into likely price fluctuation zones.
- Probability-Weighted Signals: Actionable buy/sell recommendations with confidence scores.
Paper Trading Simulator
A realistic simulation environment will allow users to test trading strategies including AI-generated signals without financial risk. Features include:
- Historical replay and forward simulation.
- Real-world constraints such as transaction costs and slippage.
- Performance analytics with win-rate and drawdown metrics.
Options Analysis & Greeks Forecasting
We will add options analytics, offering:
- IV Crush Predictions: Volatility behavior around earnings/events.
- Greeks Analysis: Real-time delta, gamma, theta, and vega projections.
- AI-Suggested Strategies: Straddles, spreads, and iron condors with risk/reward analysis.
- Optimal Strike Selection: Automated recommendations based on predictive models.
Built With
- alpha-vantage
- axios
- caching
- chart.js
- data-processing
- flask
- flask-cors
- json
- natural-language-processing
- newsapi
- numpy
- openai
- pandas
- polygon
- python
- react
- react-router
- recharts
- redis
- restful-api
- spa
- tailwind-css
- typescript
- yfinance


Log in or sign up for Devpost to join the conversation.