Inspiration
The post-COVID inflation surge revealed a major weakness in how many forecasting models view the global economy. Most traditional approaches treat countries as mostly independent systems, even though modern economies are deeply connected through trade networks.
A factory shutdown in one country can increase production costs for its trading partners, which can then affect their own suppliers and consumers. These effects can travel through the global economy, but methods such as ARIMA and VAR often struggle to capture these network-based spillovers.
We wanted to answer a simple question: can inflation be modeled in a way that reflects how economic shocks actually spread across countries?
What it does
We developed a Spatio-Temporal Graph Neural Network (ST-GNN) to forecast one-step-ahead quarterly CPI inflation across 23 major economies, including G20 countries along with the Netherlands, Singapore, Switzerland, and Vietnam.
Instead of treating each country separately, our model represents the global economy as a dynamic trade network. Countries are represented as nodes, while trade relationships form the connections between them.
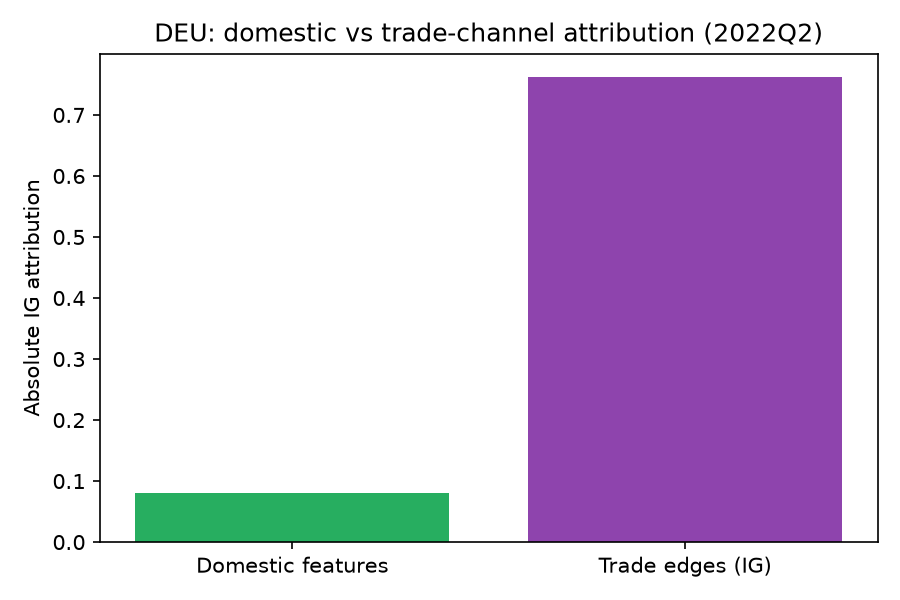
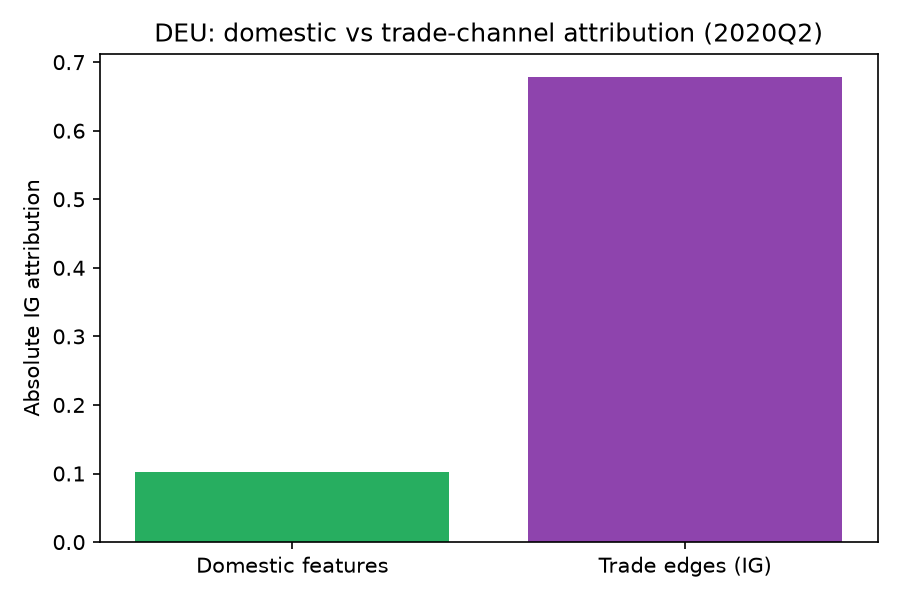
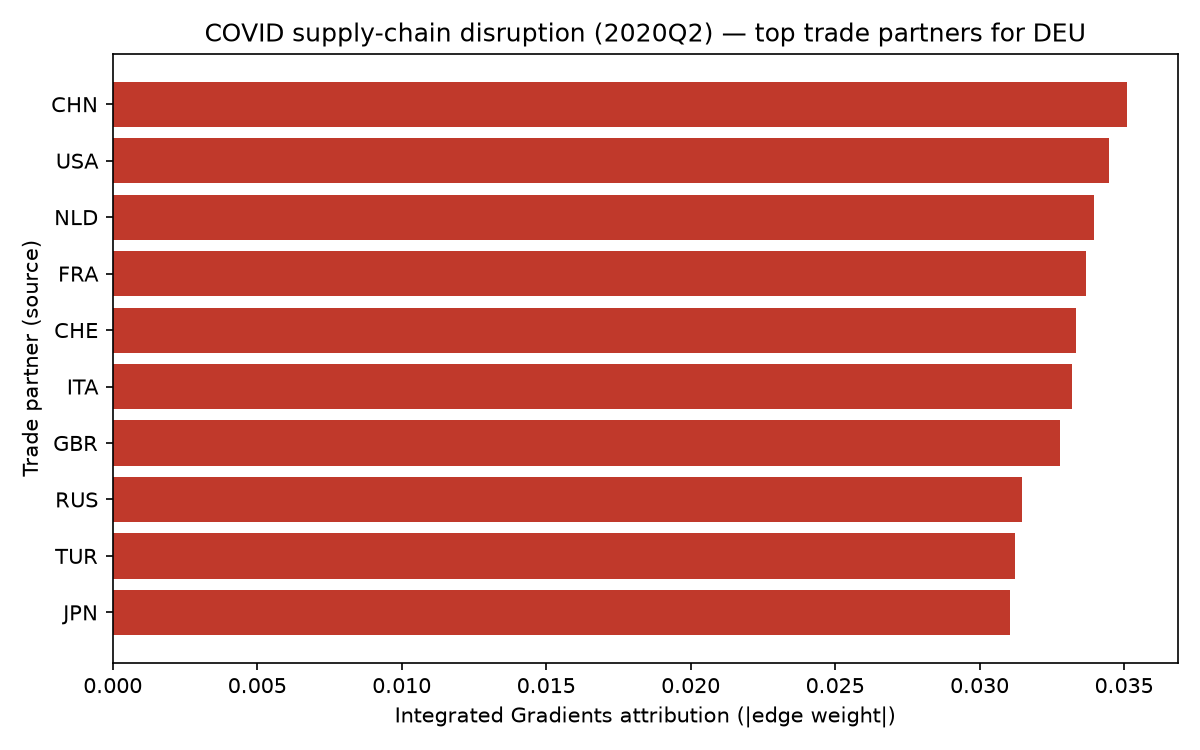
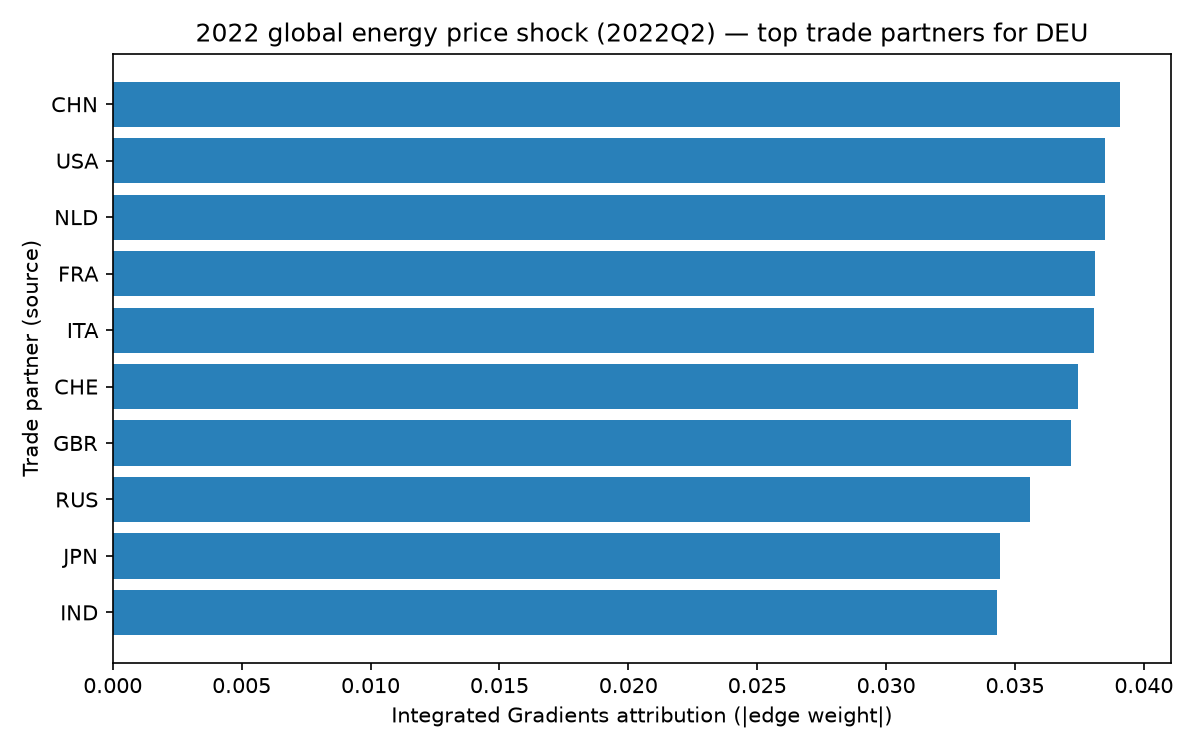
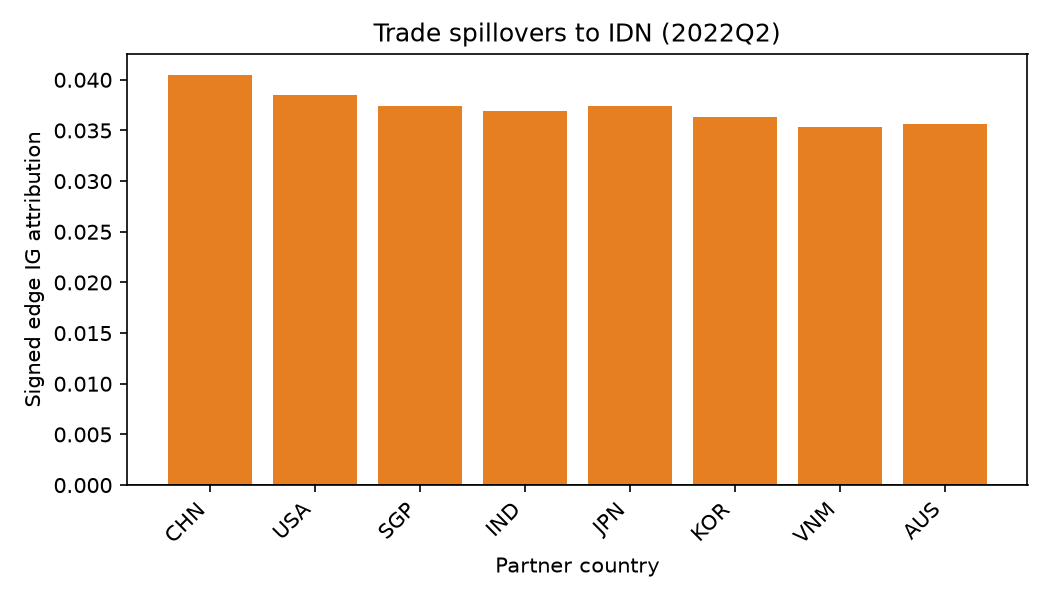
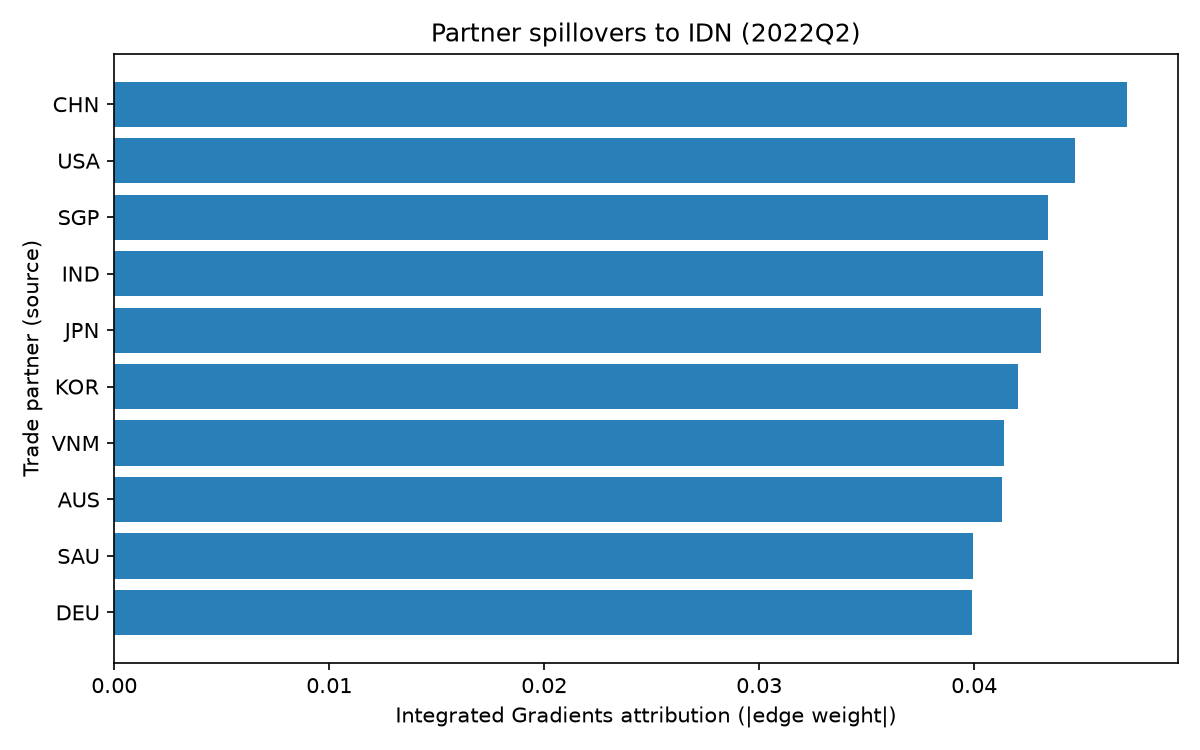
Beyond generating forecasts, the model also provides explanations for its predictions. Using Integrated Gradients, we analyze which trade relationships contribute most to each forecast.
For example, during the COVID supply-chain disruption and the 2022 energy crisis, the model identified China, the United States, and the Netherlands as important channels through which inflation pressures reached Germany.
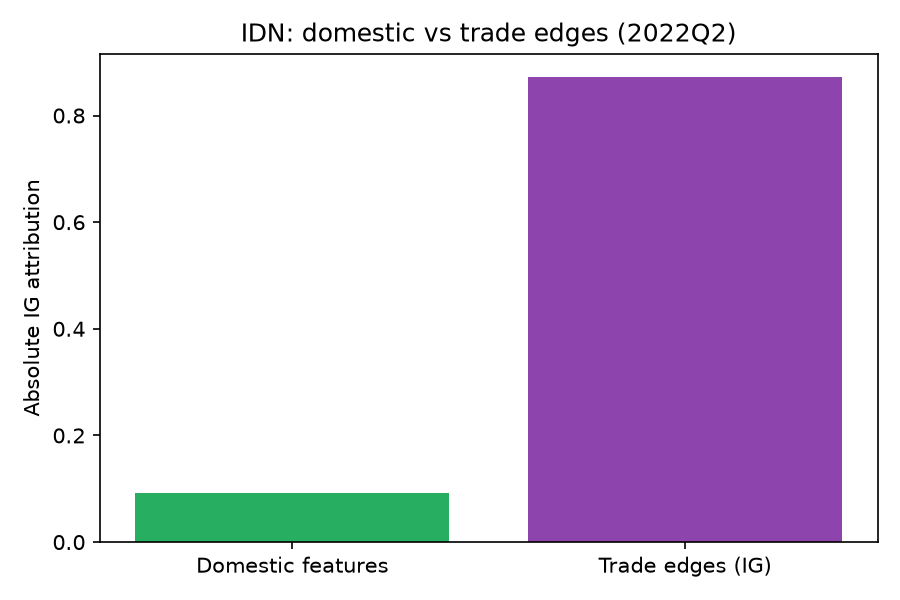
For Indonesia, the analysis showed that approximately 91% of the forecast signal came from trade-network exposure rather than domestic macroeconomic variables alone, resulting in the highest trade-to-domestic attribution ratio in the dataset.
How we built it
The model combines graph learning and time-series forecasting:
Graph construction: We used bilateral trade data from CEPII BACI to create quarterly trade networks. Trade values were log-transformed and converted into symmetric, normalized adjacency matrices.
Node features: Each country was represented using domestic CPI inflation, GDP growth, exchange rate changes, policy rates, global energy prices, and a COVID-period indicator.
Model architecture: A two-layer Graph Convolutional Network (GCN) processes each quarterly trade network. The resulting representations are passed through an LSTM over a four-quarter sequence to capture temporal patterns. A linear output layer predicts the inflation change, which is added to the current CPI through a persistence skip connection. This helped prevent the model from being dominated by extreme cases such as Argentina's hyperinflation.
Training: We used masked Huber loss, expanding-window rolling refits, and grid search optimization over learning rate, dropout, and model depth. The evaluation setup avoided look-ahead bias by retraining before each validation and test period.
Explainability: Integrated Gradients with 32 Riemann approximation steps were used to measure the contribution of trade relationships to individual forecasts.
Baselines: Performance was compared against country-level ARIMA(0,1,1) models and a panel VAR(4).
Challenges we encountered
One of the biggest challenges was handling extreme inflation events. Argentina's hyperinflation initially caused the model to focus excessively on outliers, leading to poor overall performance. Without additional safeguards, pooled RMSE exceeded 20 because the model was effectively learning Argentina's extreme behavior rather than general inflation dynamics.
Using Huber loss and the persistence skip connection significantly improved stability.
Another important finding was that the ST-GNN did not outperform traditional models in pure forecasting accuracy. The ST-GNN achieved an RMSE of 3.87 compared with ARIMA's 3.05 when Argentina was included, and 3.22 compared with 2.83 when excluding Argentina.
Rather than presenting this as a failure, we viewed it as an important result: the main contribution of the model is not necessarily better point forecasts, but the ability to reveal how inflation shocks propagate through trade networks.
The VAR baseline also faced scalability limitations when applied to the complete 23-country panel with all features, requiring removal of Argentina and the policy rate variable.
Due to computational limitations, we were unable to perform extensive multi-seed experiments or expand all robustness analyses, which remain important directions for future work.
Accomplishments we are proud of
One of our main goals was transparency. Instead of only reporting favorable results, we investigated where the model failed and supported our conclusions using statistical tests, including Diebold-Mariano and TOST equivalence tests.
The strongest outcome was producing interpretable inflation transmission pathways. Rather than simply predicting that inflation would increase, the model could identify which countries and trade relationships were contributing to the prediction.
We also developed a pipeline capable of handling a complex real-world dataset involving 23 countries, multiple macroeconomic variables, and changing trade networks.
What we learned
This project showed us that forecasting performance and scientific insight are not always the same thing.
A model can perform worse on RMSE while still revealing information that traditional methods cannot provide. ARIMA and VAR may indicate that inflation is changing, but they do not naturally explain which international relationships are responsible for the transmission.
We also learned that handling extreme events is not only a data problem. Model architecture and training choices, such as robust loss functions and skip connections, can determine whether a system learns meaningful patterns or simply memorizes unusual cases.
What's next
Future improvements include:
- Running multi-seed experiments to measure uncertainty in both forecasting performance and attribution rankings.
- Extending trade-spillover analysis beyond Germany to countries with high trade-attribution ratios, such as Indonesia.
- Incorporating directed trade networks and input-output relationships to create a more structural representation of global inflation transmission.
- Comparing the neural network approach against structural economic models based on input-output frameworks.


Log in or sign up for Devpost to join the conversation.