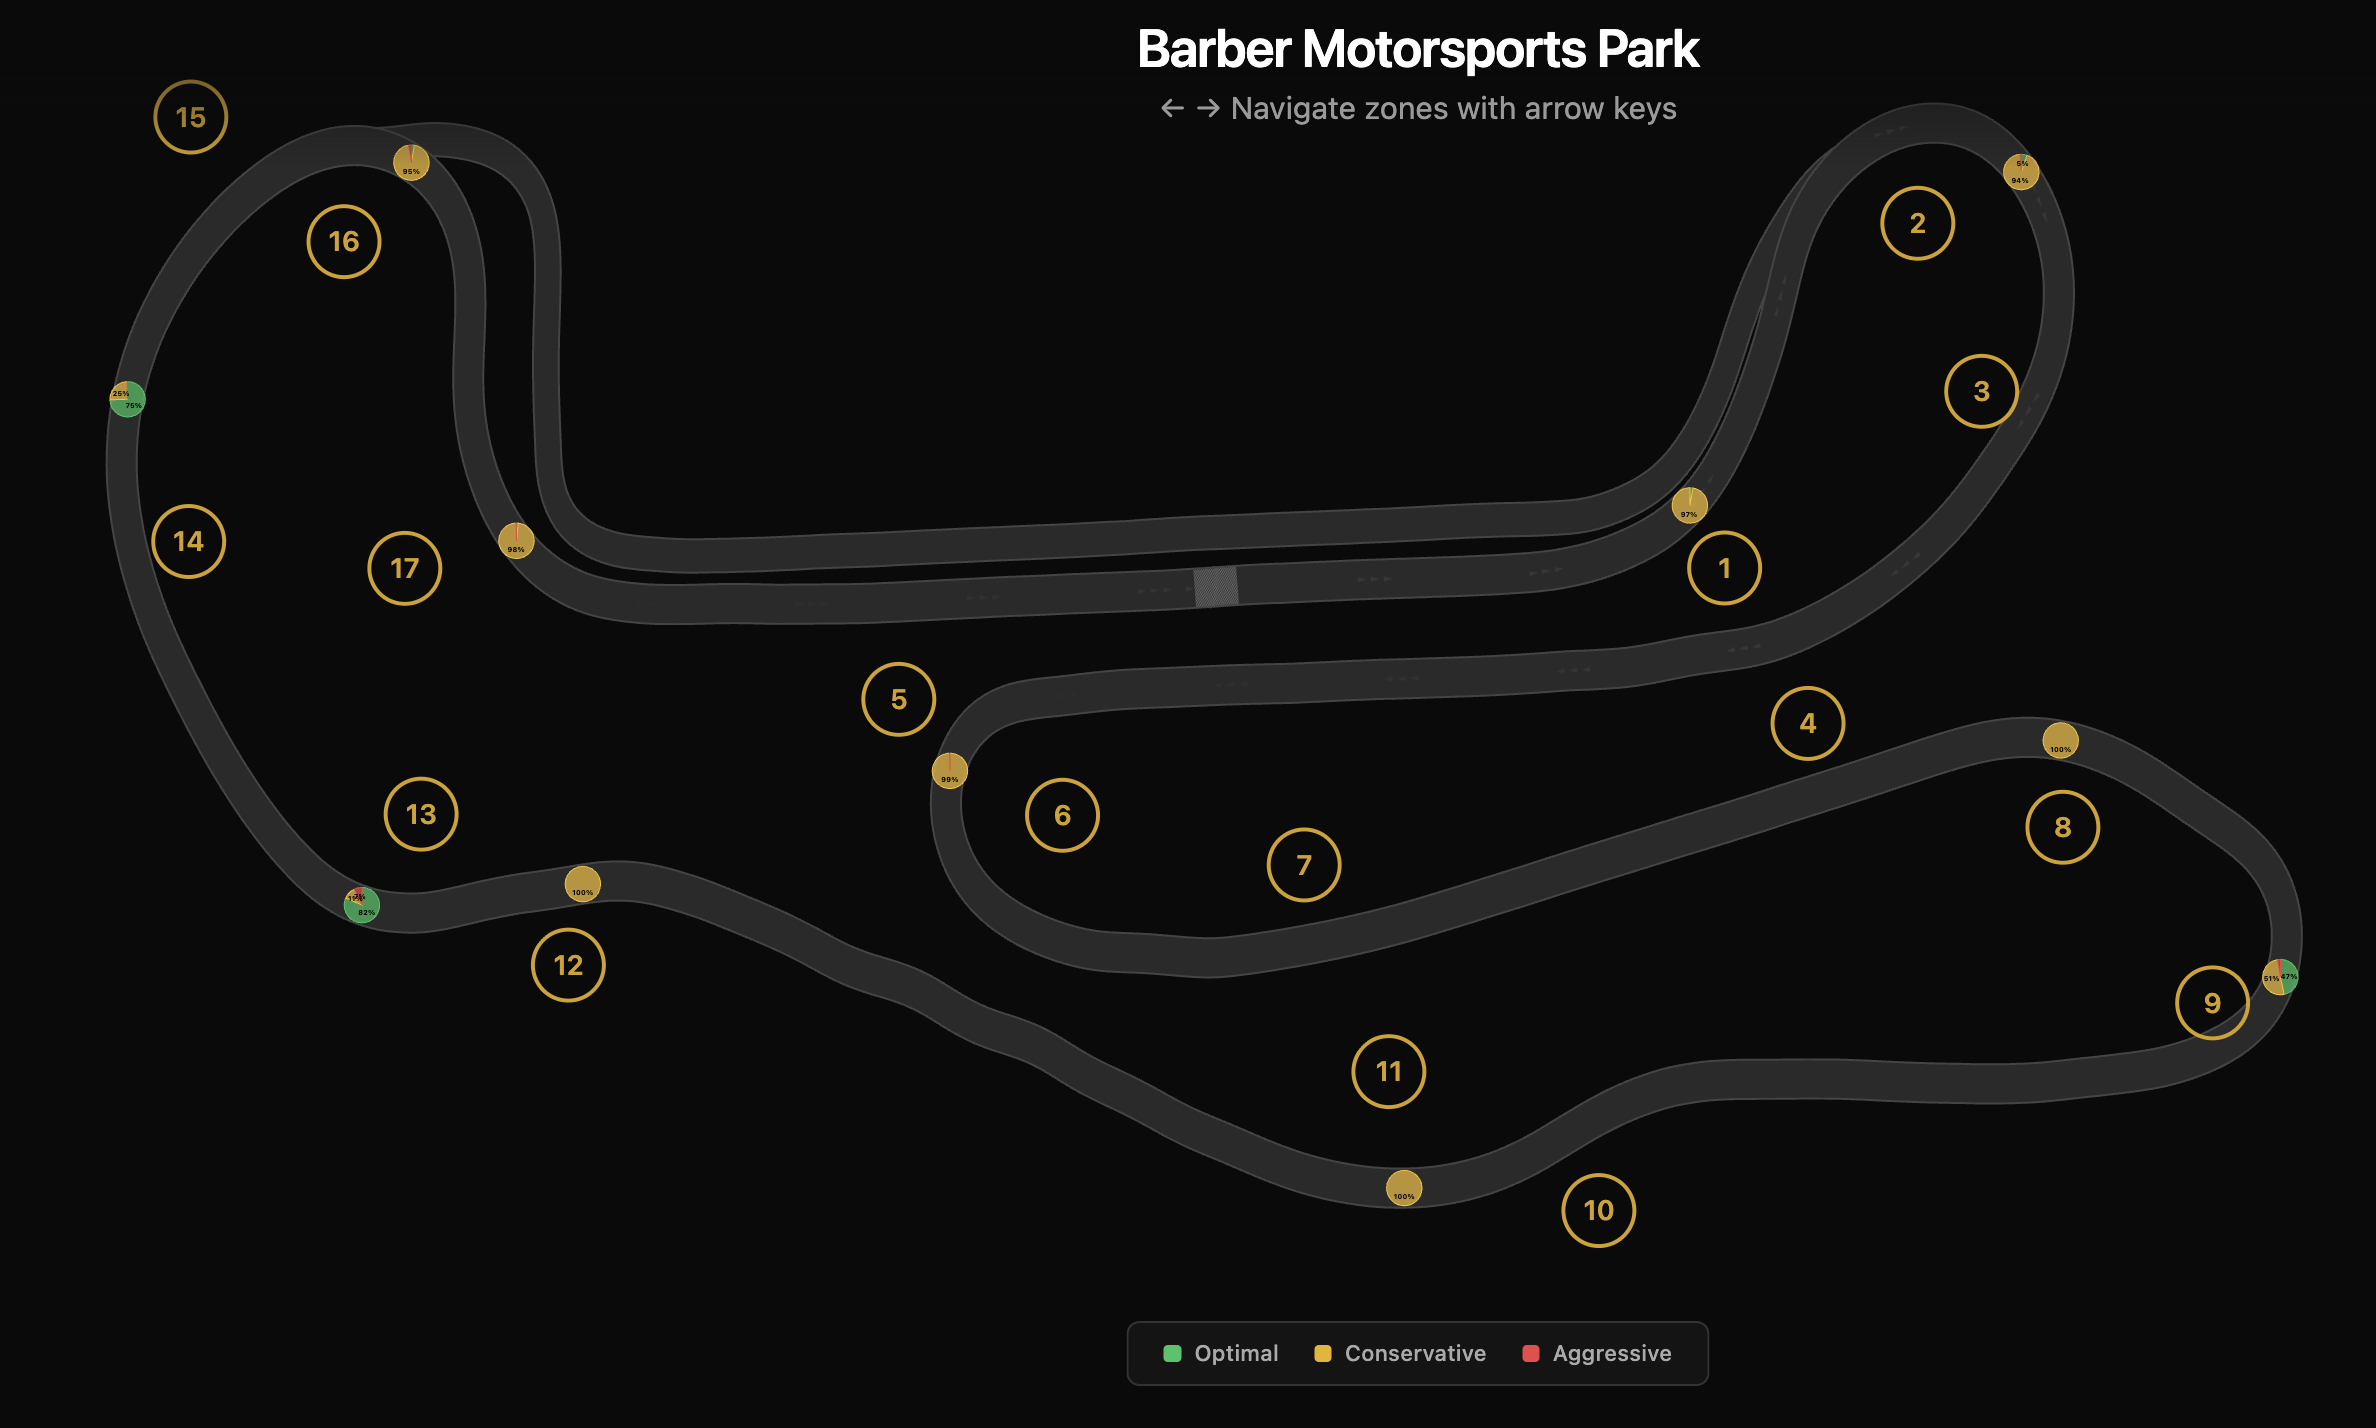
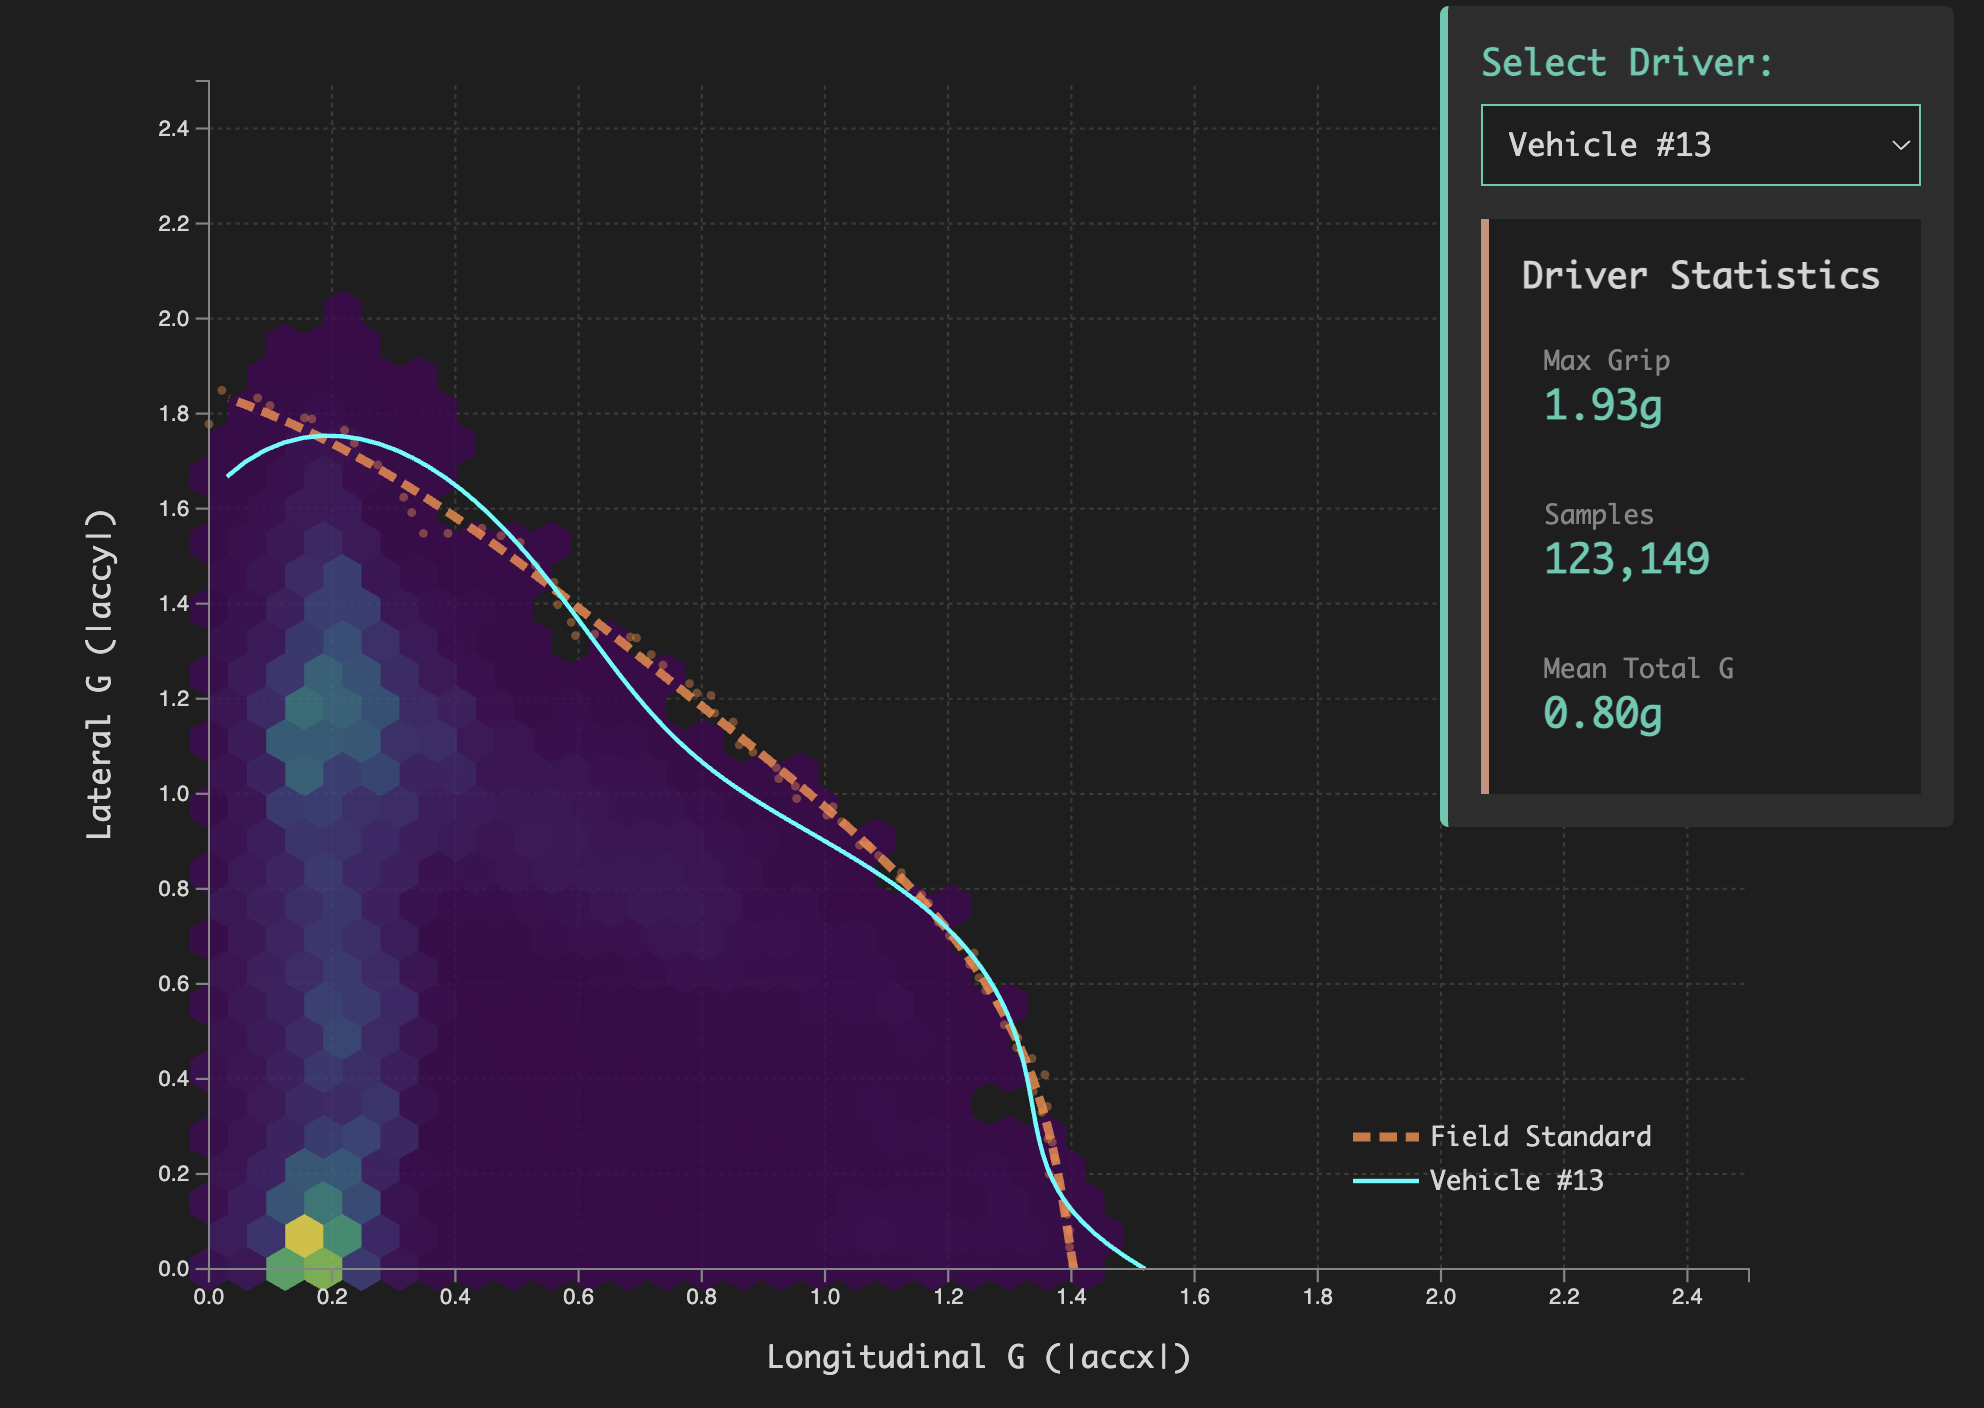
Inspiration Racing drivers often hear "push harder" or "you're leaving time on the table," but coaches rarely have the data to pinpoint exactly where and how much. We wanted to build a tool that translates the physics of tire grip into actionable coaching feedback—corner by corner, lap by lap. The friction circle concept fascinated us: tires have a fixed grip budget that can be spent on braking, acceleration, or cornering. Most drivers don't know how close they are to that limit. We realized that by analyzing telemetry data through this lens, we could identify precisely where drivers are too cautious (leaving speed on the table) versus too aggressive (fighting the car and losing time). What it does Traction Efficiency Analysis transforms raw telemetry into per-corner coaching insights. The tool: Automatically detects turn zones from GPS and g-force data—no manual track mapping required Builds personalized grip envelopes for each driver showing their maximum capability in every braking/cornering combination Classifies every corner as Conservative (underusing grip), Aggressive (wheelspin/understeer/oversteer), or Optimal (85%+ utilization, clean driving) Delivers actionable feedback: "Turn 3: you're using 68% of available grip—brake later and carry more speed" The interactive dashboard overlays classifications on a track map and visualizes friction circles, making complex physics digestible for drivers and coaches. Key finding: 78% of corners at Barber Motorsports Park are driven conservatively, with drivers leaving 20% more speed available by not fully trusting their tires. How we built it Core Algorithm: Track geometry: Auto-generated smooth racing line from GPS telemetry Turn zone detection: Identified 11 turn zones at Barber by clustering high lateral-g samples Friction envelopes: For each driver, built a personalized grip limit curve showing maximum capability at every steering/braking combination Utilization measurement: Compared actual g-forces to envelope limits, calculating what percentage of available grip each driver used Pattern classification: Detected wheelspin, understeer, and oversteer events to separate optimal driving from time-losing mistakes Visualization: Built an interactive dashboard with D3.js and Plotly showing track maps, friction circles, and driver comparisons. Deployed on GitHub Pages for easy access. Challenges we ran into Direction-aware envelopes: Initial implementation used a single "max g" threshold, which mislabeled corner entry/exit phases where drivers combine braking with turning. Solution: Built direction-aware envelopes that account for the friction circle's combined slip physics—measuring grip fairly at every throttle/brake/steering combination. Classification sensitivity: Early aggressive detection was too sensitive, flagging momentary slides as mistakes. Solution: Required sustained over-limit events (coverage + duration thresholds) to separate intentional car rotation from actual time-losing errors. Counterintuitive correlation: We expected higher grip utilization to correlate with better finishing positions, but found the opposite (r ≈ 0.20-0.24). This revealed that raw aggression doesn't win races—consistency and clean exits from key corners matter more. Accomplishments that we're proud of Track-agnostic pipeline: The entire system works on any circuit without manual corner labeling—just feed it telemetry Physics-driven insight: Moving beyond "driver X is faster" to "driver X uses 0.31g more in Turn 1—here's why" Actionable coaching tool: Delivered specific, quantified recommendations (e.g., "brake 10m later," "reduce throttle 10%") instead of vague advice Discovering the conservative pattern: Quantifying that 78% of corners show underutilization validated what coaches suspected but couldn't prove What we learned Domain insights: Entry/exit zones show optimal grip usage because drivers can brake hard on entry and throttle early on exit with less risk and bigger lap time gains Mid-turn (apex) is where drivers hold back because tires are already loaded laterally—adding brake/throttle triggers slides for minimal time gain Aggressive driving ≠ fast driving: The counterintuitive negative correlation between grip utilization and finishing position shows that consistency, clean exits, and strategic aggression matter more than raw speed Approach: Starting with physics principles (friction circle) and letting data define zones led to more meaningful classifications than trying to match pre-drawn track maps. What's next for Traction Efficiency in Curves Real-time mode: Stream telemetry and provide live coaching alerts ("You're leaving 0.2g in Turn 5 this lap") Lap-to-lap progression tracking: Show how utilization evolves during a race stint (tire degradation, fuel load, temperature) Partner with GR Cup teams: Validate coaching recommendations against actual lap time improvements Extend to other tracks: Confirm track-agnostic performance at COTA, Sebring, Road America Investigate conservative driving: Research why conservative patterns correlate with better finishes—tire preservation, consistency, or something else?
# Traction Efficiency in Curves
Most corners are driven too cautiously, making drivers leave speed on the table. I built a tool to show how much grip can be imbued on each corner based on each car's friction curves.

Updates

Leave feedback in the comments!
Log in or sign up for Devpost to join the conversation.