-
-
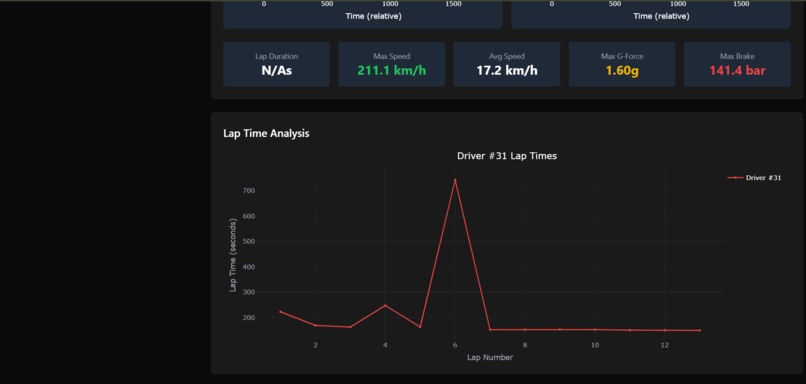
Lap time analysis
-

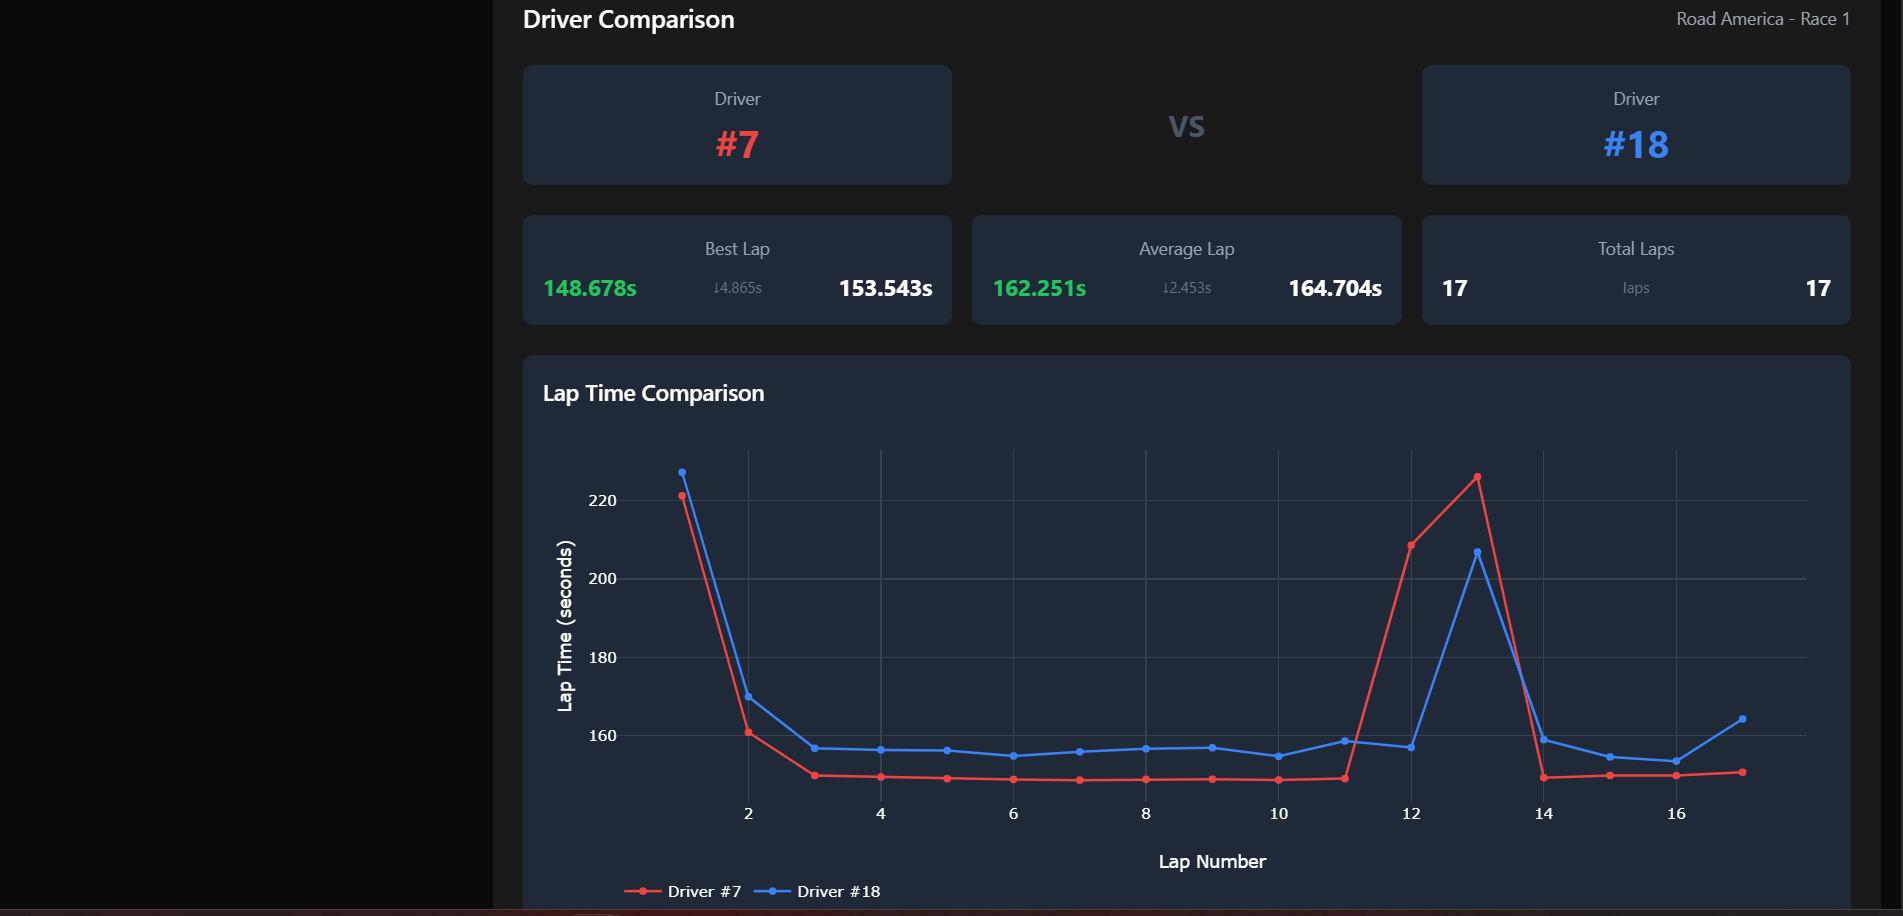
Comparison between drivers
-
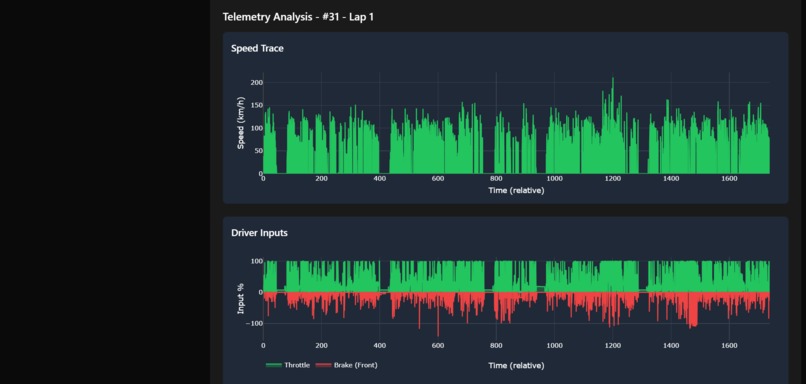
Speed trace and Driver Inputs
-
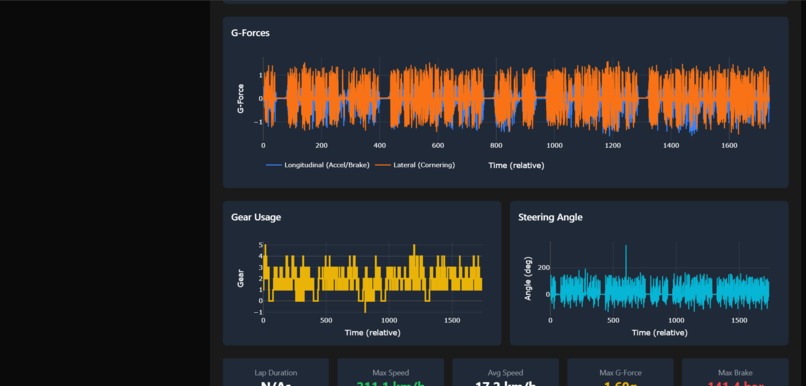
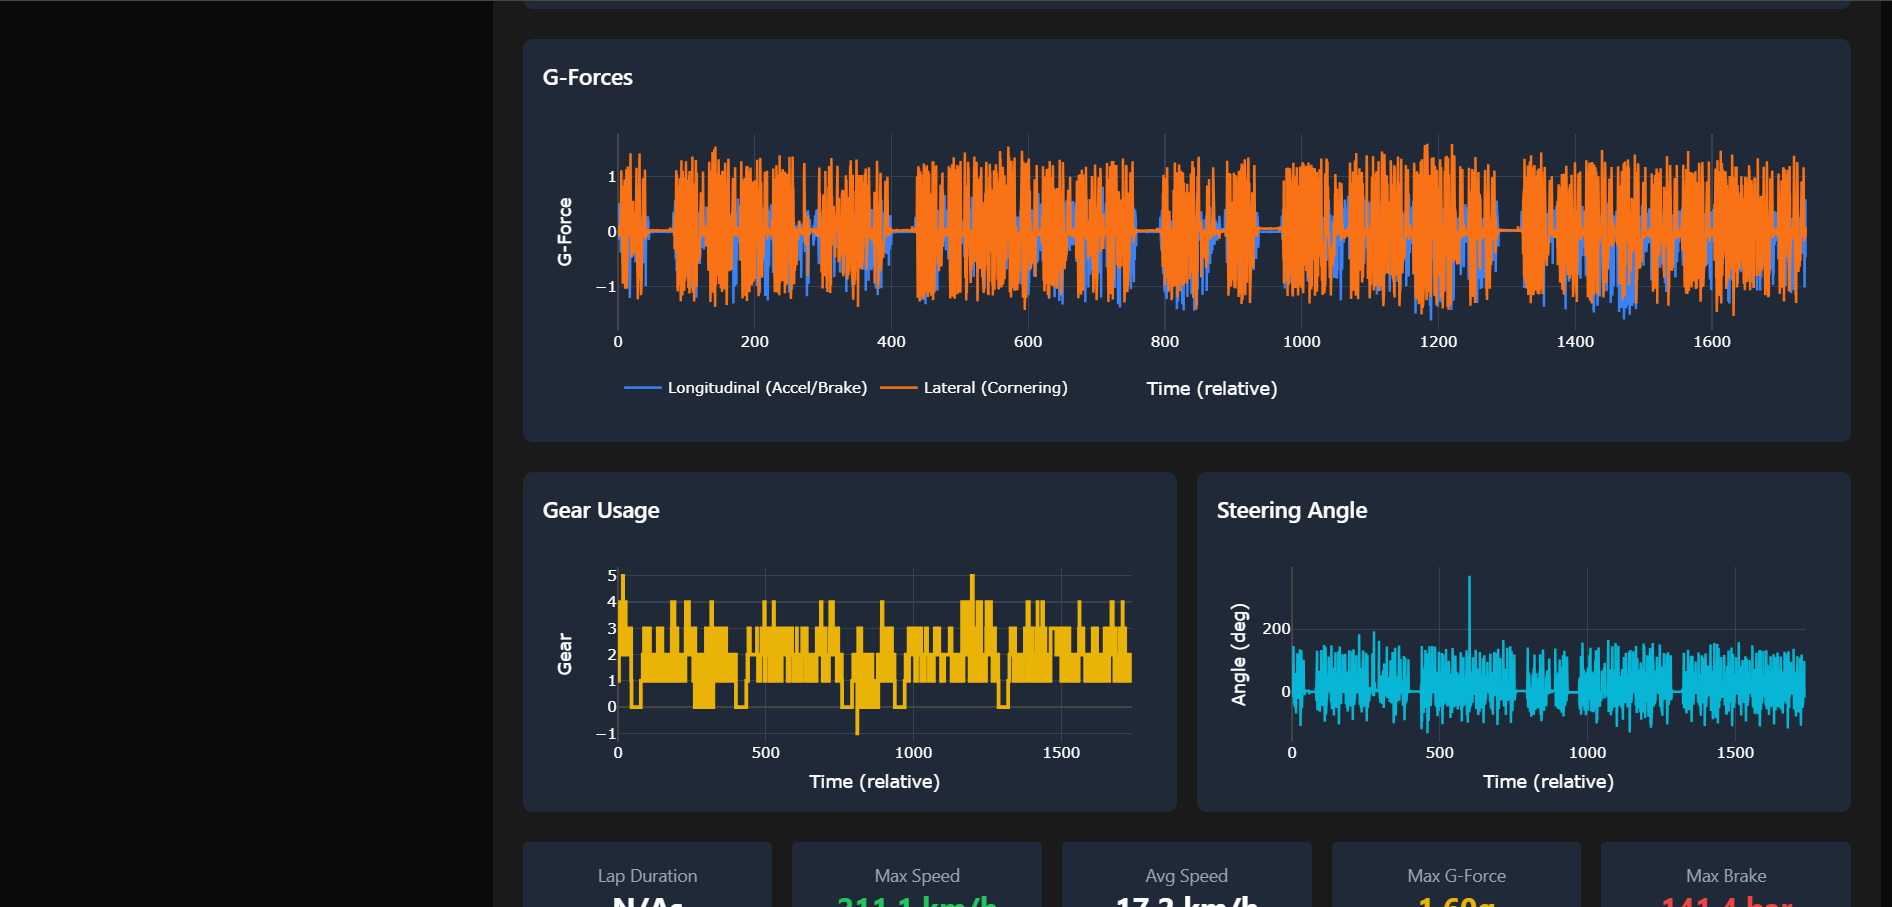
G forces, Gear usage and steering angle


Inspiration
As a racing enthusiast and AI student, I've always been fascinated by the intersection of motorsports and analytics. When I discovered the Hack the Track challenge with real Toyota GR Cup racing data, I saw an opportunity to build something that could genuinely help racing teams make better decisions. I wanted to create a platform that transforms raw telemetry data into actionable insights - revealing where drivers gain or lose time, when to pit, and how to optimize performance lap by lap.
What it does
TrackTelemetry is a comprehensive F1 racing analytics platform that transforms raw telemetry data into actionable insights for racing teams. The platform provides:
- Race Overview Dashboard: View all races, sessions, and drivers with detailed statistics
- Lap Time Analysis: Compare lap times across drivers with interactive visualizations
- Telemetry Visualization: Analyze speed, throttle, brake, RPM, and G-forces lap-by-lap
- Driver Comparison: Side-by-side performance analysis to identify competitive advantages
- Pit Strategy Engine: Real-time recommendations for optimal pit stop timing
- Track Maps: Visual representation of circuit layouts with sector information
- Data Export: Download analysis results for further processing
The platform processes 2.5GB+ of high-frequency telemetry data (10Hz+ sampling) and presents it through an intuitive, racing-themed interface.
How I built it
Architecture: Full-stack application with Python FastAPI backend and React + TypeScript frontend
Backend (Python + FastAPI):
- REST API serving race data, telemetry, and analytics
- Data processing pipeline with Pandas/NumPy for handling 2.5GB+ datasets
- Intelligent caching system (256MB) for performance optimization
- Real-time pit strategy engine
- PDF to PNG conversion for track maps
Frontend (React + TypeScript):
- Built with extensive assistance from Kiro AI (I had minimal frontend experience)
- 20+ modern React components with TypeScript
- Interactive visualizations using Plotly.js
- State management with React Context API
- Racing-themed UI with TailwindCSS
Data Pipeline: Raw CSV Data → Pandas Processing → Data Cleaning → Caching → REST API → Frontend → Plotly Visualization
Deployment:
- Dataset hosted on AWS S3 (automatic download on deployment)
- Backend deployed on Railway
- Frontend built with Vite
Challenges I ran into
1. Massive Dataset Size (~20 GB)
The dataset was too large for GitHub (100MB limit) and manual analysis was impossible - files crashed Excel and text editors. Loading times initially took 30-60 seconds per API call. Solution: Uploaded to AWS S3, implemented intelligent caching, data sampling during initial phase (95% payload reduction), and pandas chunking.
2. Telemetry API Driver Filtering Bug
The telemetry API was returning data for ALL drivers on a lap instead of filtering by the selected driver, causing overlapping data on graphs. I discovered this late during testing because manual file inspection was impossible due to file sizes. Status: Attempted fix implemented but not fully tested due to time constraints.
3. Vercel Deployment Black Screen
Frontend deployed successfully but showed only a black screen. Encountered TypeScript build errors, environment variable issues, and suspected CORS problems. Status: Backend works perfectly on Railway, but frontend deployment remains incomplete due to submission deadline. Still am going to submit the link and work to fix it later
4. Memory Management
Loading all data consumed 4-5GB RAM, causing laptop crashes. At one point, I set cache to 2GB and my laptop froze completely. Solution: Implemented smart caching strategies and data sampling. And also extended my RAM ;)
Accomplishments that I am proud of
- Learned Frontend Development: Built a professional React + TypeScript application with Kiro AI's help, despite having minimal frontend experience
- Handled Real-World Scale: Successfully processed and visualized 19 GB+ of high-frequency telemetry data
- Built Complete Analytics Platform: Created a full-stack application with 8+ major features in a short timeframe
- Deployed to Production: Successfully deployed backend to Railway with AWS S3 integration
- Created Actionable Insights: Transformed raw data into meaningful racing strategy recommendations
- Persevered Through Challenges: Overcame dataset size limitations, deployment issues, and technical bugs
- Professional Documentation: Created comprehensive guides for setup, deployment, and usage
What I learned
Technical Skills
- Frontend Development: React, TypeScript, Plotly.js, TailwindCSS, Context API (with Kiro AI assistance)
- Backend Development: FastAPI, efficient Pandas operations at scale, caching strategies
- Data Engineering: Working with massive datasets, memory management, performance optimization
- Cloud Deployment: AWS S3 configuration, Railway deployment, environment management, CORS handling
Key Lessons
- Manual analysis is impossible at scale - Files too large for traditional tools forced me to build proper data pipelines
- Performance matters from day one - Dataset size made optimization critical, not optional
- Testing is crucial - The telemetry bug taught me to thoroughly test data structure assumptions
- Deploy early - Waiting until the end to deploy caused time pressure during submission
- AI assistance accelerates learning - Kiro AI helped me build frontend features that would have taken months to learn independently
What's next for TrackTelemetry
Immediate Fixes
- Fix Telemetry Driver Filtering: Complete testing and verification of the driver filter fix
- Resolve Vercel Deployment: Debug the black screen issue and get frontend fully deployed
- Performance Optimization: Further reduce loading times with better caching strategies
Feature Enhancements
- Real-time Race Monitoring: Live telemetry streaming during races
- Machine Learning Predictions: Predict optimal lap times and pit strategies using historical data
- Advanced Driver Comparison: Multi-driver overlay with statistical analysis
- Sector-by-Sector Analysis: Detailed performance breakdown by track sectors
- Weather Integration: Correlate performance with weather conditions
- Mobile App: Native mobile experience for trackside analysis
- Team Collaboration: Multi-user features for racing teams
Long-term Vision
Transform TrackTelemetry into a comprehensive racing analytics platform used by professional teams to gain competitive advantages through data-driven insights.


Log in or sign up for Devpost to join the conversation.