-
-
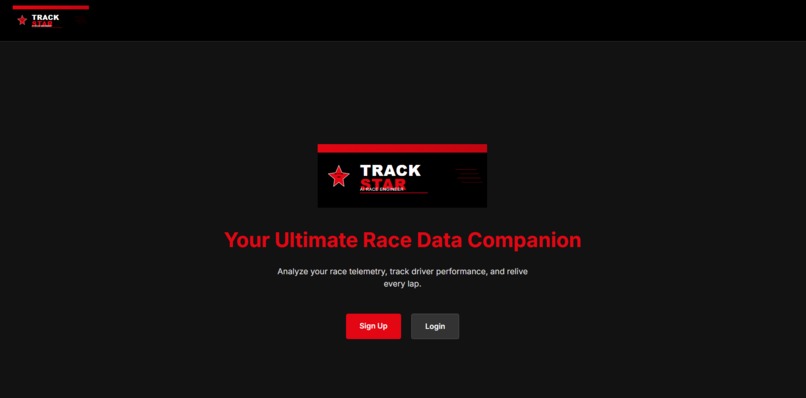
Home Page
-
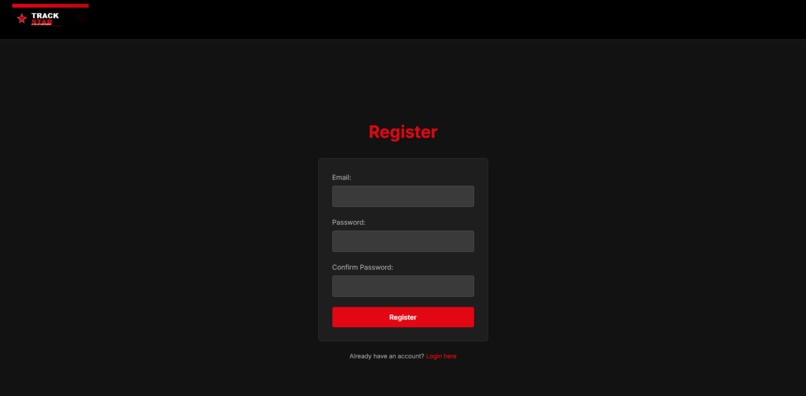
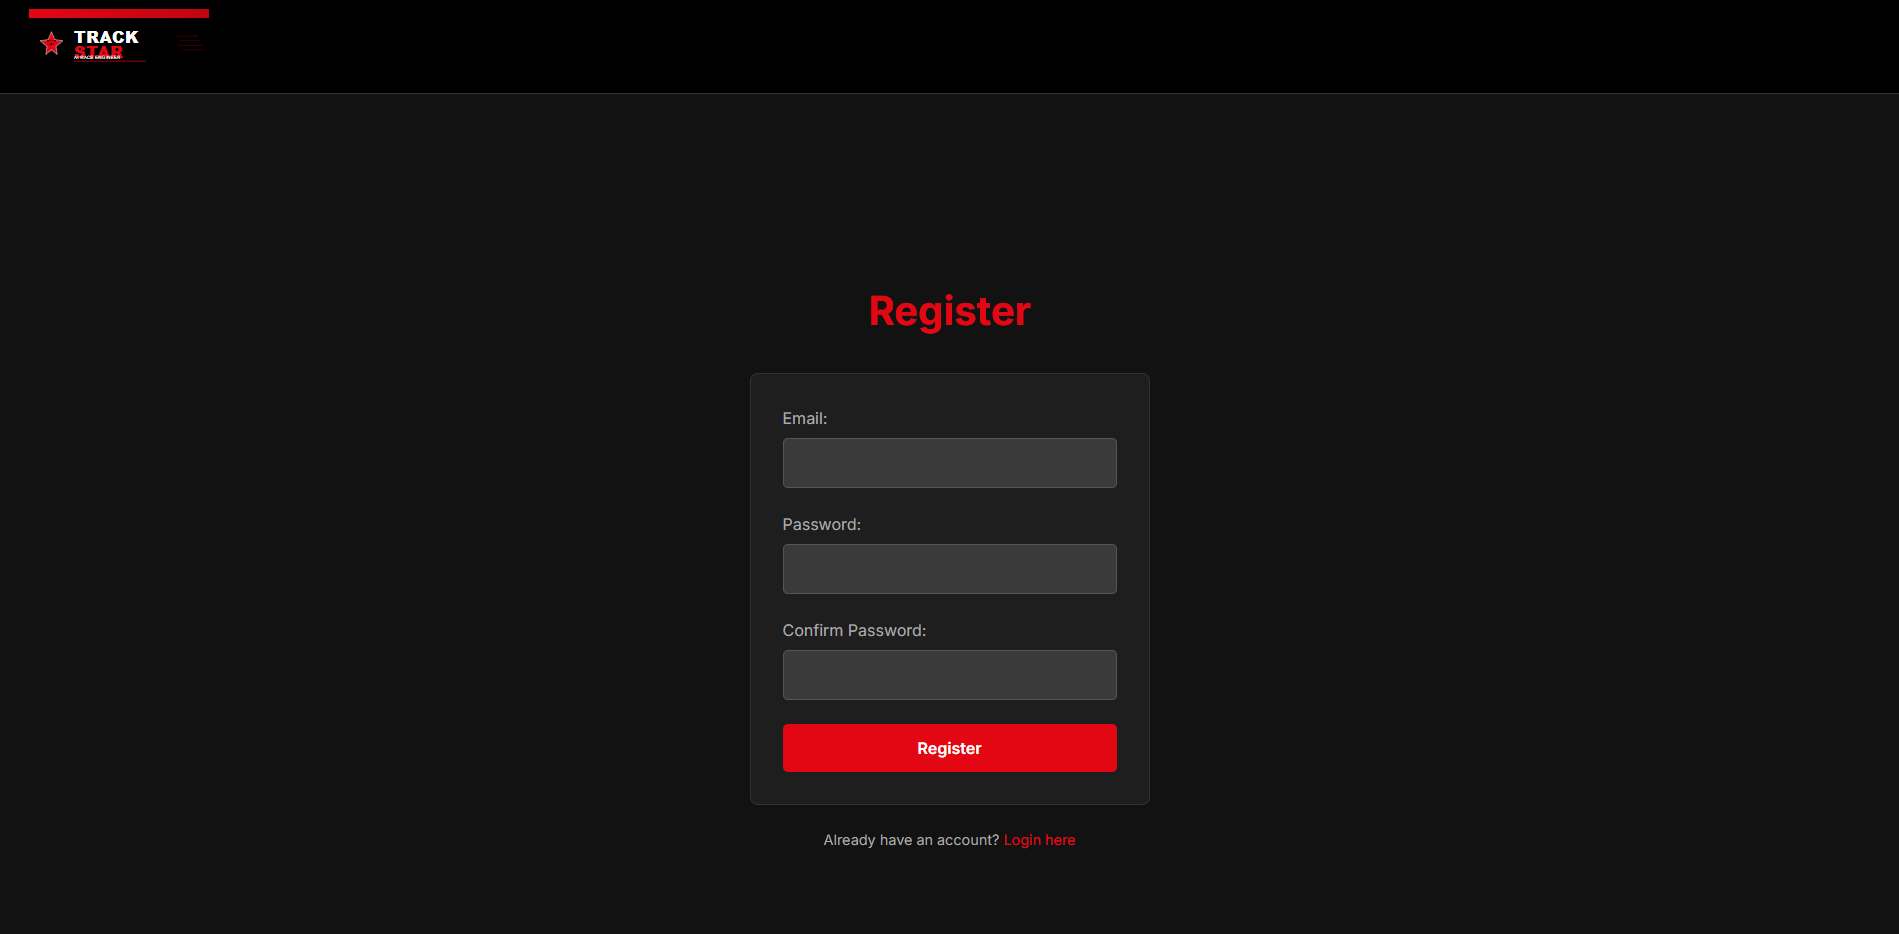
Register Screen
-
Login Screen
-
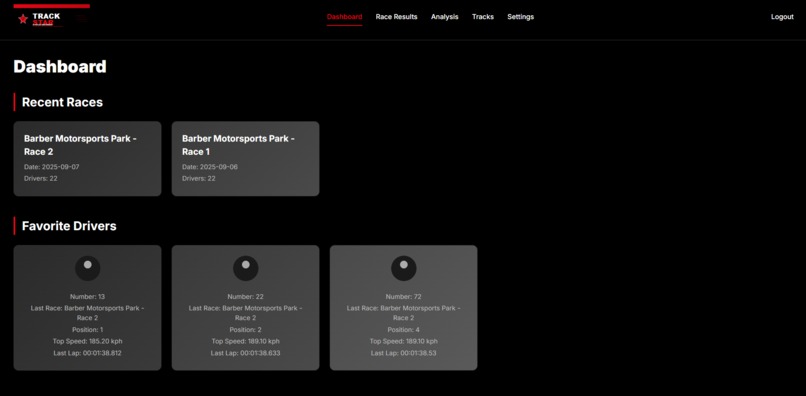
Dashboard
-
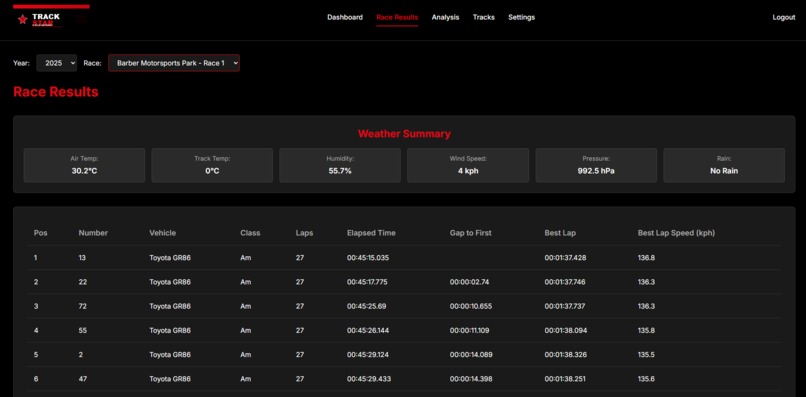
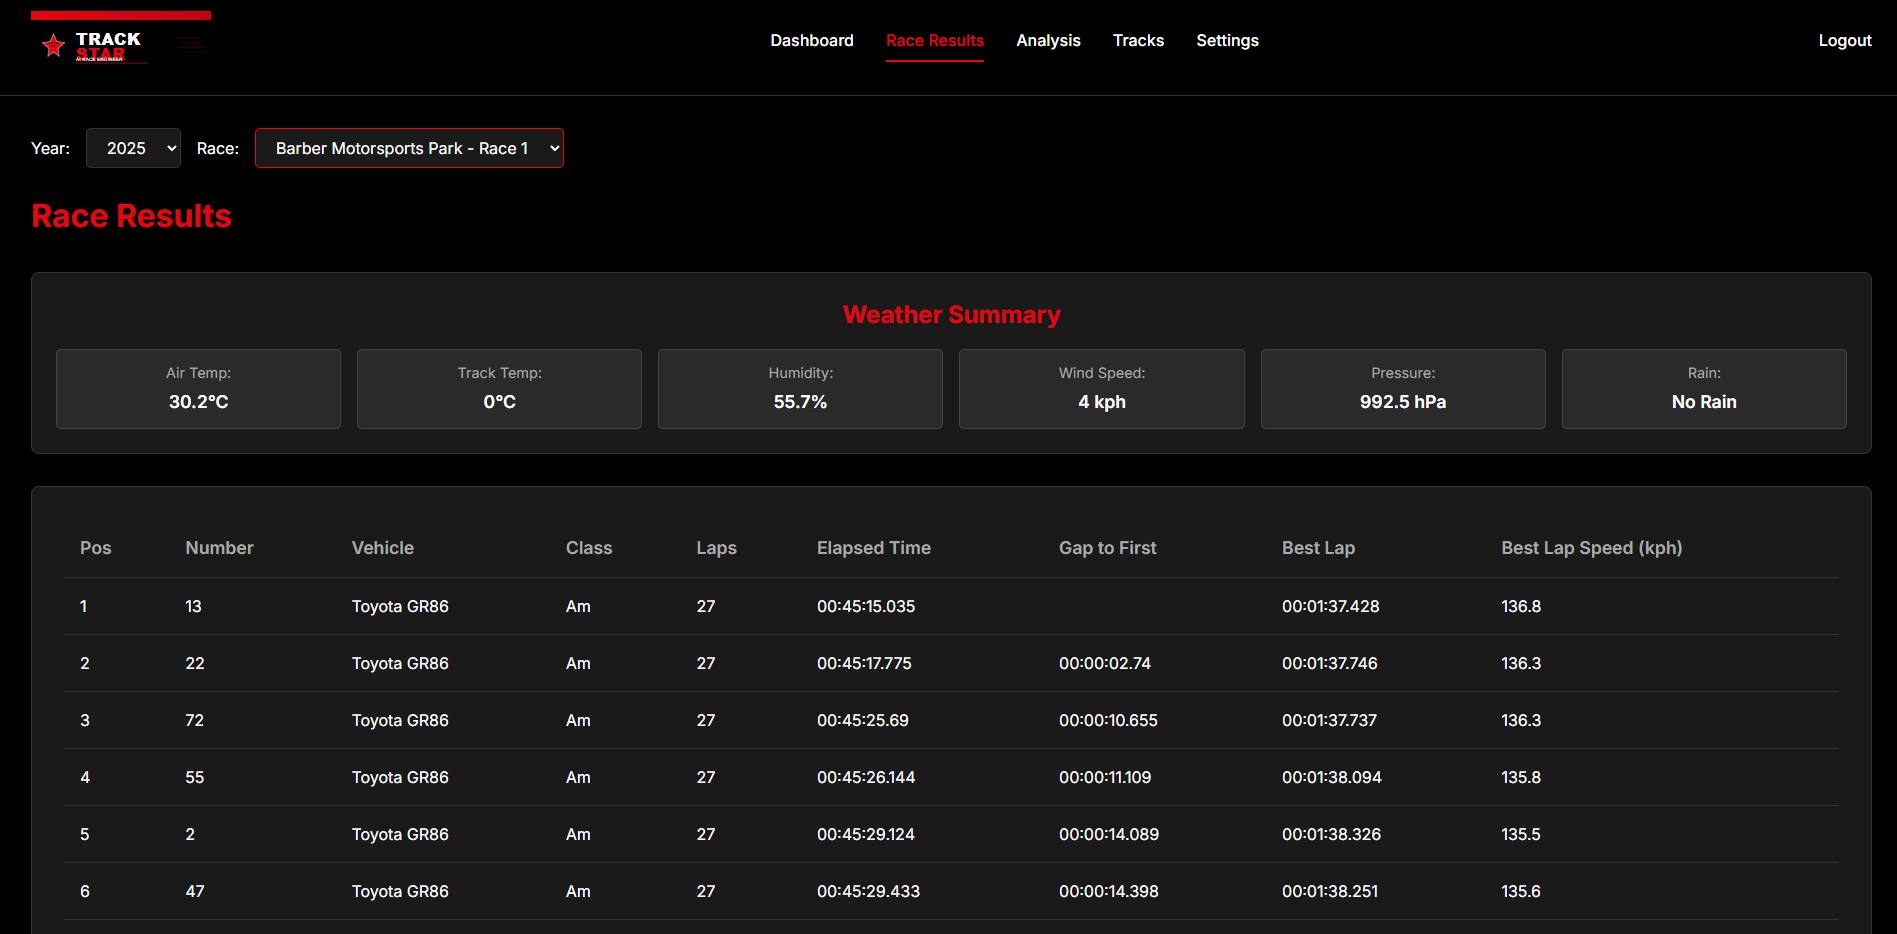
Race Results
-

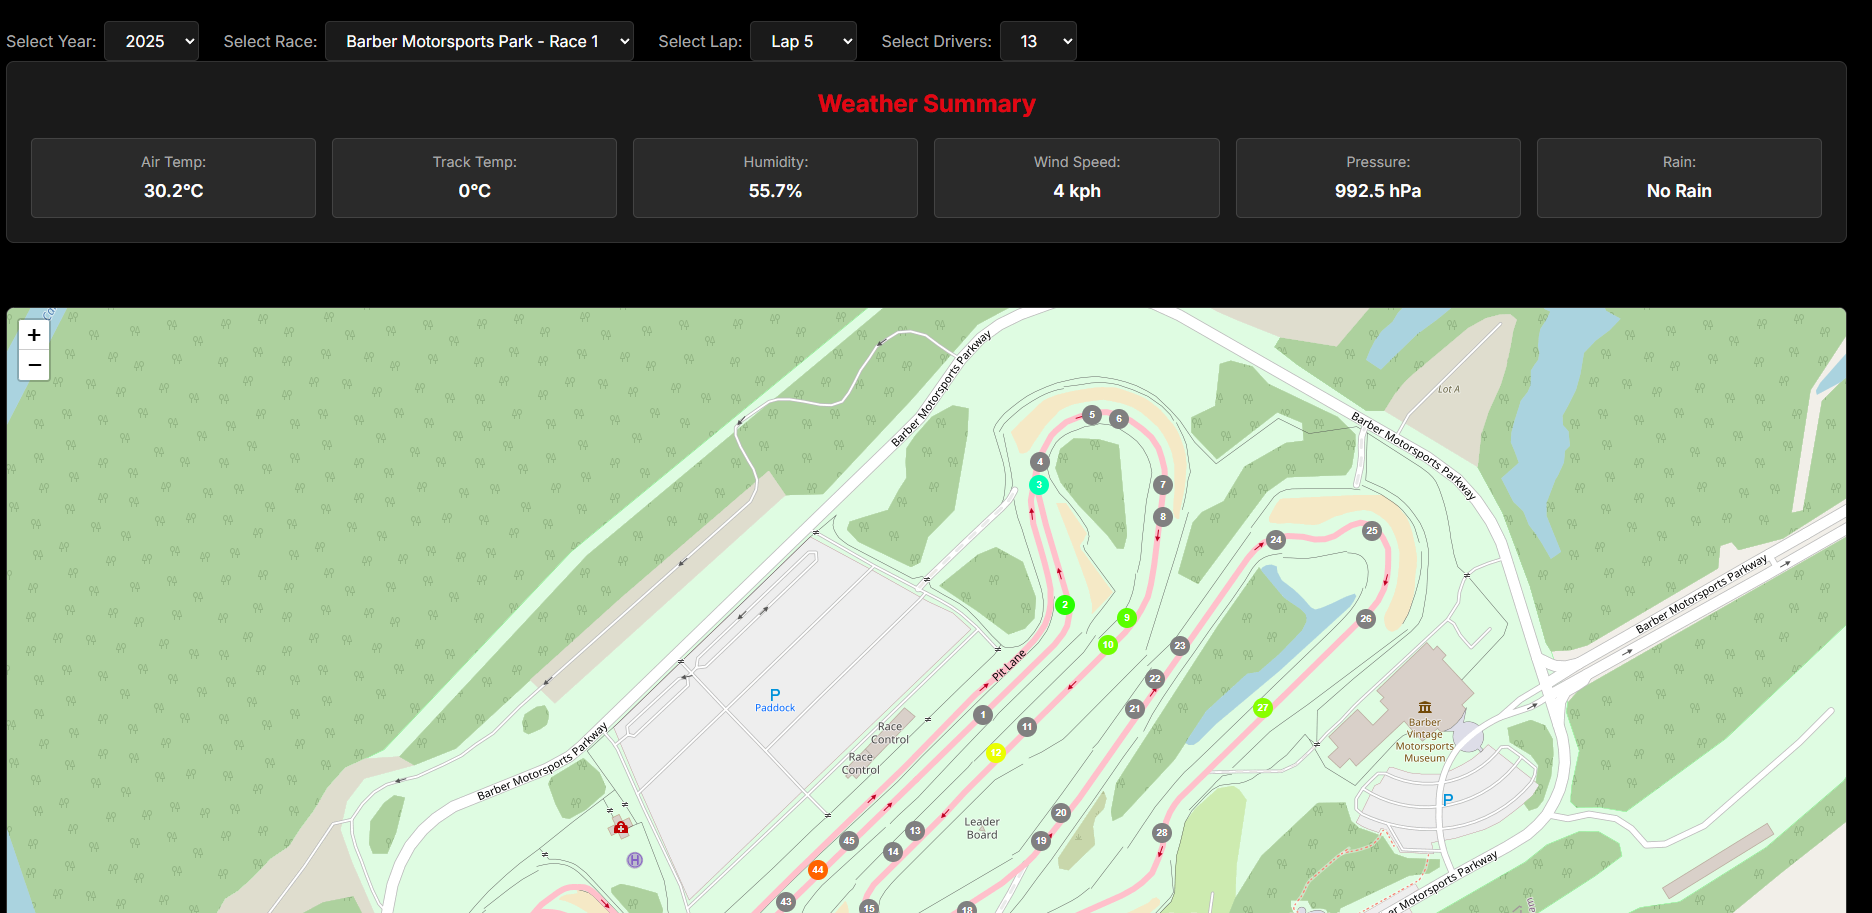
Analytics Screen Map
-
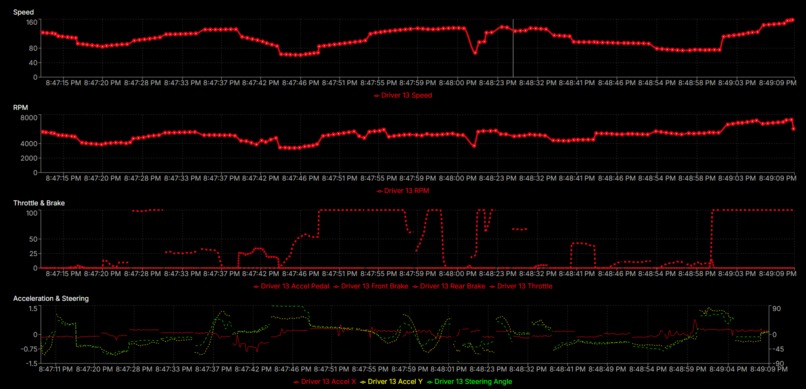
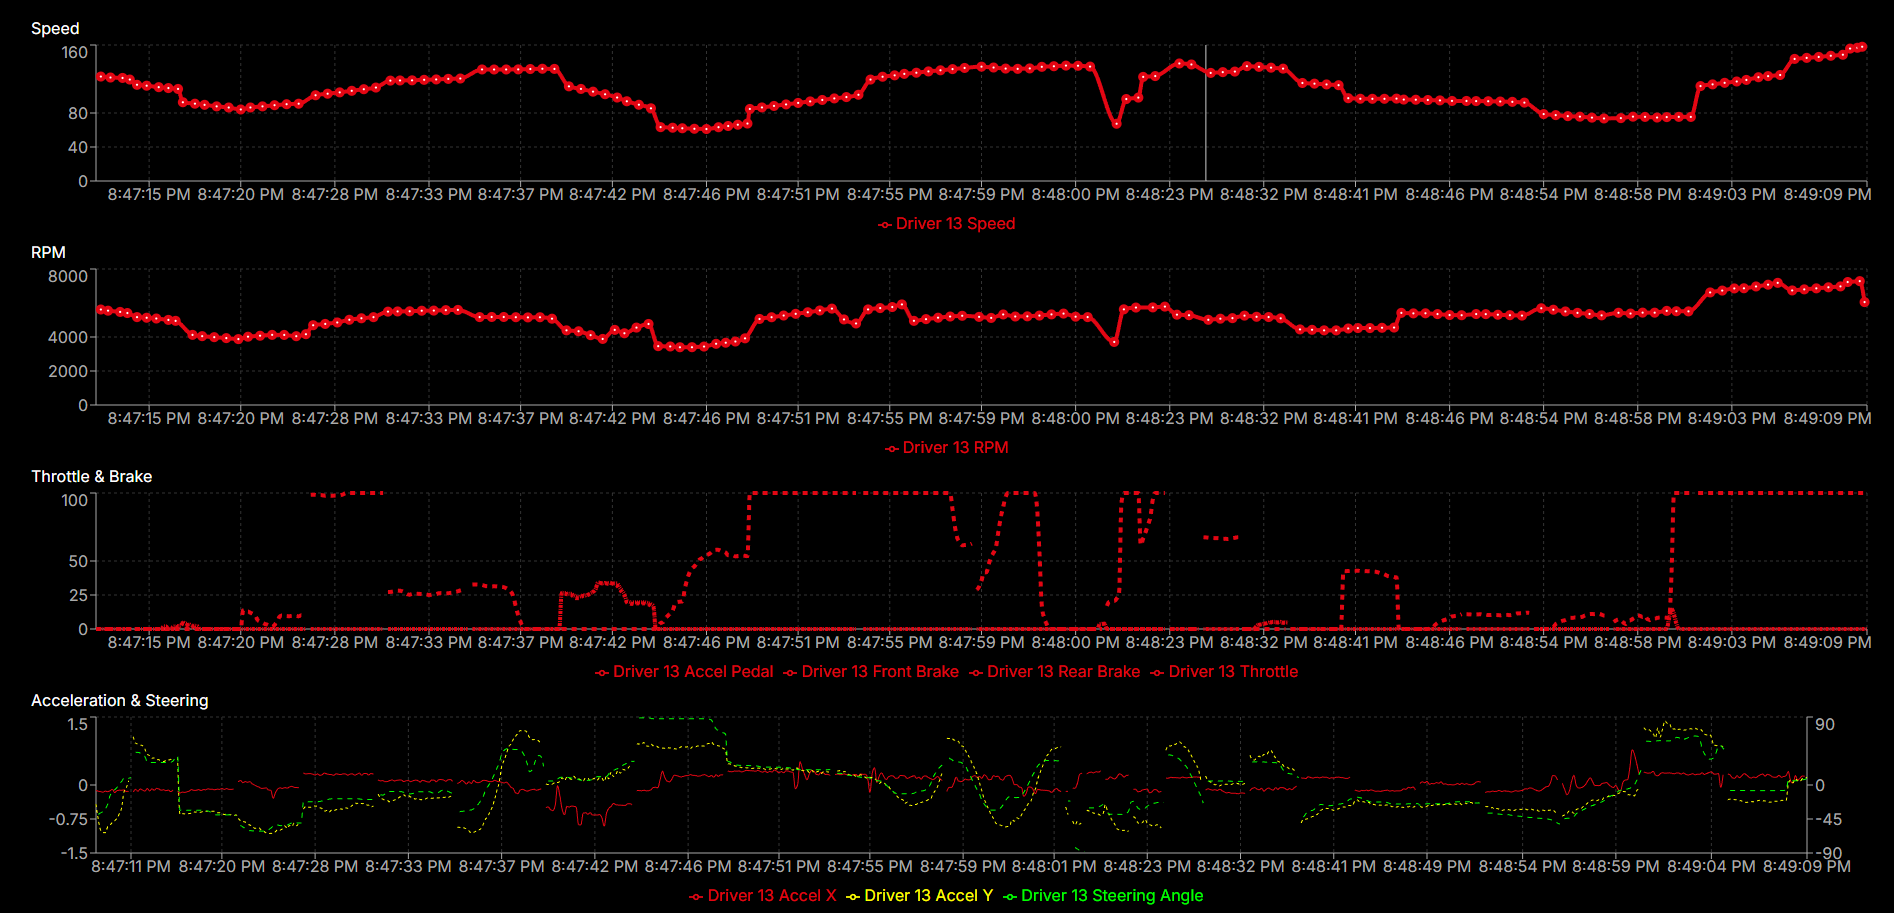
Analyics Screen Charts
-
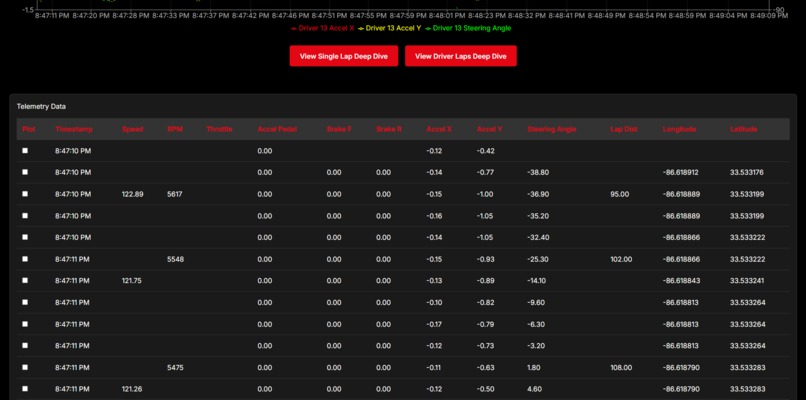
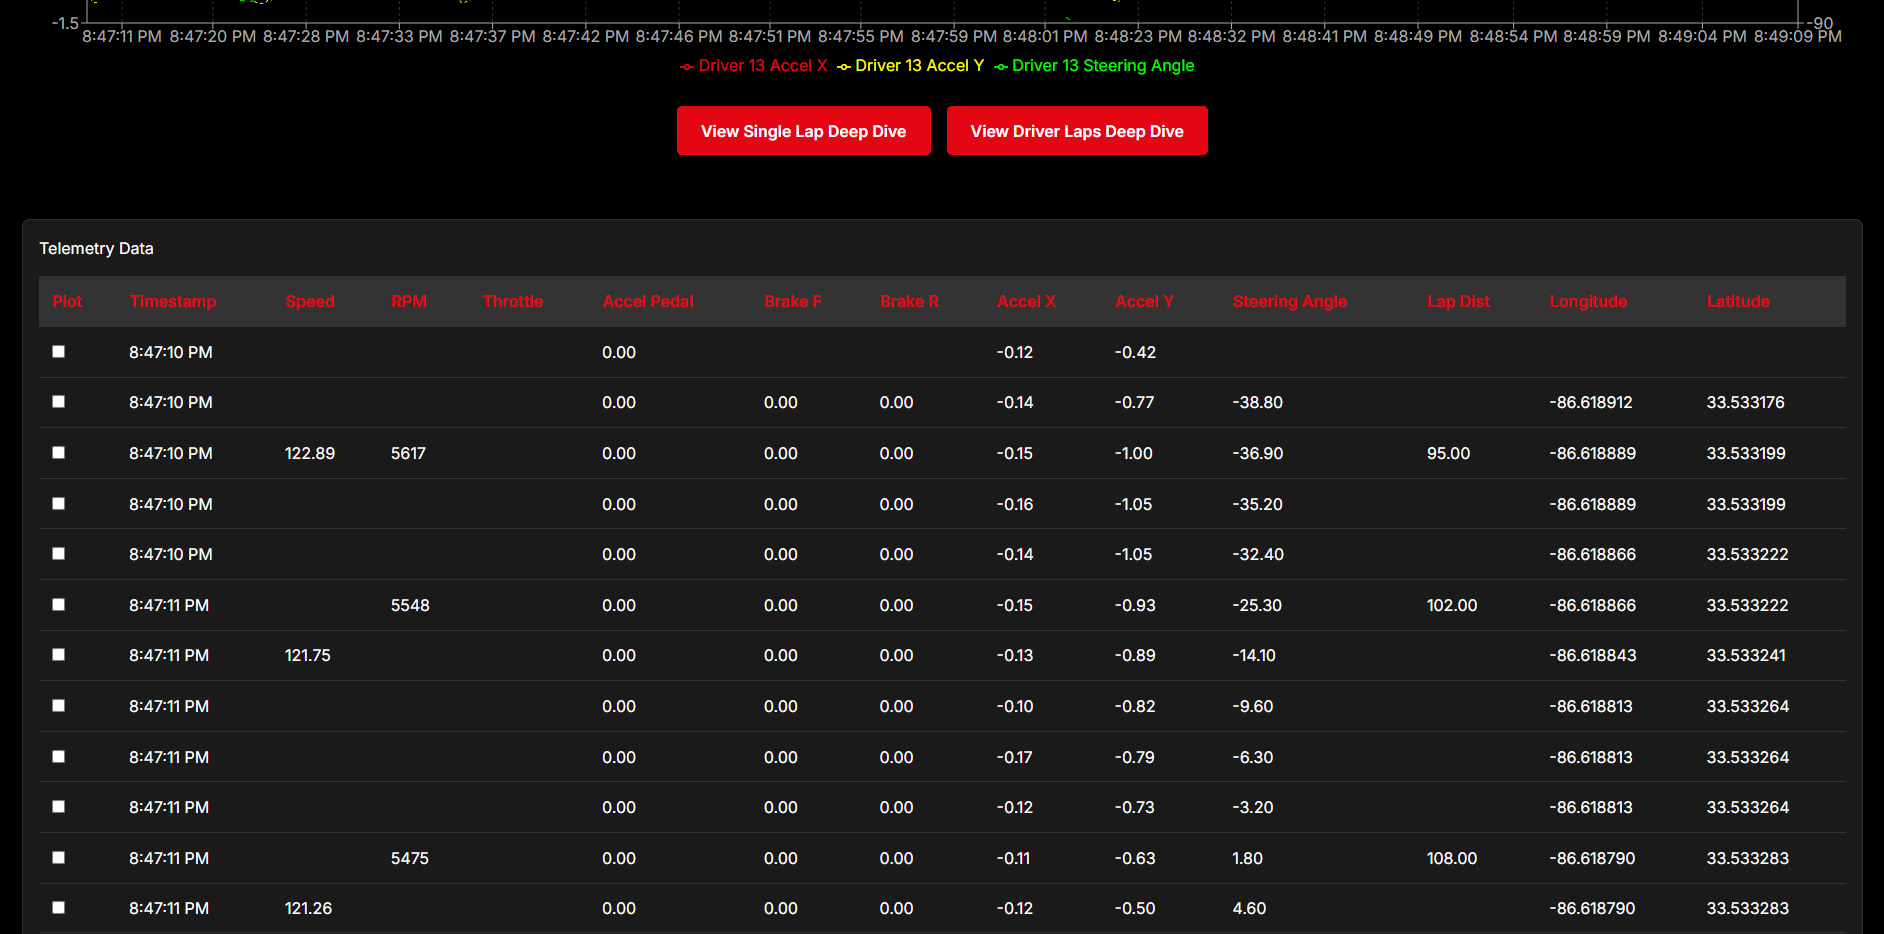
Analytics Screen Telemetry Data
-
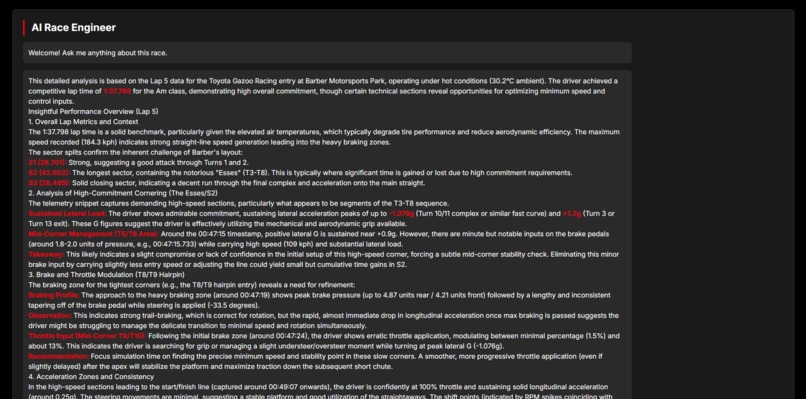
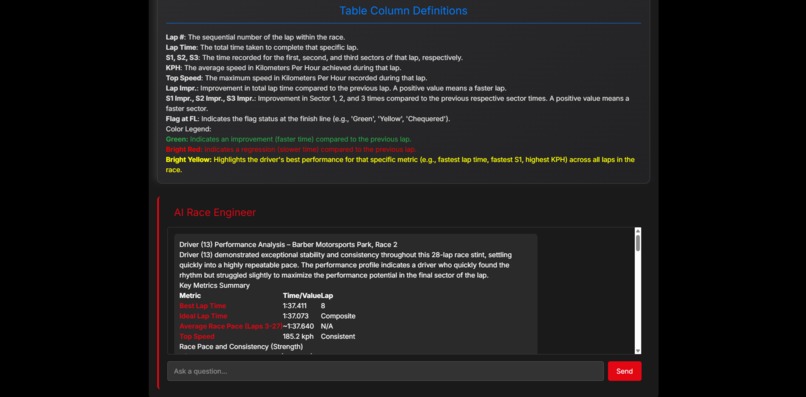
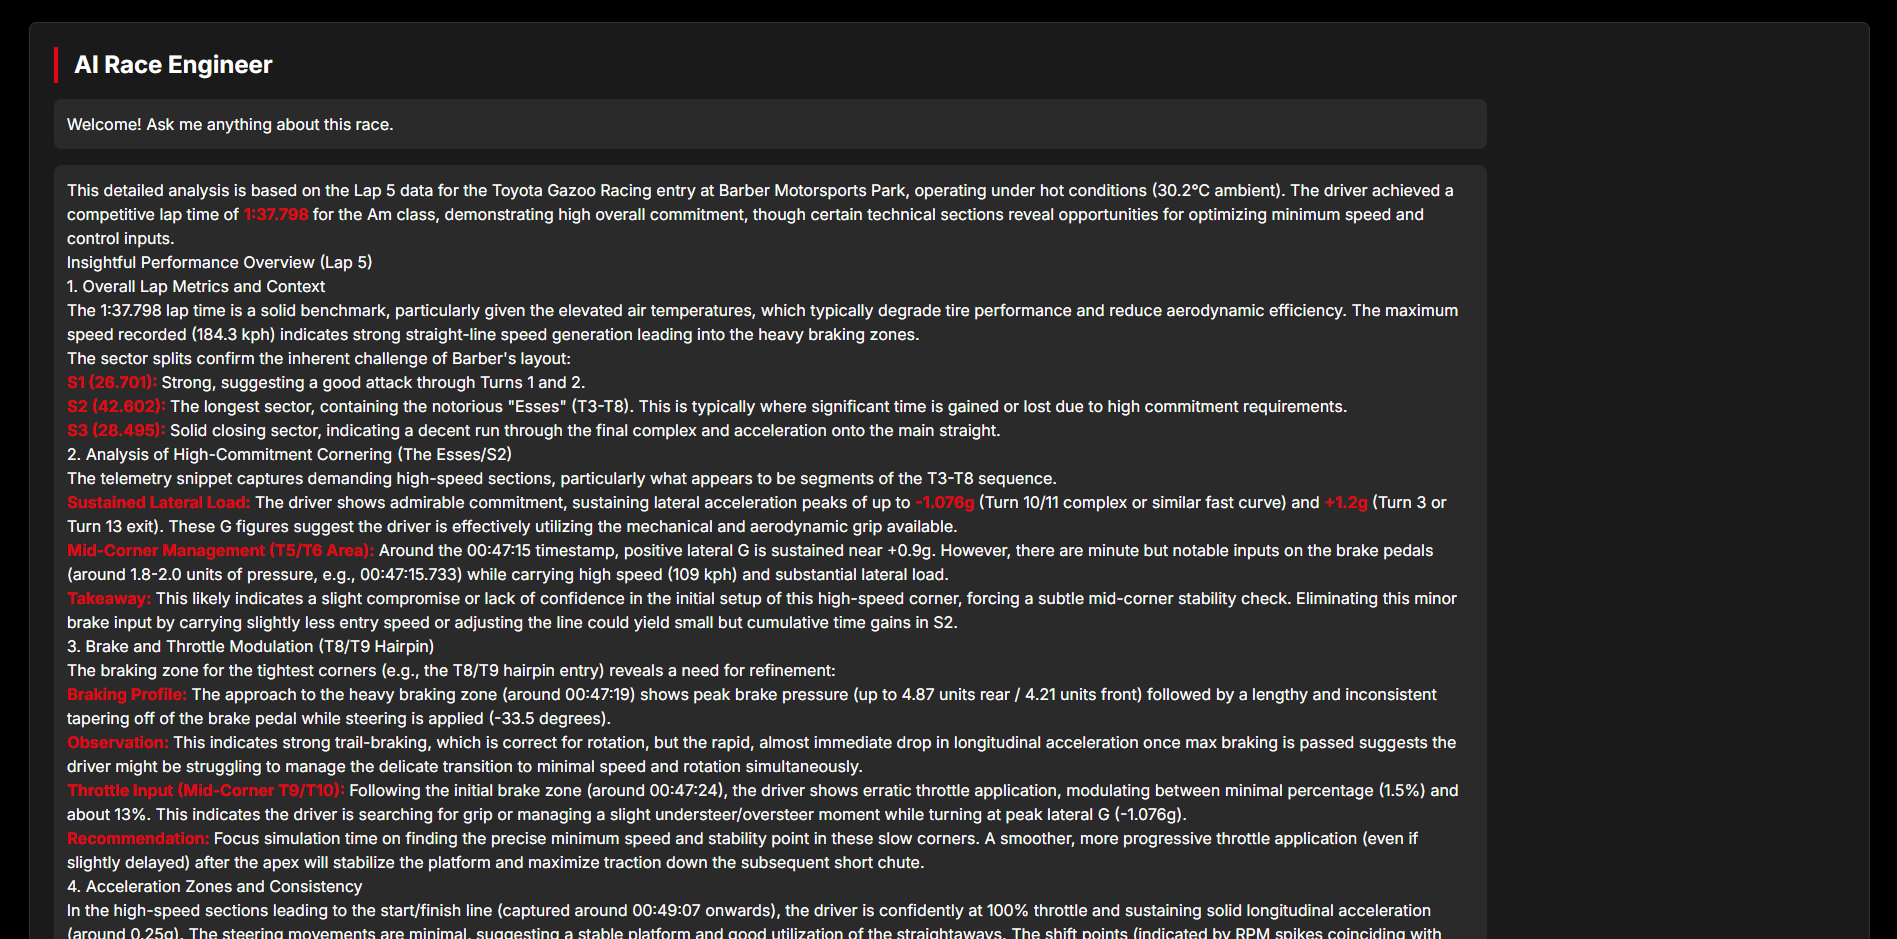
Analytics Screen AI Engineer
-
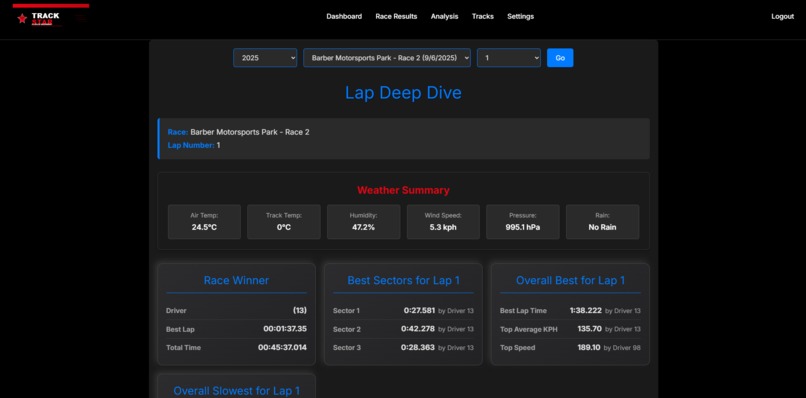
Lap Deep Dive Screen
-
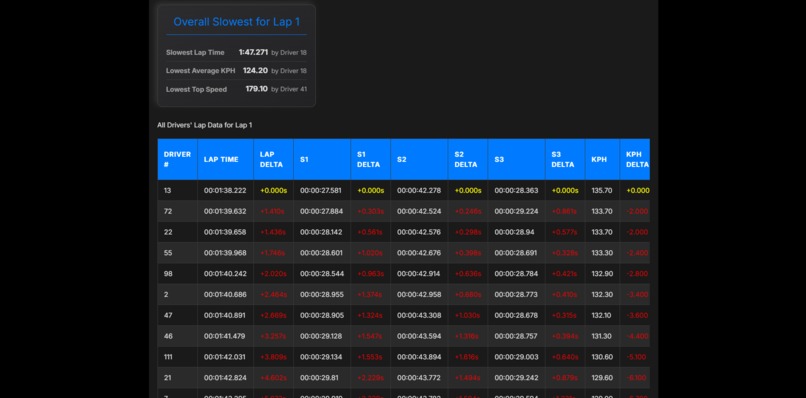
Lap Deep Dive Screen Lap Data
-
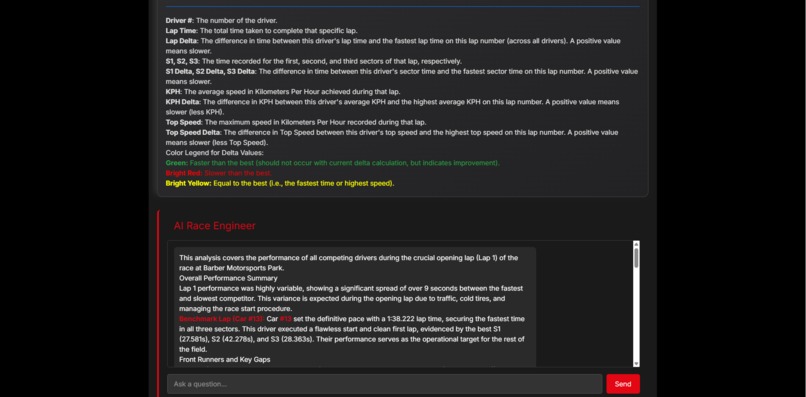
Lap Deep Dive AI Engineer
-

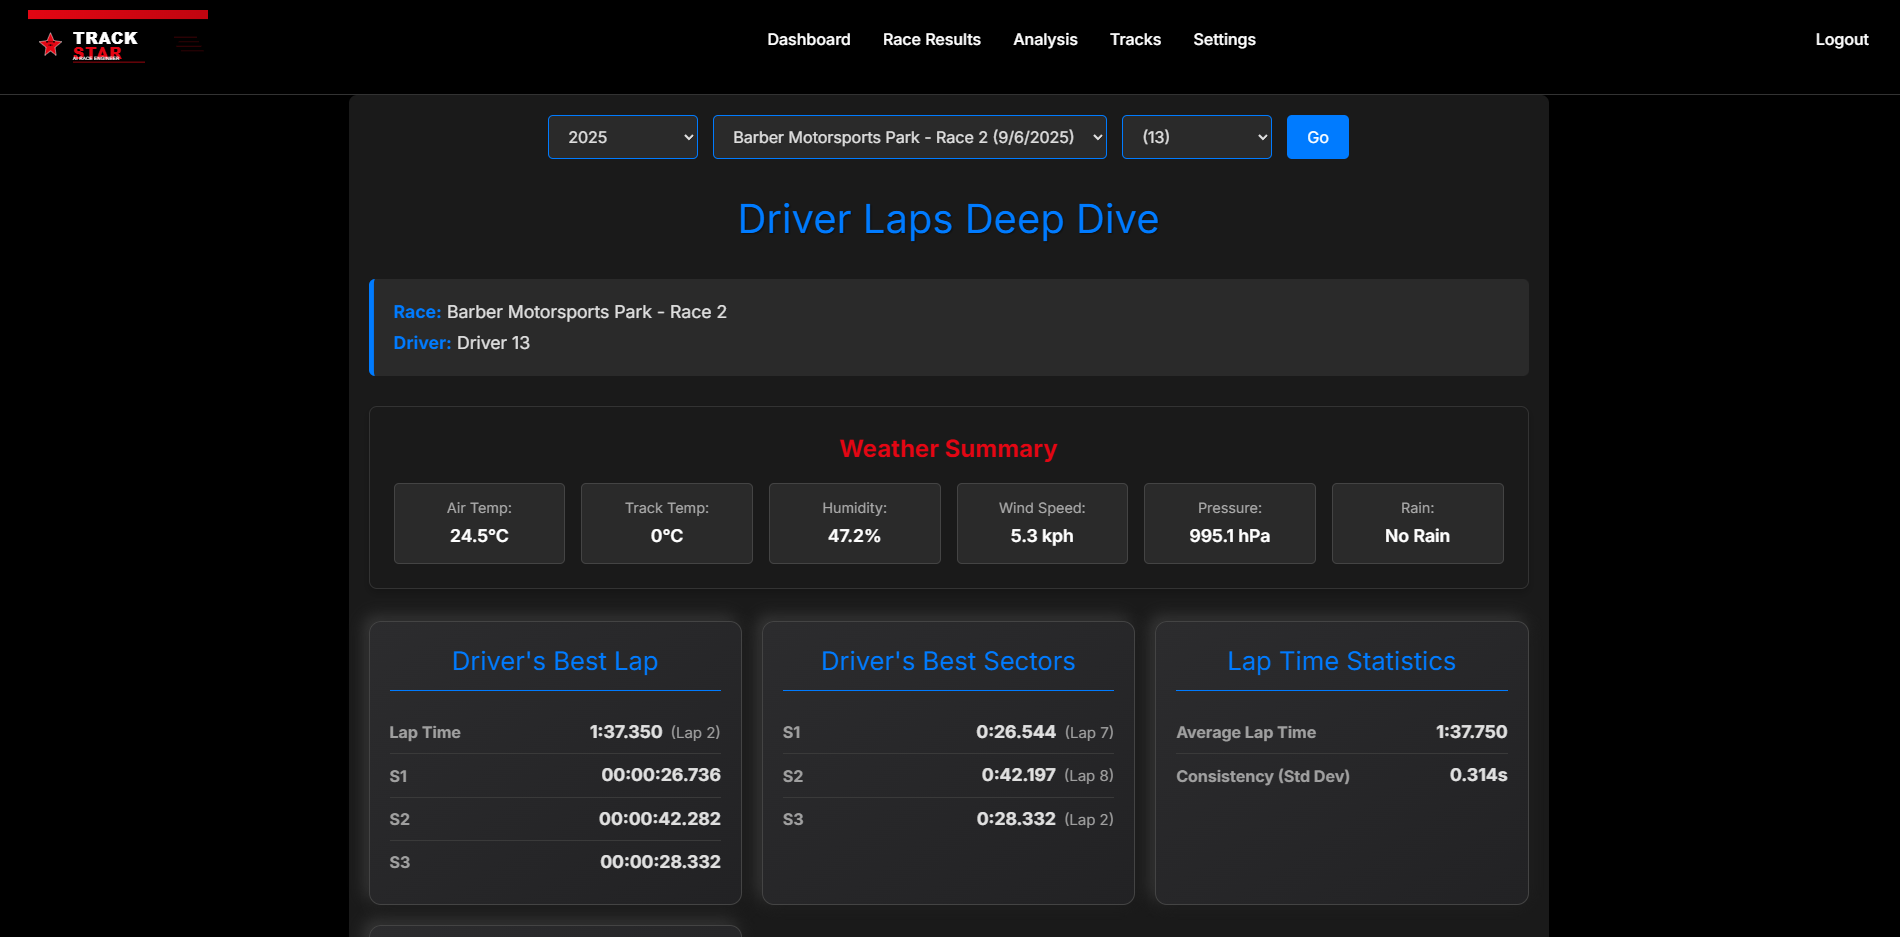
Driver Laps Screen
-
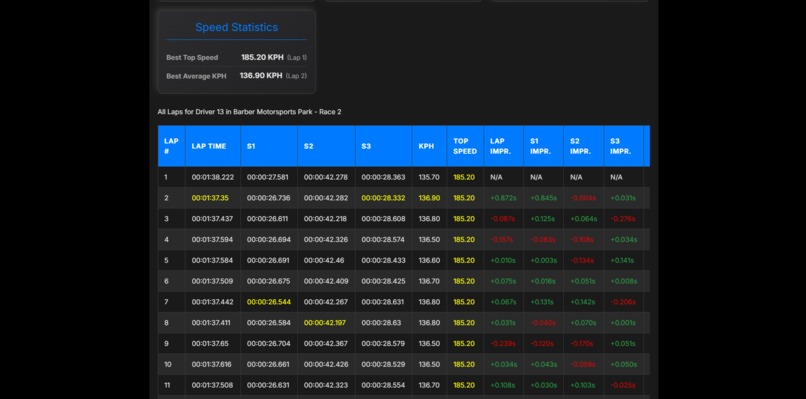
Driver Laps Screen Laps Data
-
Driver Laps Ai Engineer
-
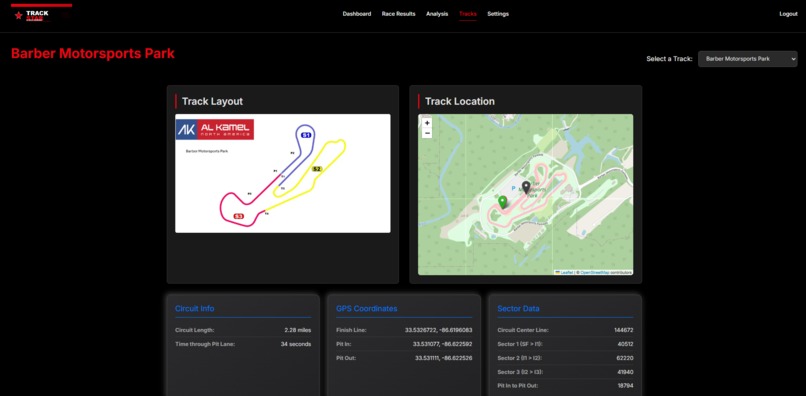
Tracks Screen
-
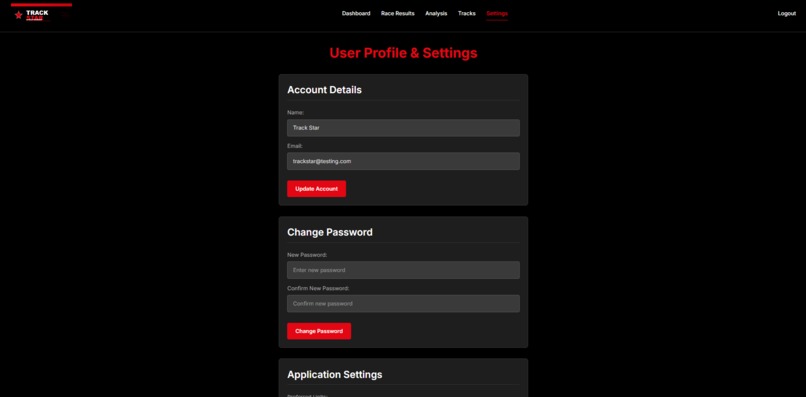
Application Settings


Inspiration: Bridging the Gap Between Passion and Code
For as long as I can remember, I have been obsessed with the world of motorsport. Whether it's the engineering precision of Formula 1 or the raw competitive nature of GT racing, I’ve always been fascinated by what makes a car go fast. But as I spent more time watching races and analyzing lap times, I realized that motorsport is effectively a math problem happening at 200 miles per hour.
As a developer, I realized I was sitting on a unique opportunity. I had the technical skills to interact with this data, but I was often frustrated by the existing tools available to fans and amateur racers. They were either too expensive, too complex, or stuck in the design language of the 1990s. I wanted to build a bridge between my two worlds: the adrenaline of the track and the logic of software development.
The Challenge: Making Data Meaningful
The core inspiration for Trackstar came from a desire to take something incredibly complex—raw race telemetry—and make it digestible.
I was genuinely excited by the challenge of Data Visualization. Telemetry files are essentially giant, messy spreadsheets of throttle positions, brake pressures, and GPS coordinates. My goal was to turn those cold numbers into something visual and intuitive. I wanted to build interactive charts and maps that didn't just display data, but actually told the story of the lap. I wanted to see exactly where on the track a driver was losing that tenth of a second.
Adding the "Brain": The AI Race Engineer
While visualization handles the "what," I wanted to answer the "why." This is where my interest in Artificial Intelligence came into play. I saw a practical way to apply LLMs not just as a gimmick, but as a functional tool. By integrating an AI "Race Engineer," I could allow users to have a conversation with their data.
Building Trackstar wasn't just about writing code; it was about creating a tool I actually wanted to use. It was about proving that with the right combination of modern web technologies and AI, we can make professional-grade race analysis accessible to everyone.
What it does
Trackstar is a comprehensive motorsport analytics platform designed to turn complex telemetry data into actionable performance insights. It serves as a bridge between raw numbers and the driver, offering:
- Deep Telemetry Analysis: Users can dive into specific race data, examining critical metrics like Speed, RPM, Throttle, and Braking for individual laps.
- Interactive Visualization: We move beyond static spreadsheets by using interactive charts and Leaflet-powered maps. Users can visualize the car's specific position on the track and compare racing lines to understand where time is being gained or lost.
- The "AI Race Engineer": Powered by Google Gemini, this feature acts as an intelligent co-pilot. Users can ask natural language questions about the data (e.g., "Why was I slower in Sector 2?"), and the AI analyzes the telemetry to provide instant, understandable feedback.
- Track & Driver Monitoring: The dashboard allows users to keep tabs on their favorite drivers and recent race statistics.
How we built it
We built Trackstar using Next.js to ensure a responsive and high-performance user interface.
For the backend, we relied on Supabase to handle user authentication and the storage of complex telemetry data (speed, RPM, throttle).
To bring the data to life, we integrated Leaflet to render interactive track maps, allowing users to visualize racing lines and GPS positioning.
Finally, the "AI Race Engineer" is powered by Google Gemini. We feed specific lap telemetry into Gemini, enabling it to analyze driver inputs and answer natural language questions about performance and strategy.
Challenges we ran into
Our most significant challenge was managing the sheer volume and integrity of motorsport telemetry.
Handling Massive Datasets Real-world race data is incredibly dense. We had to process telemetry files as large as 1.5 GB, which posed immediate issues for memory management and network timeouts. Importing this data into Supabase wasn't straightforward; we had to significantly optimize our ingestion process to parse and batch-insert millions of data points efficiently without crashing the application or hitting timeout limits.
Data Integrity & Gaps We also encountered issues with data consistency. Not every lap in the dataset was perfect; we faced instances of missing data points and gaps in the telemetry stream.
Accomplishments that we're proud of
- Mastering the Domain: Motorsport telemetry is notoriously complex, often consisting of thousands of abstract values per second. We are proud that we were able to decipher this raw data and successfully map it to meaningful physical concepts like braking zones, racing lines, and throttle application.
- The "Three-Way" Integration: One of our biggest technical wins was creating a seamless synchronization between Supabase (the data source), Leaflet/Charts (the visualizer), and Google Gemini (the intelligence). We managed to make these distinct technologies talk to each other , so when a user looks at a specific lap, the AI already knows the context of that specific data slice.
- Practical AI Utility: We didn't just add a chatbot; we built a tool. We are proud that we tuned the AI Race Engineer to provide actual, grounded analysis rather than generic responses, effectively bridging the gap between complex data science and user-friendly advice.
What we learned
- Optimization is non-negotiable: Working with telemetry files as large as 1.5 GB taught us valuable lessons in backend performance. We learned that when dealing with millions of rows of data, standard database insertion methods fail. We had to learn how to batch, stream, and optimize data ingestion to prevent timeouts and memory overflows.
- Context is King for AI: We learned that integrating an LLM like Google Gemini isn't just about sending a prompt; it's about data curation. We discovered that for the "AI Race Engineer" to be accurate, we had to be very specific about which data points we fed it. Too much noise confused the model, while too little made it generic.
- The nuance of Real-World Data: We learned that real-world sensors are messy. Handling missing data points and "gaps" in the telemetry forced us to write more defensive code. We realized that building a robust application means expecting the data to be imperfect and designing systems that can handle those imperfections without breaking the user experience.
What's next for TrackStar
Our immediate focus is to get Trackstar into the hands of users—whether they are sim racers or motorsport fans—to gather feedback and validate our approach to data visualization. We want to see how people interact with the "AI Race Engineer" and refine the prompts to make it even more accurate.
Beyond that, we have a roadmap for future development:
- Real-Time Telemetry: Currently, we analyze post-race data. We would love to implement real-time data streaming (using Supabase Realtime) so teams could monitor driver performance live on the track map.
- Expanded Data Support: We plan to support more data formats, allowing users to import telemetry from a wider variety of racing simulators (like iRacing or Assetto Corsa) and even real-world OBD2 data.
- Optimization: We want to further refine our data ingestion pipeline. Handling 1.5 GB files is heavy, so we plan to implement more advanced data compression and streaming techniques to make the upload process faster and lighter.
- Mobile App: Racing often happens away from a desktop, so a companion mobile app for quick track-side analysis is on our radar.
Built With
- gemini
- leaflet.js
- nextjs
- recharts
- supabase

Log in or sign up for Devpost to join the conversation.