-
-
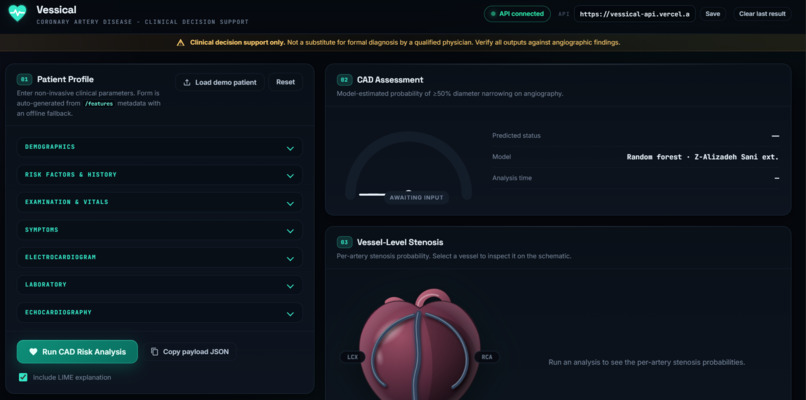
Landing page
-
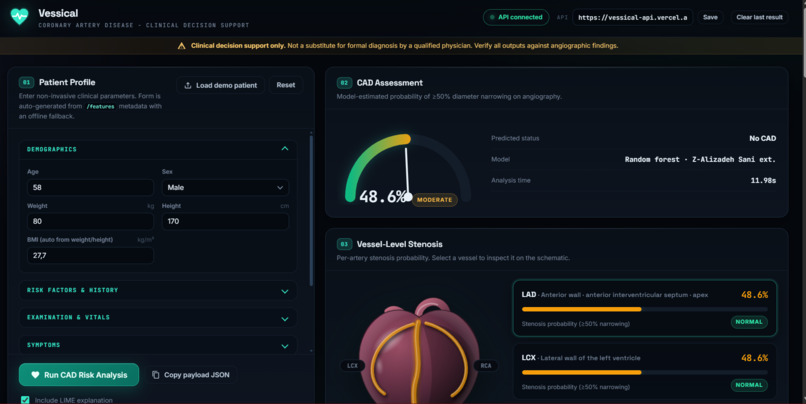
Working API
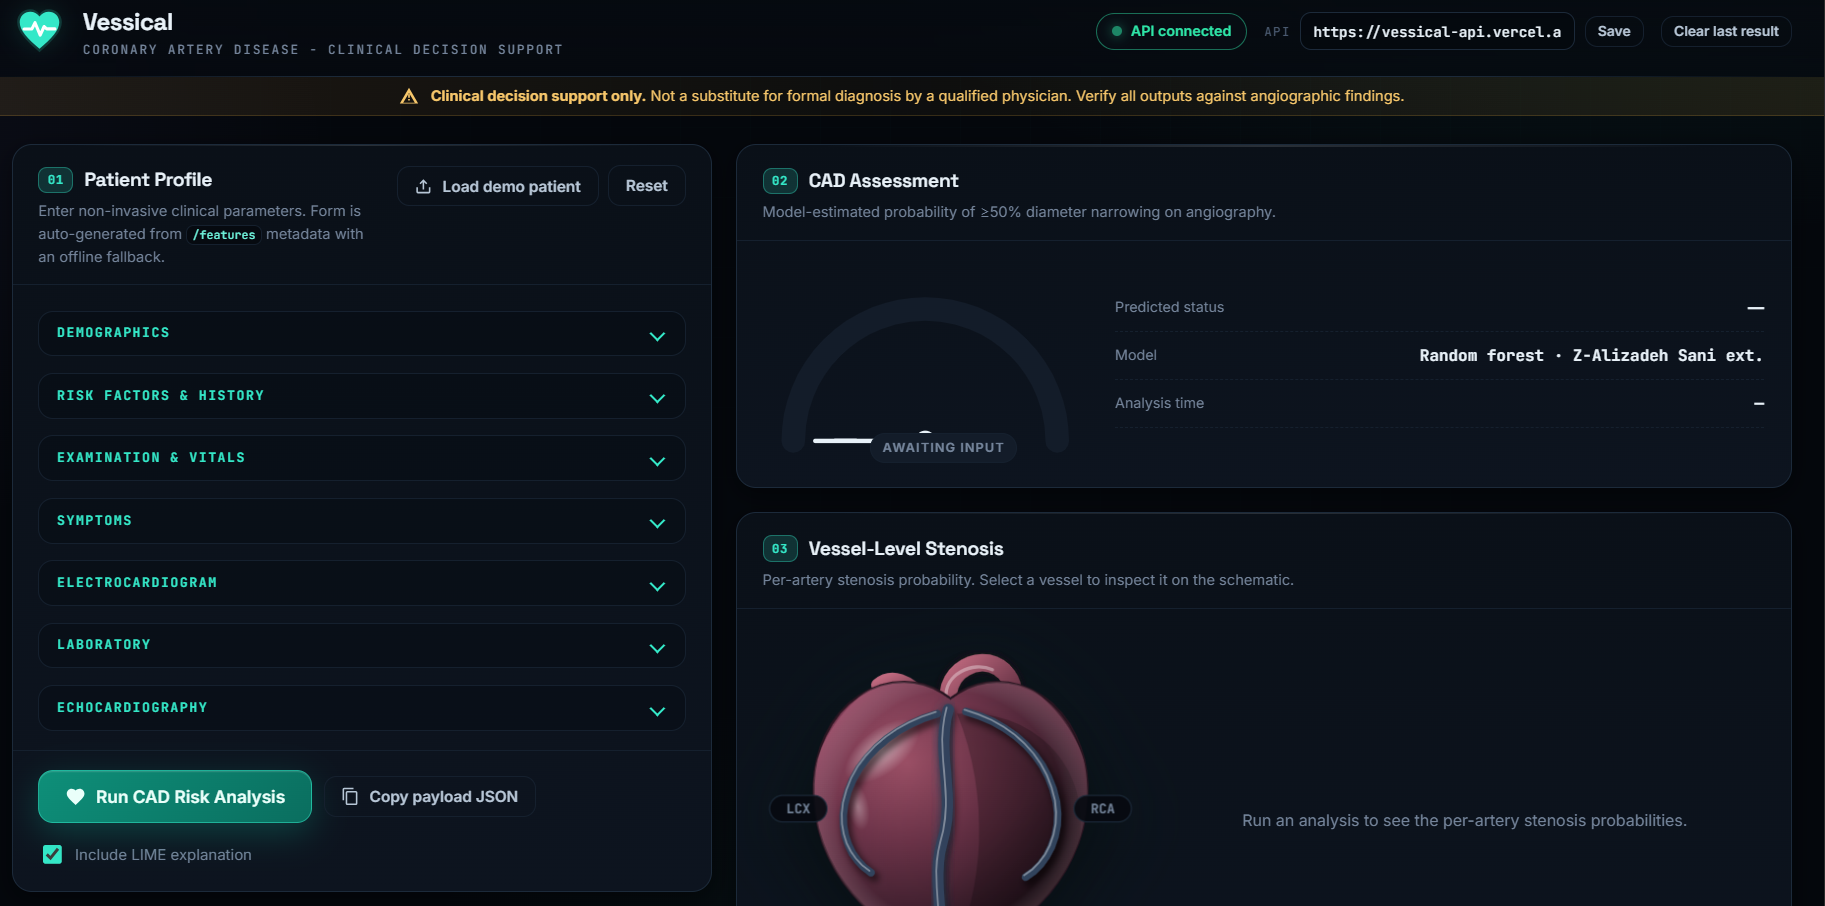
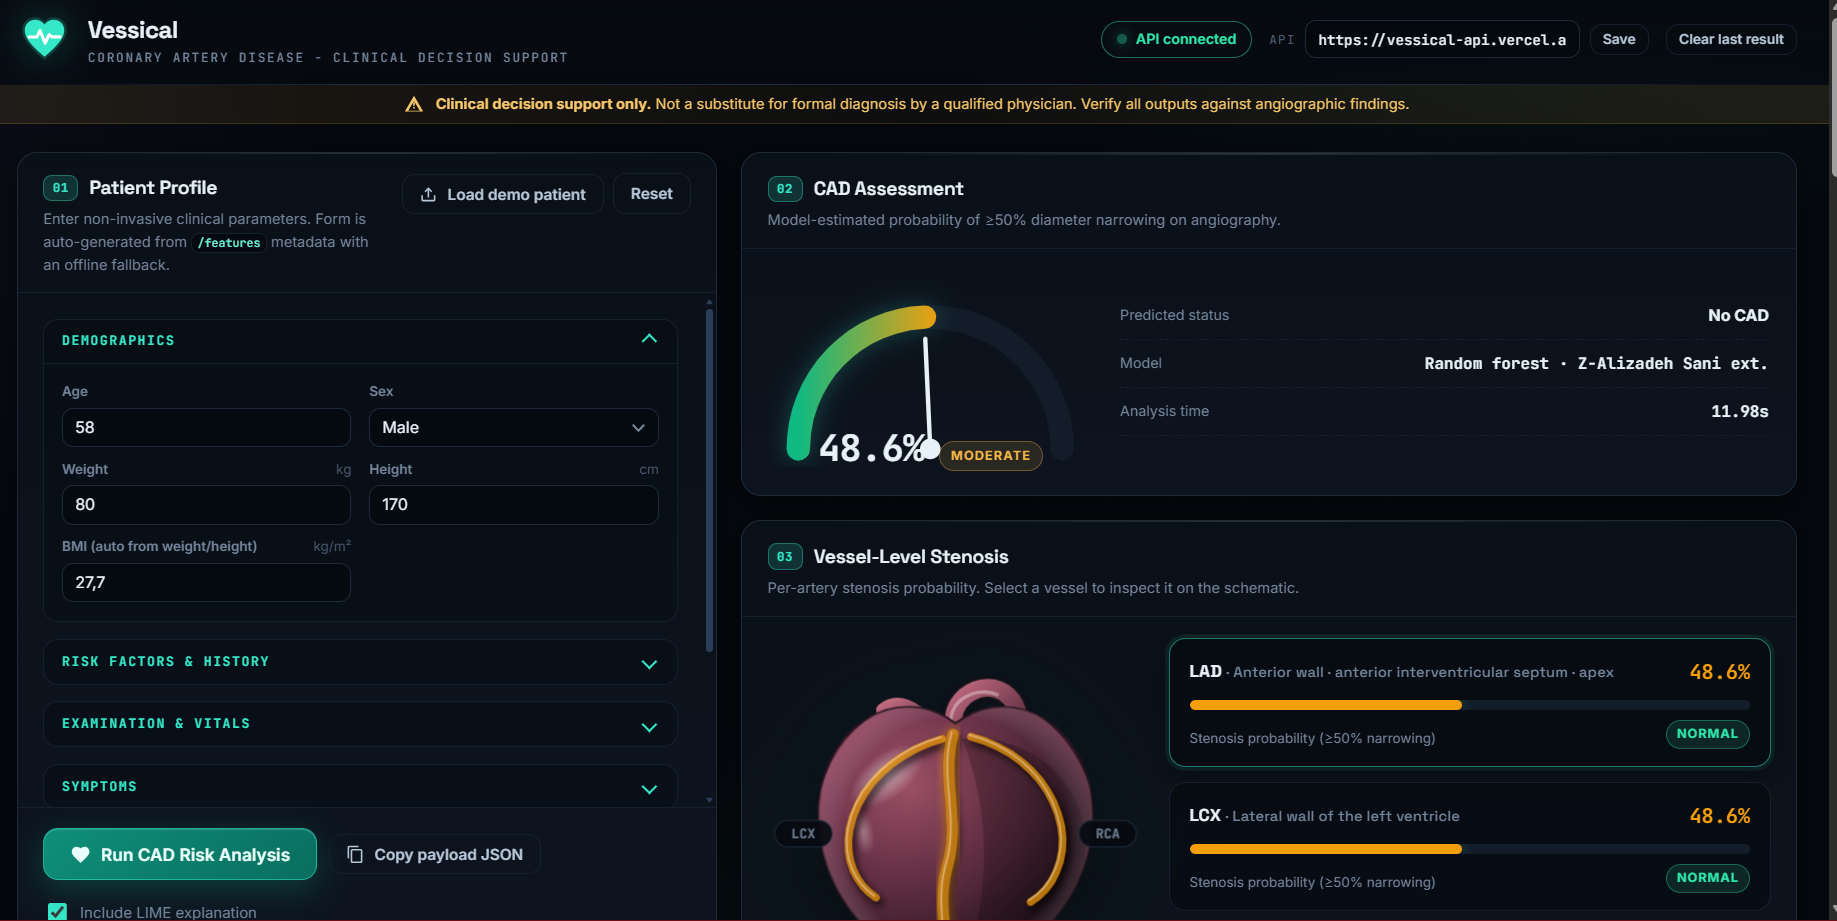
Inspiration
Cardiovascular disease is a leading cause of death worldwide, yet most risk tools just hand you a percentage. That number does not tell a clinician or a patient where the problem is or why it's there. I wanted risk you can see. I lost a family member to an illness that would have been tended to had tools like this existed, that's why I chose this project.
What it does
Vessical predicts overall coronary artery disease (CAD) and the stenosis status of the three major coronary vessels (LAD, LCX, RCA) from a patient's demographic, clinical, ECG, lab, and echo data. Predictions are painted onto an interactive 3D heart, where each vessel changes colour by its predicted risk. Users can rotate, zoom, and click a vessel to see its probability and the top factors driving it, using SHAP. Changing the patient's inputs updates the heart live.
How we built it
Vessical has a Python FastAPI backend and a browser dashboard. The model is a random forest trained on the Extension of Z-Alizadeh Sani dataset (303 patients, 59 features) from the UCI repository. It predicts overall CAD plus stenosis for the LAD, LCX and RCA. The API serves /predict, /metrics, /features and demo patients from the dataset, and LIME explains each prediction.
The frontend is vanilla JavaScript. The patient form builds itself from the API’s /features metadata, with an offline fallback. Every API response is checked against a contract before it is shown, so a malformed answer can’t paint a wrong result. The 3D heart is built in Three.js. Each artery is a 3D tube coloured by its risk, and its lumen narrows as the predicted probability rises. The viewer talks to the dashboard through a small event interface, so the vessel cards, the explanation tabs and the 3D heart stay in sync. I designed the visual style around a cath-lab imaging screen, so it doesn’t look like a generic medical dashboard.
Challenges I ran into
- Turning a flat risk number into something spatial. My first heart was a flat SVG with shading, and I rebuilt it as a real 3D scene with clickable arteries.
- Keeping the whole dashboard consistent. The gauge, vessel cards, 3D heart and explanations all had to update from a single prediction.
- Making the app fail safely. I added response validation and clear error messages for CORS, timeouts and bad API replies. If WebGL isn’t available, the flat SVG heart appears instead of a blank panel.
- Working with only 303 records, which limits how far the results can be trusted. ## Accomplishments that I am proud of
- Risk you can see: each vessel changes colour and narrows by its predicted probability, and clicking it shows the probability and the factors driving it.
- A full pipeline from patient data to model to explanation to the 3D heart.
- A visual identity that looks like an imaging suite and not a template.
What I learned
A prediction is more useful when it shows where the problem is and why, not just how likely it is. Explainability needs careful design. Attribution bars are only useful if they use plain physiological terms. Validating what the backend returns, and building a fallback for the 3D view, made the app far more reliable.
What's next for Track A: Vessical
Replace the procedural heart with an anatomical mesh from BodyParts3D or an open .glb model. Show risk along each artery segment, not as one value per vessel. Validate on external datasets and check calibration, because 303 records from one source isn’t enough for clinical use. Work with clinicians on the explanations, and add a simple version for patients. Keep the clear reminder that Vessical supports decisions and doesn’t replace diagnosis.

Log in or sign up for Devpost to join the conversation.