-
-
Pillar 1: Queue management
-
Pillar 2: SHA optimization
-
Pillar 2.5: SHA interleaving
-
Pillar 3: Hardware awareness
-
Final Results
Obsidio: Overcooked

Links on this Page
- GitHub
- Resilience write-up
- Resilience write-up supporting animations
- ACTUAL
RESILIENCE-WRITEUP.mdfile within GitHub repo
Inspiration
If you have played Overcooked, you already understand the problem.
You are running a kitchen. Orders arrive faster than you can cook them. Some dishes are quick and some take forever, and the slow ones are worth the most. You have a fixed number of appliances and you cannot buy more. And a dish served late is not worth half credit. The customer has already walked out.
That last rule is what makes it interesting, and it is not an analogy. It is the literal grading contract of the Obsidio track: a request that arrives late scores exactly the same as a request that errors, which is zero. Every team gets an identical container capped at 2 CPUs and 2 GB, so nobody can buy their way out. The only variable is engineering.
We took the track because that constraint makes bad decisions visible. You cannot hide a design mistake behind a bigger machine.
What it does
A price analytics API with three graded endpoints and a health check, served from a single Go binary in a container capped at 2 CPUs and 2 GB.
| Endpoint | Work | Share of load | Weight |
|---|---|---|---|
GET /price |
in-memory lookup | 60% | 1 |
GET /stats |
mean, min, max and population stddev over 500 points, recomputed every request | 30% | 3 |
GET /risk |
50,000 chained rounds of SHA-256, uncacheable | 10% | 10 |
The leaderboard metric counts only responses that were correct and inside their latency budget:
$$\text{work_score} = 1 \times n_{\text{price}} + 3 \times n_{\text{stats}} + 10 \times n_{\text{risk}}$$
Which means /risk is a tenth of the traffic and forty percent of the score. That single ratio drove almost every decision we made.
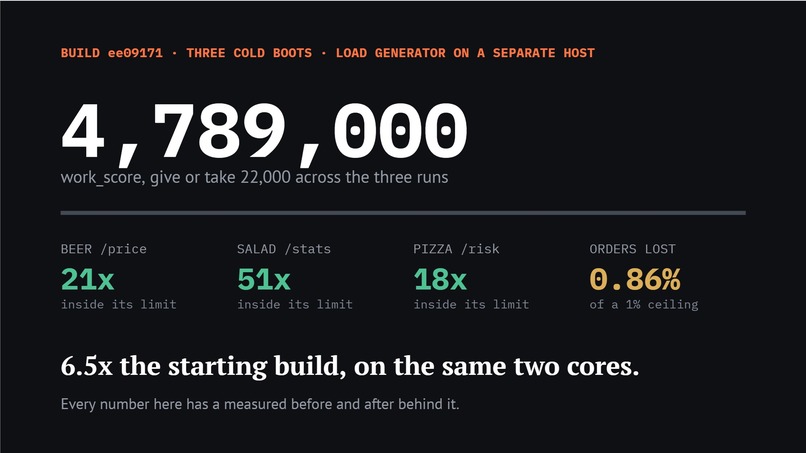
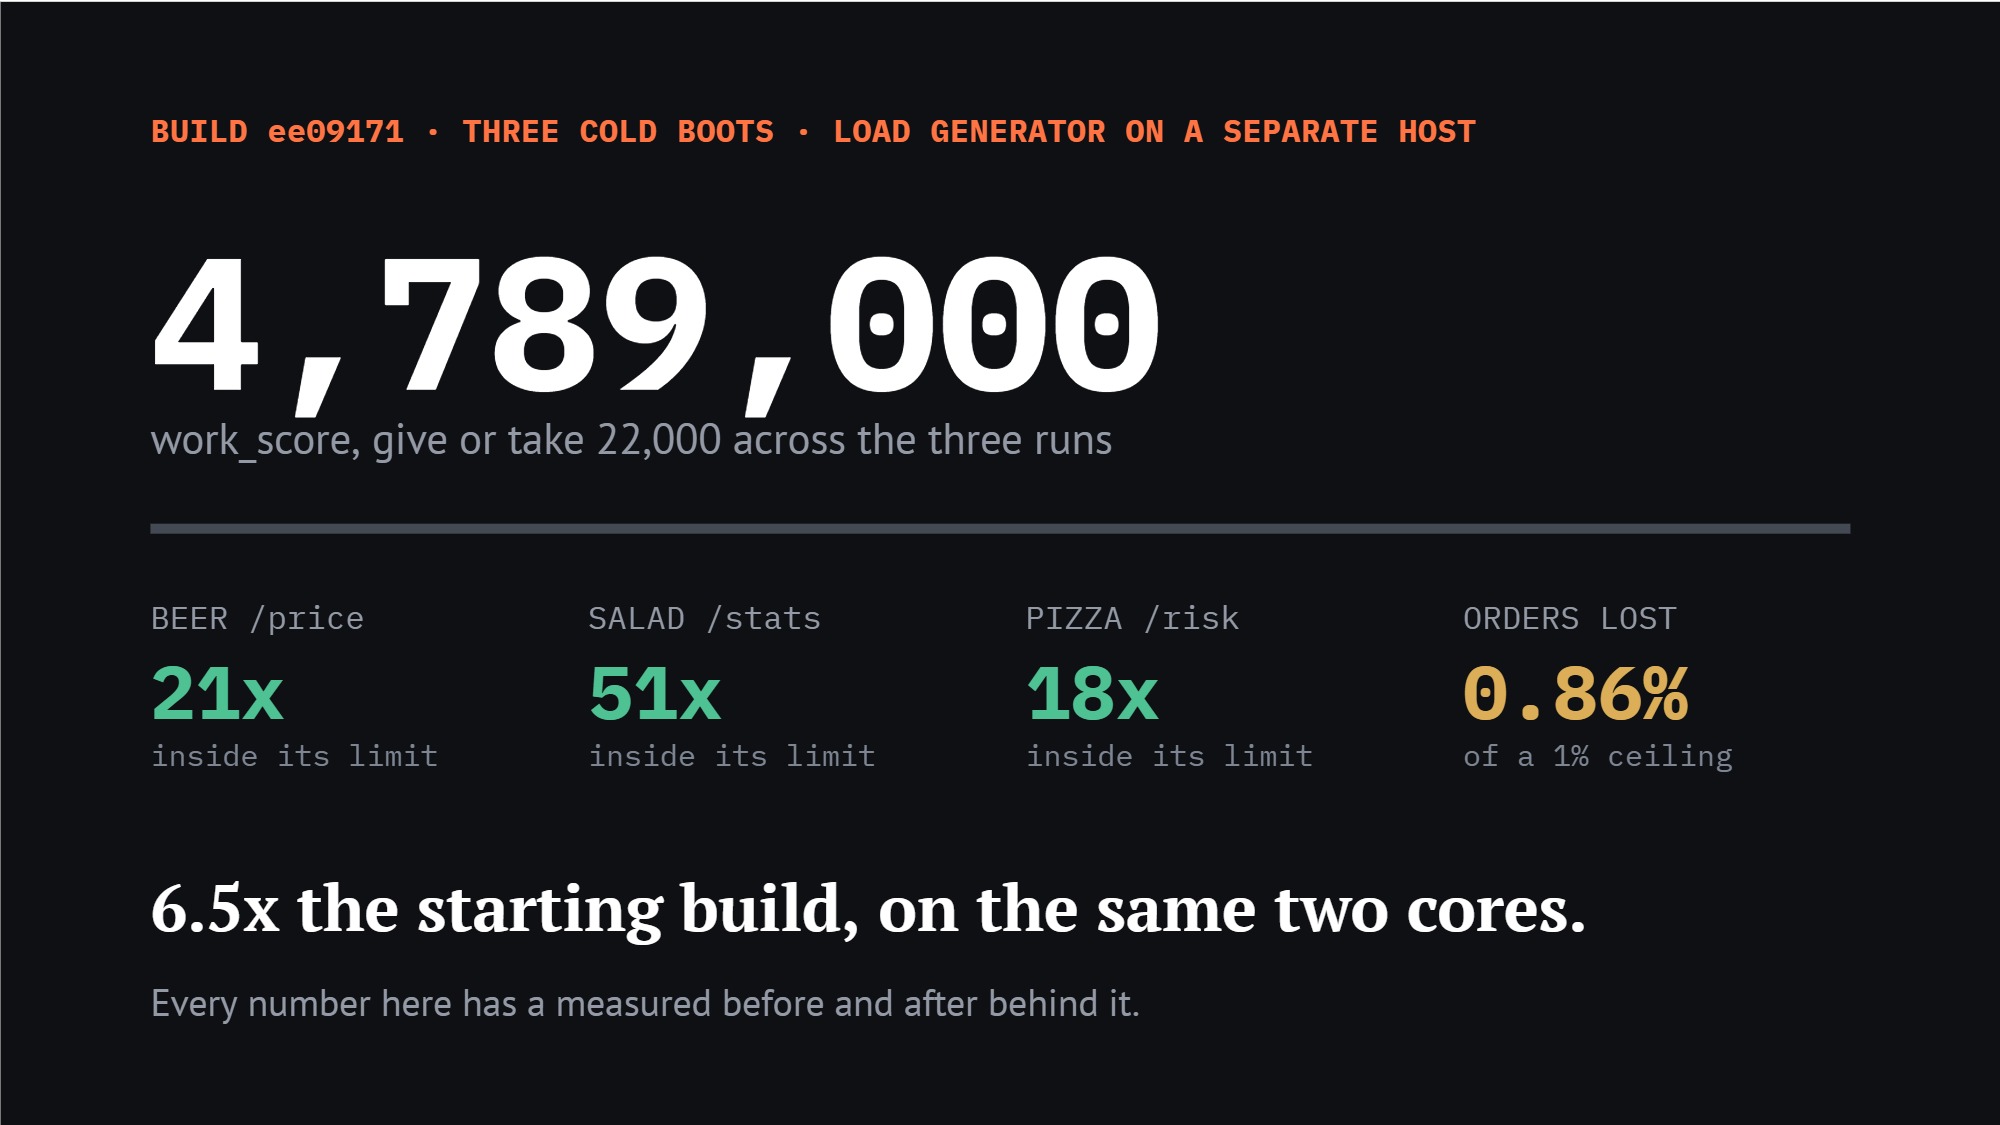
Final result, submission build ee09171, verified across three cold container boots on a c7i.xlarge target capped to 2 CPU / 2 GB with the load generator on a separate host:
- 4,789,220 work_score (4,801,382 / 4,761,262 / 4,805,018, spread 0.91%)
/pricep95 9.7 ms against a 200 ms bar (21x margin)/statsp95 9.7 ms against a 500 ms bar (51x margin)/riskp95 82 ms against a 1500 ms bar (18x margin)- Error rate 0.86% against a 1% ceiling
- 6.4x the naive Go starter under the same caps (745,484)
How we built it
Size the runtime to the container, not the host. nproc inside a capped container still reports every core on the machine, so Go's default GOMAXPROCS and any auto-sized worker pool will provision for cores they can never use. We read the real quota from /sys/fs/cgroup/cpu.max and pin everything to it. This alone was worth +71% (745,484 to 1,273,640) before a single line of clever code.
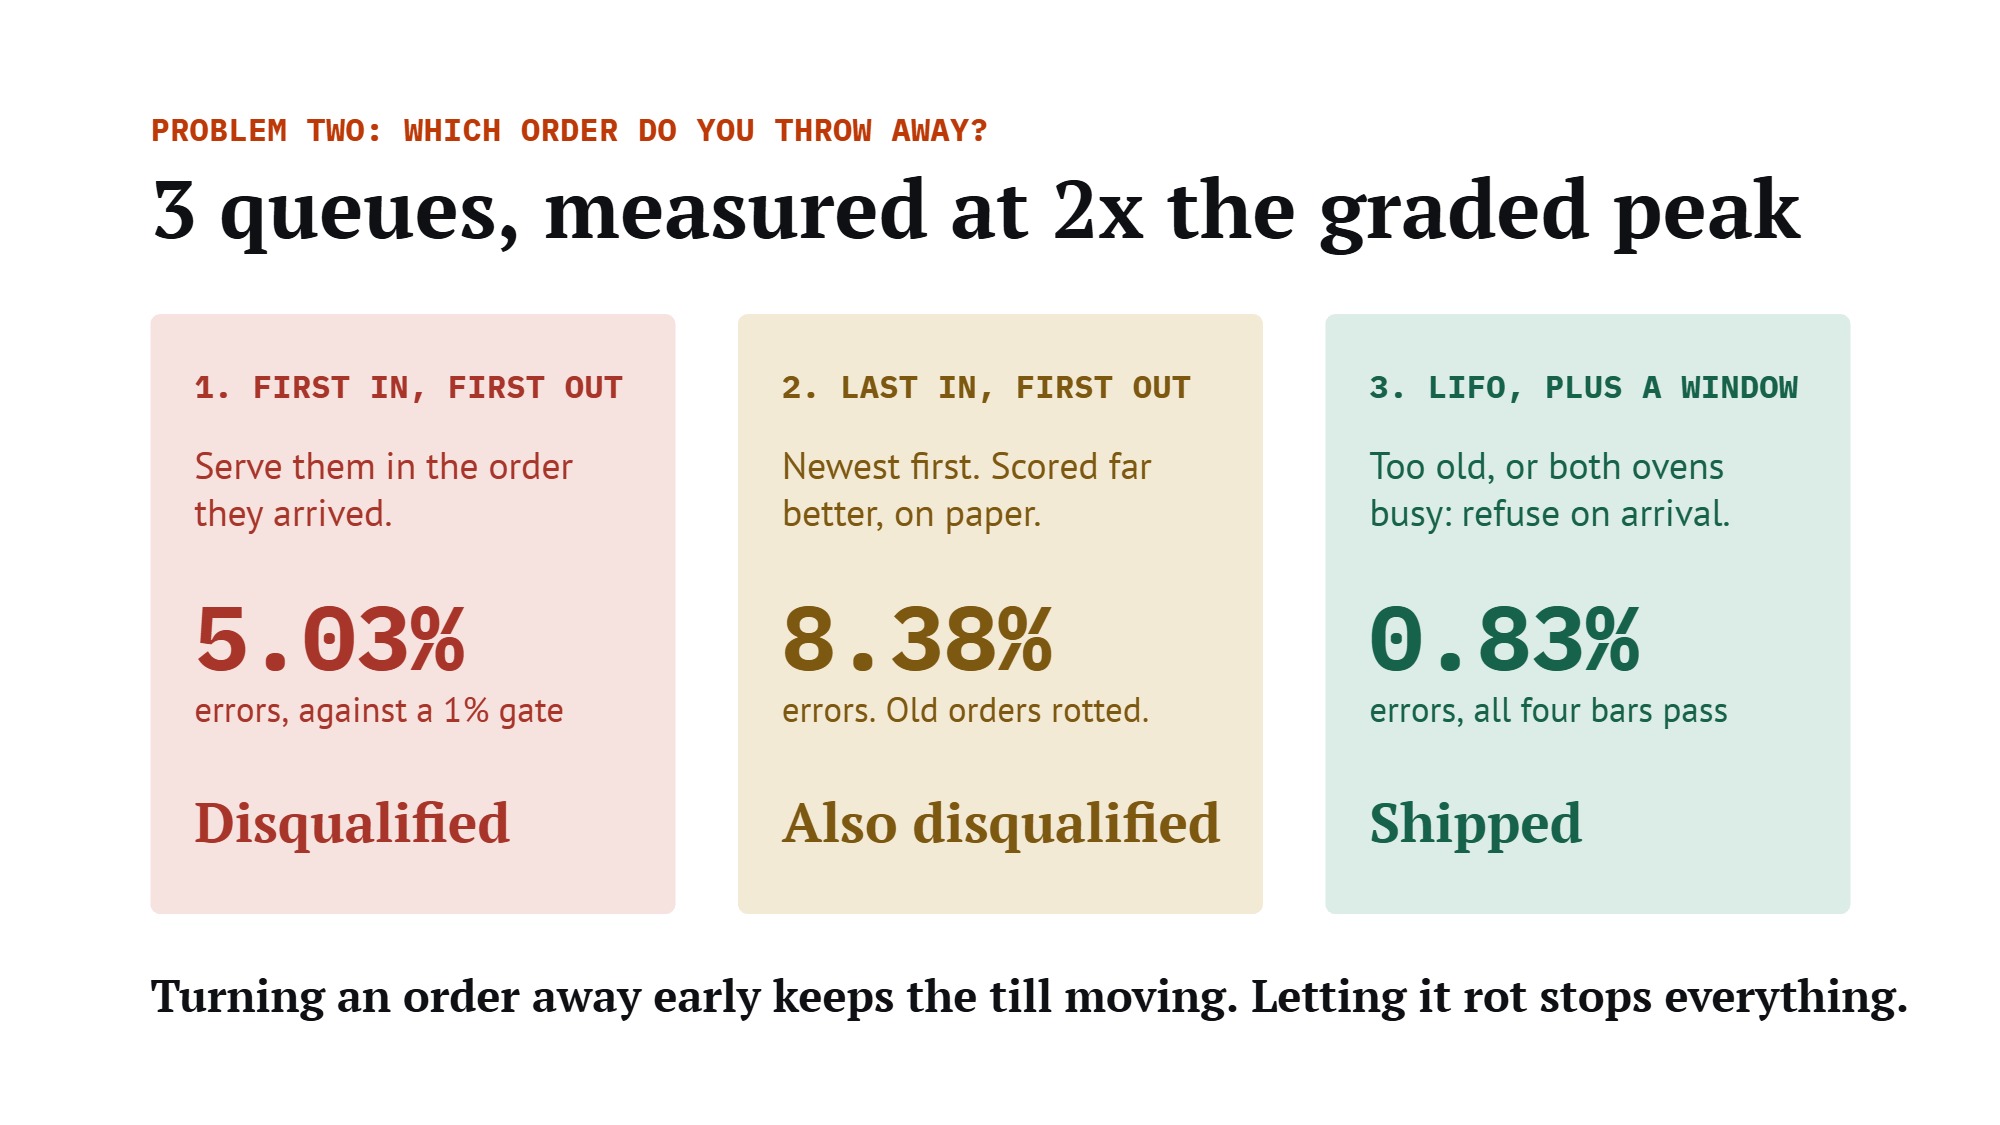
Admission control instead of a queue. At most two hash chains run at once. Waiters park on a bounded stack, newest served first, and anything older than a calibrated patience window is evicted at grant time rather than served late. When the workers are busy and the error budget is open, the request is refused at arrival. Queue depth is derived from Little's Law against a boot-time measurement of the real chain cost on the actual box:
$$L_{\max} = \frac{W_{\text{timeout}}}{C_{\text{unit}}} \times S \times k$$
where $C_{\text{unit}}$ is measured, not assumed, $S$ is the concurrency limit, and $k$ is a safety factor of 3 because a boot-time measurement on an idle system is a best case.
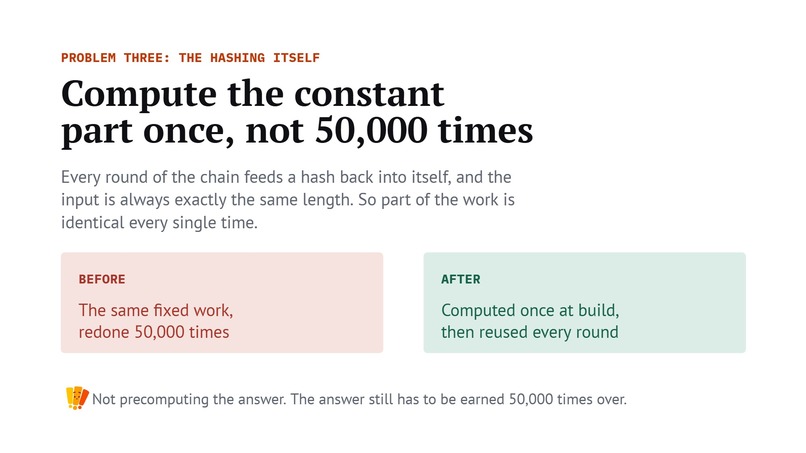
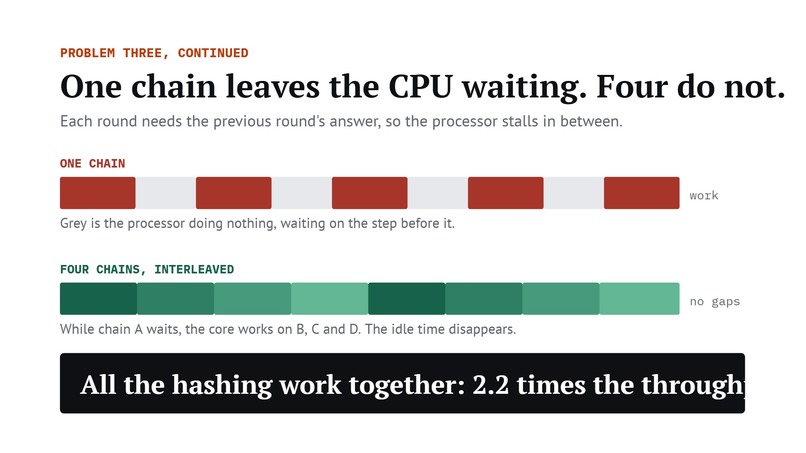
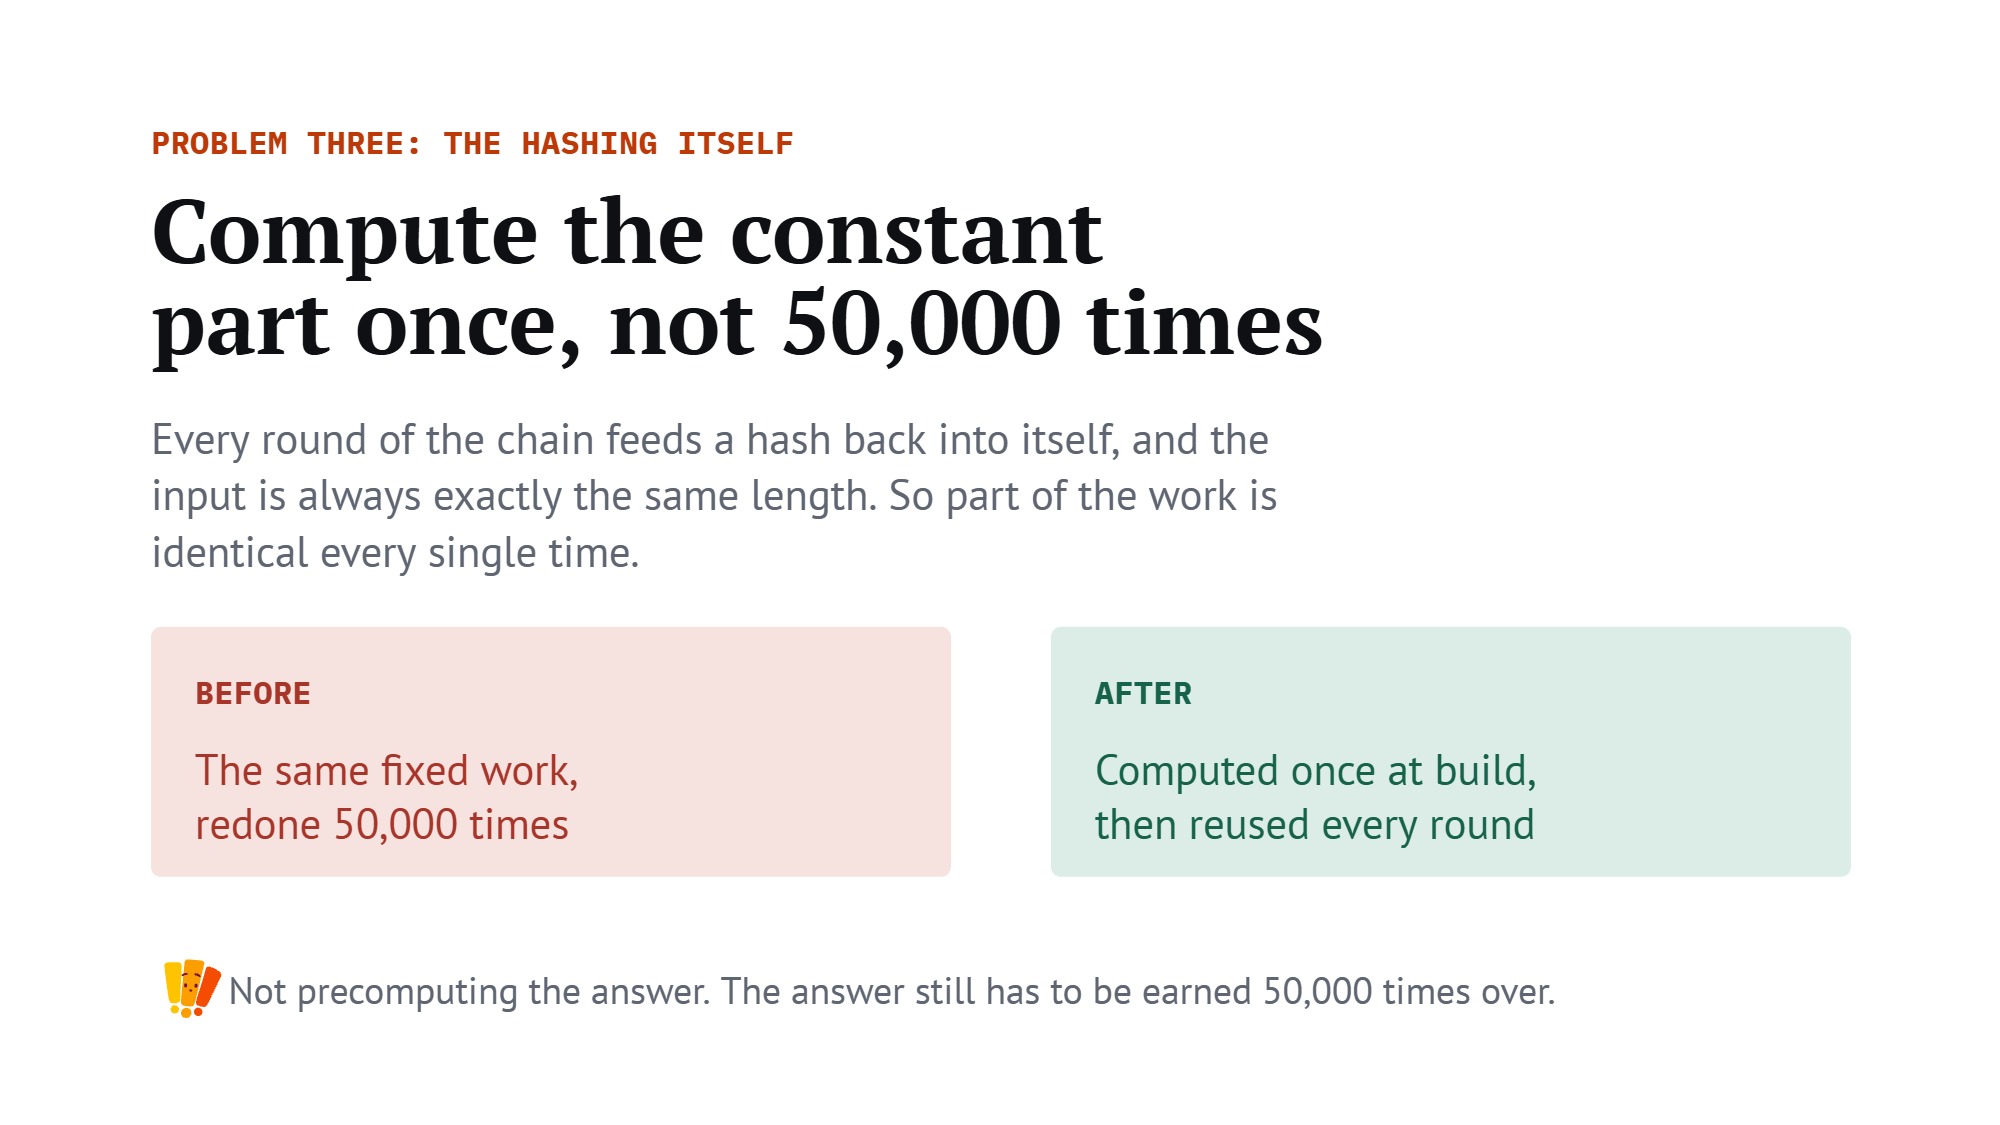
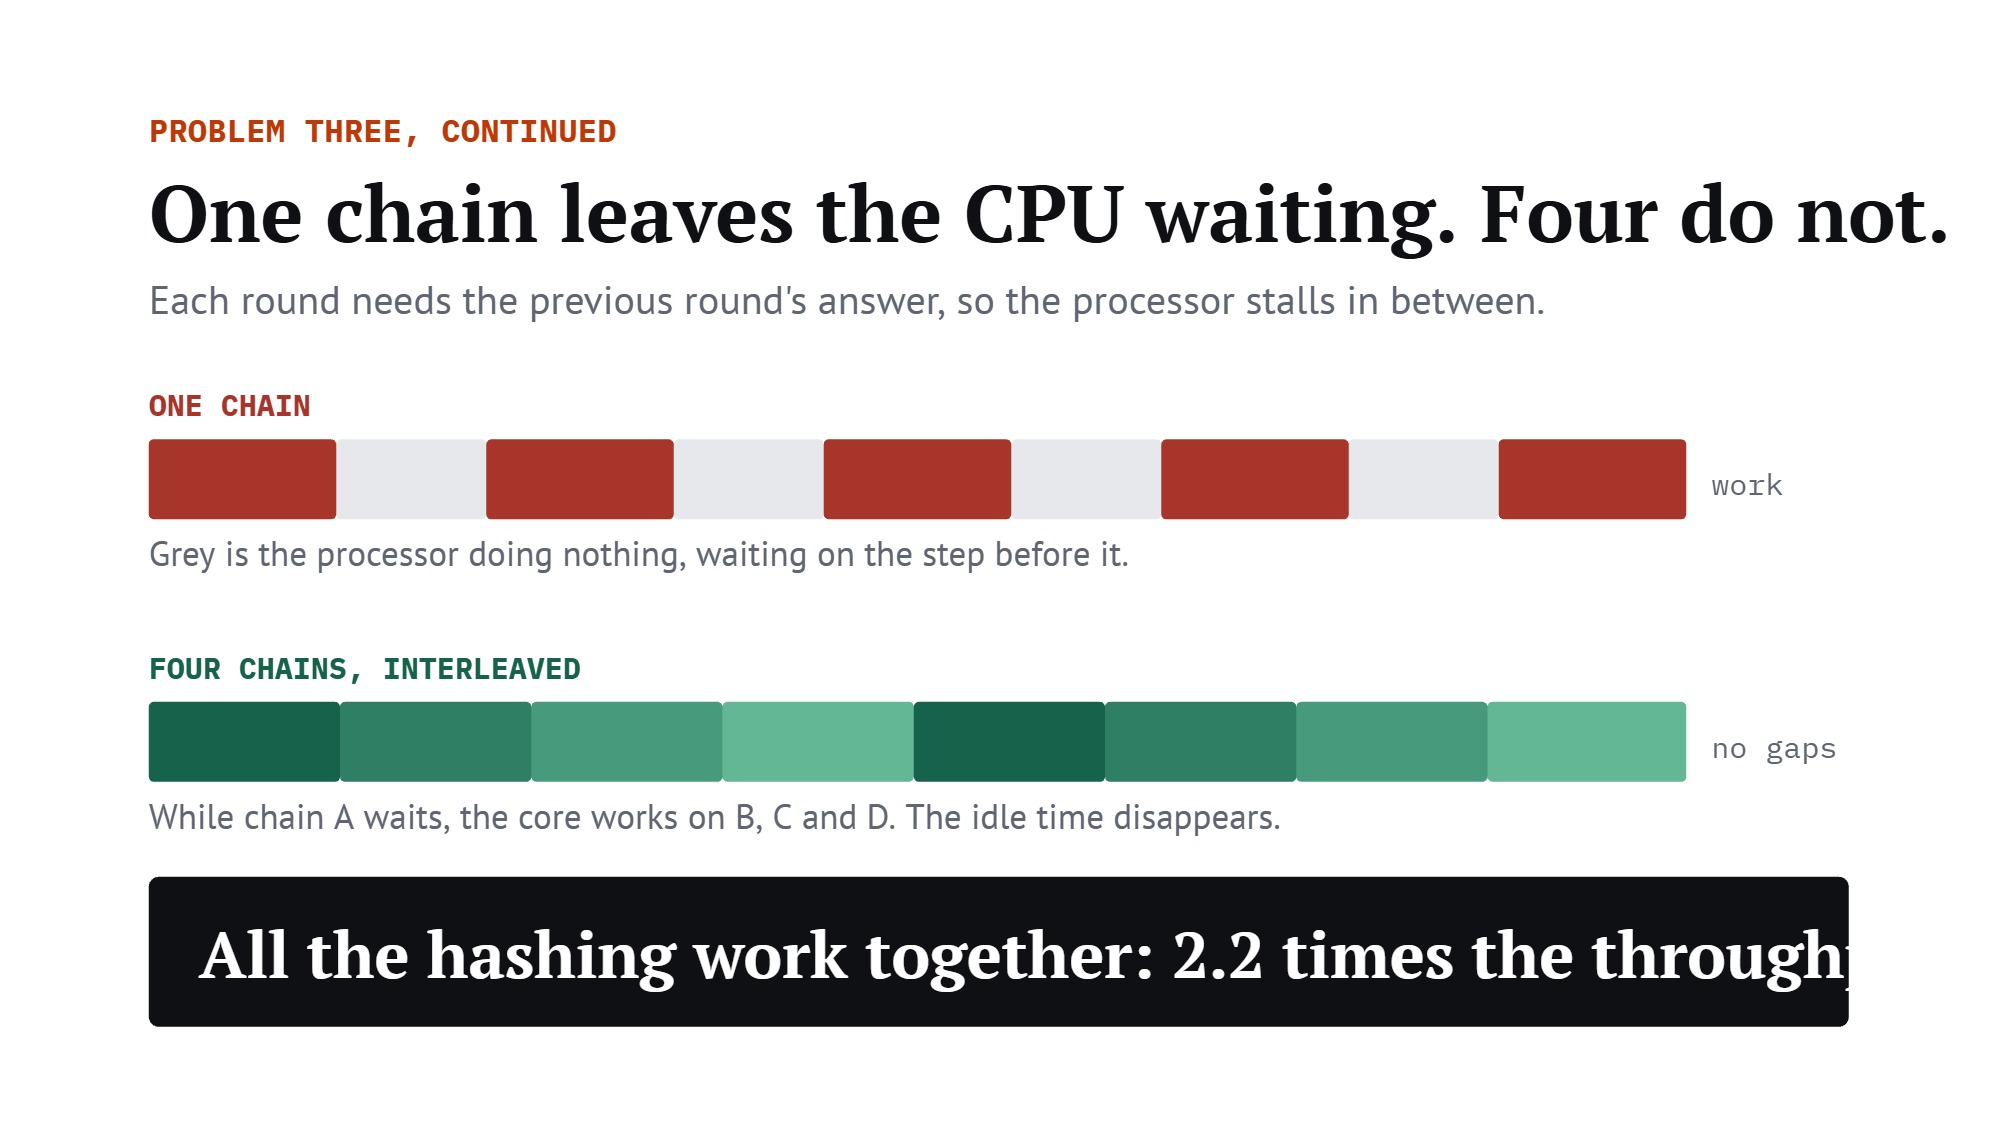
Rebuild the hot loop from a profile. After profiling on real grading-class hardware, five bracketed changes to the SHA-256 chain compounded to 2.24x: a packed pair-table hex encoder (+7.8%), a direct two-block kernel exploiting the fact that every input after round one is exactly 64 bytes so the padding block is constant (+28.6%), a two-lane SHA-NI interleave (+27.4%), a fused pair iteration that collapses four Go/assembly crossings into one (+16.1%), and a four-lane chain kernel (+9.4%).
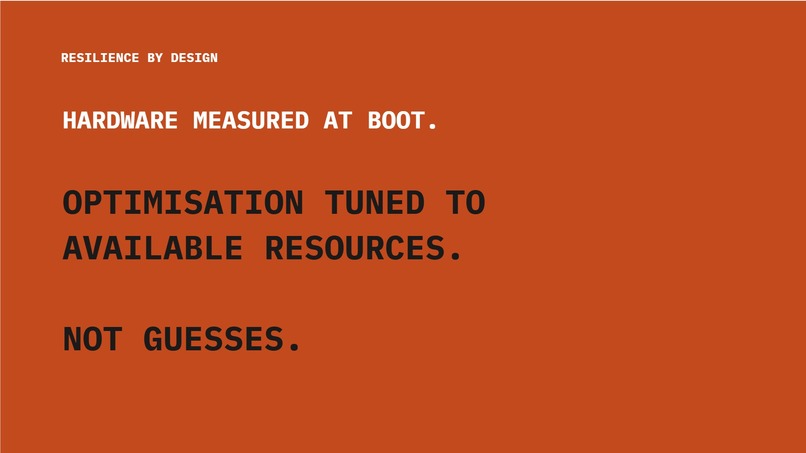
Never assume the hardware. We were told to assume nothing beyond 2 cores and x86-64. Every kernel sits behind CPU feature detection, a boot differential test against crypto/sha256, a startup race that must show a real win, and an environment kill switch. The correctness test runs inside the Docker build, so a kernel that breaks the digest fails to produce an image rather than producing a fast wrong one.
Durability without a database. POST /price appends to a write-ahead log and fsyncs before the response is sent, so an acknowledged write cannot be lost to a hard kill. A torn tail entry is skipped on replay, which is correct: it never returned a 200. The log sits entirely off the read path, so it costs the graded run nothing.
Measure on hardware shaped like the grader's. We built a CloudFormation-provisioned testbed: a cgroup-capped target instance and a separate load-generator instance on a private subnet. Every accept-or-reject decision ran as a champion, candidate, champion bracket, so the two champion sides report the noise floor for that specific comparison rather than a rule of thumb.
Challenges we ran into
Our own laptops were lying to us. For a day and a half we believed /price was taking 140 ms and designed around it. On real hardware with the load generator on a separate host it had been 10.6 ms the whole time. The delay was our cramped test setup. The measured noise floor on the separated testbed is about 0.8%; locally it is nearer 10%. After that, no decision rested on a local run.
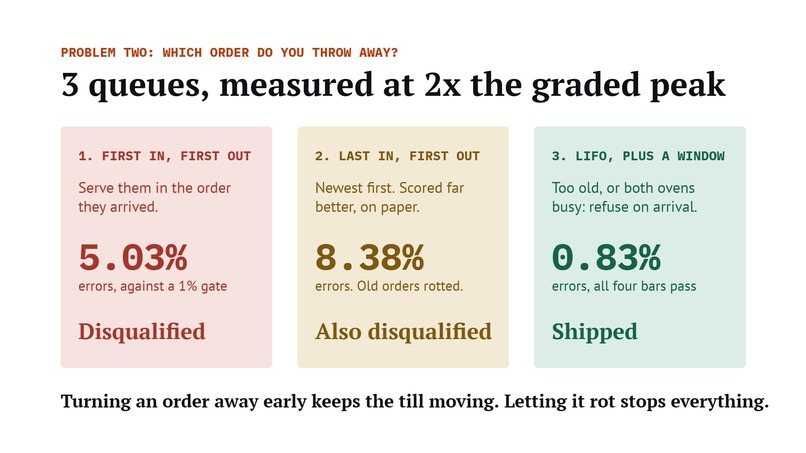
Fail-fast is not free. Our first instinct under overload was to reject early. But a 503 counts against the same http_req_failed ceiling as a timeout, so shedding is not exempt from the qualifying gate. Worse, in a closed-loop load test a rejected client returns in about 50 ms and re-floods the queue. We proved this at twice the graded peak, back to back on the same machine:
| Admission policy | Errors | Outcome |
|---|---|---|
| FIFO queue with deadline | 5.03% | Disqualified |
| LIFO with deadline | 8.38% | Disqualified |
| LIFO with an acceptance window | 0.83% | All four bars pass |
One of our own verdicts turned out to have expired. We closed fast-path work early after a yield-stride sweep came back flat, and concluded that cheap-path latency could not convert into score. A teammate's bracketed head-to-head later put our frozen build 11.9% behind his and pointed at exactly that. Our sweep had never tested a stride of 256, and it predated the admission gate entirely, which mattered because the gate recycles refused requests into cheap traffic. Retested at the operating point that now existed, it was worth +2.0%. The verdict was superseded rather than wrong, and that distinction is the most useful thing we learned all week.
The grading box might not have the instructions we optimised for. Losing SHA-NI would have cost us a fivefold haircut. We vendored a 16-lane AVX-512 kernel that engages only when SHA-NI is absent, taking that regime from 812,074 to 3,255,335 (4.0x), and verified the gate stays provably silent on hardware where it must not fire.
What we learned
- The error budget is a resource, not just a limit. In a closed loop, a fast rejection releases a blocked client that then issues around five cheap requests. A quick 503 is worth score. We ship at 0.86% of a 1% gate deliberately, with the budget derived from the declared threshold and capped by construction so no knob can cross it.
- Optimise the constraint, not the thing you understand best. Making the cheap path faster produced no score at all until the gate changed what the constraint was.
- A measurement without a noise floor is an anecdote. Bracketing every comparison was more work and it is the only reason we trust any of the deltas.
- Correctness gates before speed gates. A faster wrong answer scores zero. Wiring the differential test into the image build meant we could be aggressive in the hot loop without being reckless.
Accomplishments we are proud of
Four hardware regimes tested, and all four pass every latency bar: separated load host (4.79M), co-located generator (3.18M), no SHA-NI with the vector fallback (3.26M), and no vector path at all (842k). The score varies fivefold. The discipline does not move.
And the rejections. Six ideas were built, measured properly, and thrown out, including a newer Go toolchain we were certain would help, profile-guided optimisation, and a 16-lane kernel that won on a microbenchmark and went flat under real queue dynamics. Every one is recorded on the same terms as the wins.
What's next
Re-bracket the headline on the exact shipped commit, re-run the 2x overload exhibit on the current gate rather than the earlier champion, and finally measure /stats, which is 36% of the score and the one endpoint we never ran an experiment against.
Built With
- amazon-ec2
- amazon-web-services
- assembly
- avx-512
- aws-cloudformation
- bash
- cgroups
- docker
- docker-compose
- git
- go
- http
- javascript
- json
- k6
- linux
- load-testing
- node.js
- pprof
- python
- rest-api
- sha-256
- sha-ni
- simd
- x86

Log in or sign up for Devpost to join the conversation.