-
-
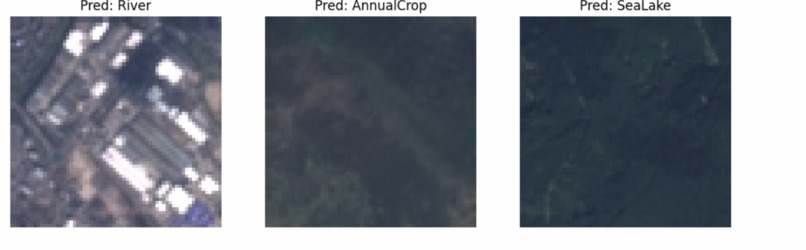
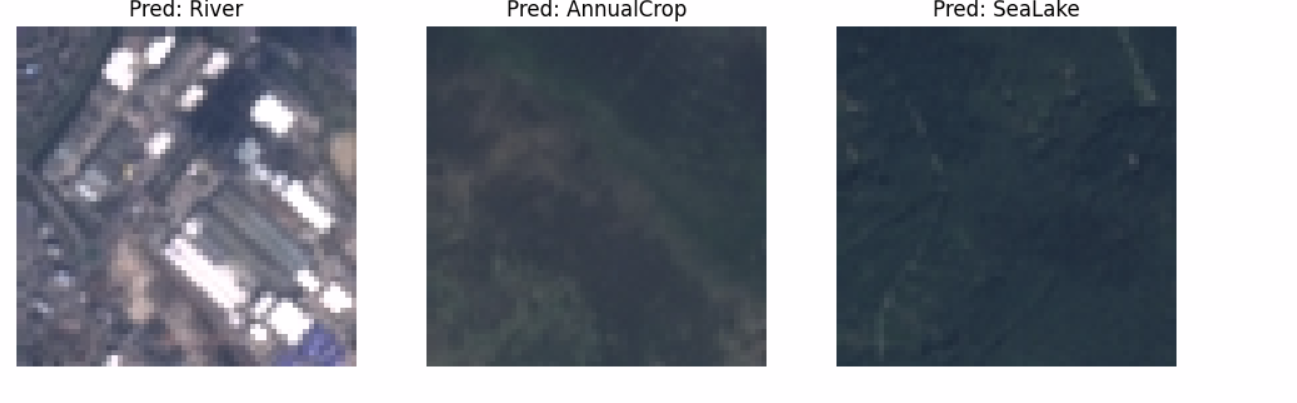
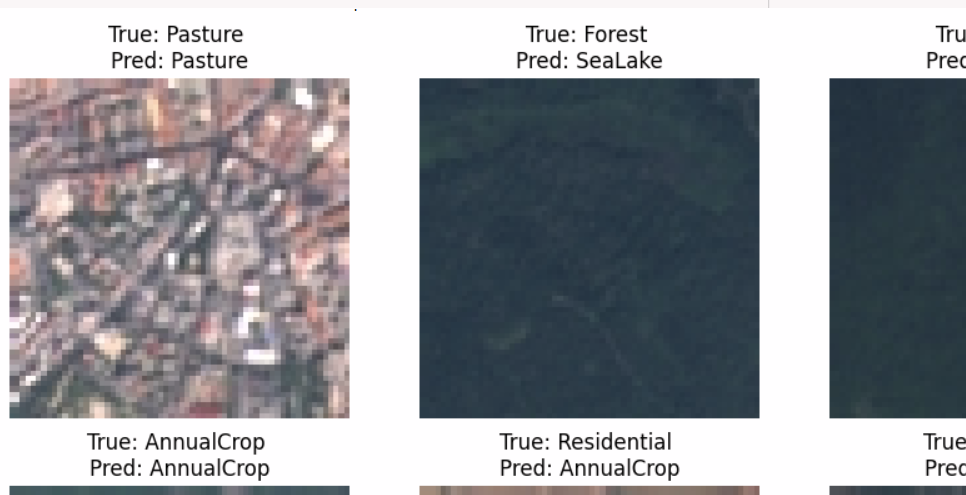
predictions using satellite data
-
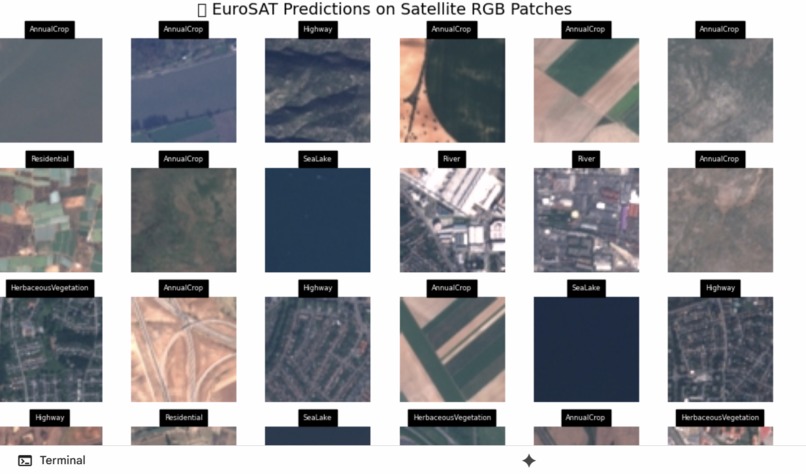
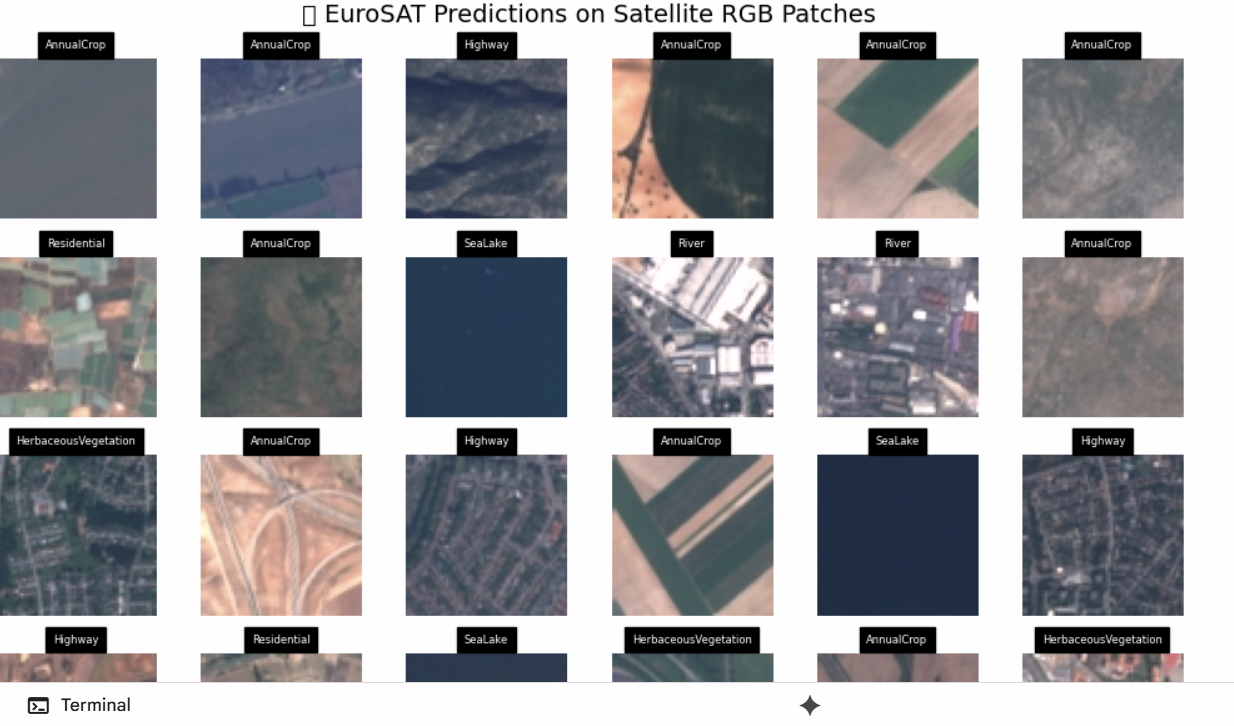
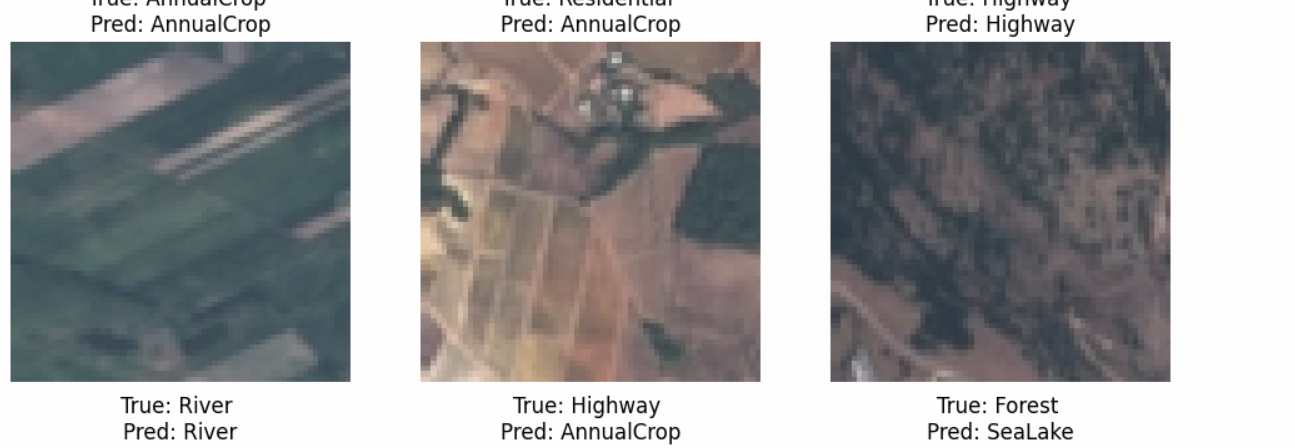
EuroSAT Predictions on satillite rgb matches
-
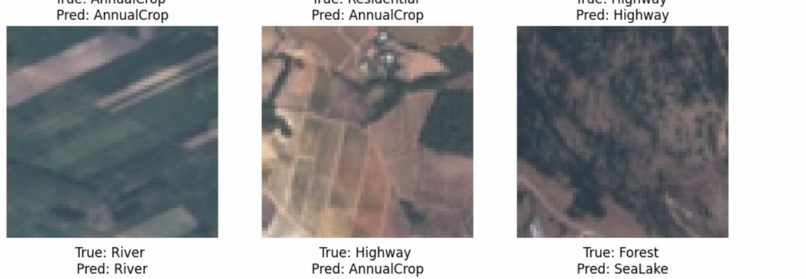
predictions using satellite data
-
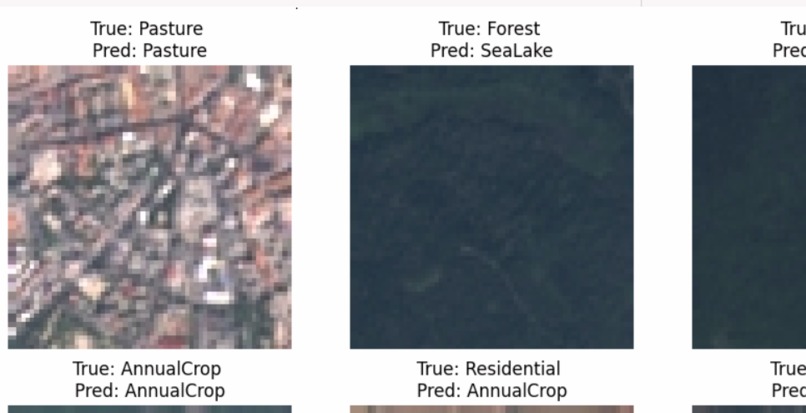
predictions using satellite data
-
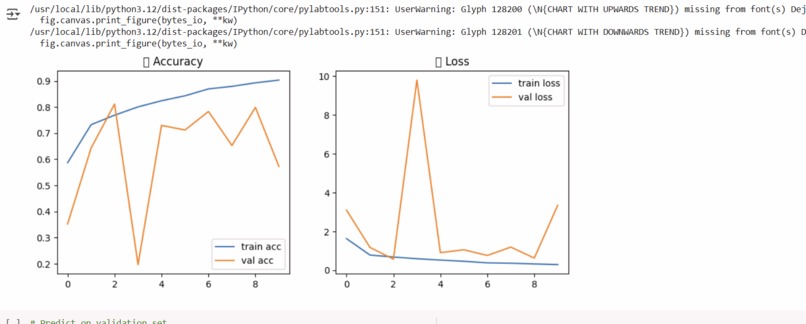
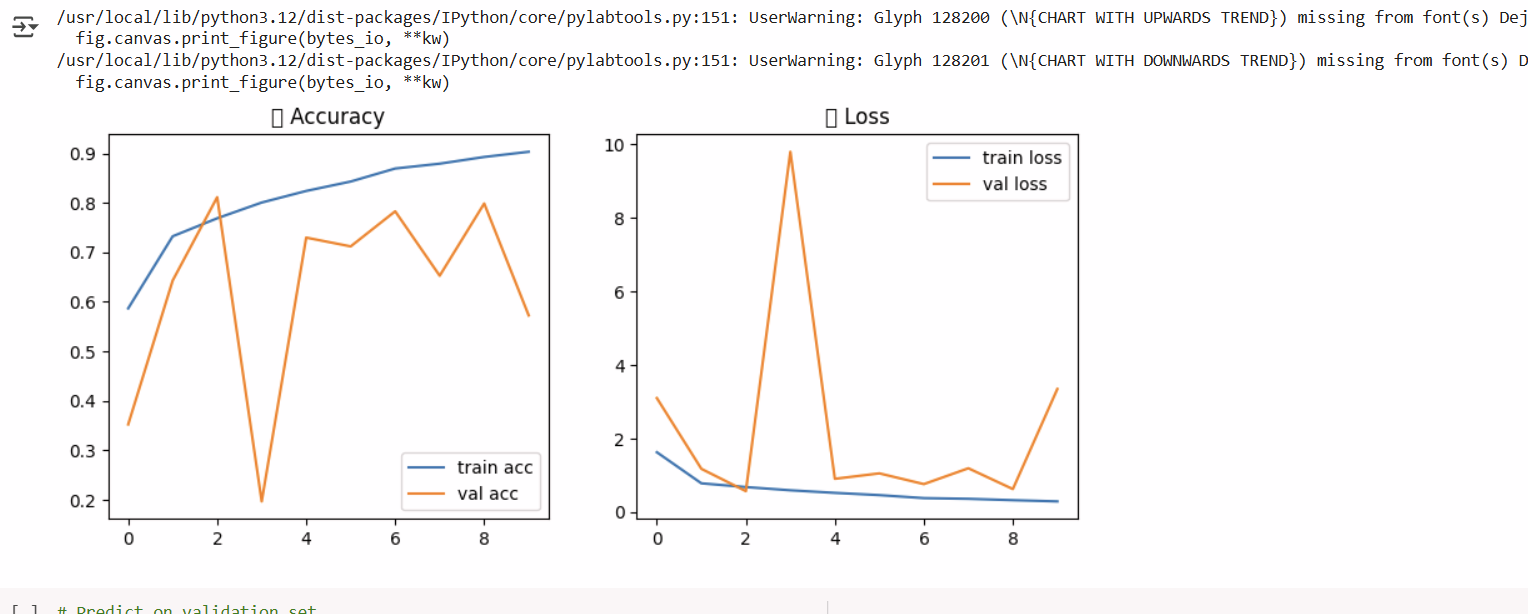
Accuracy and Loss
-
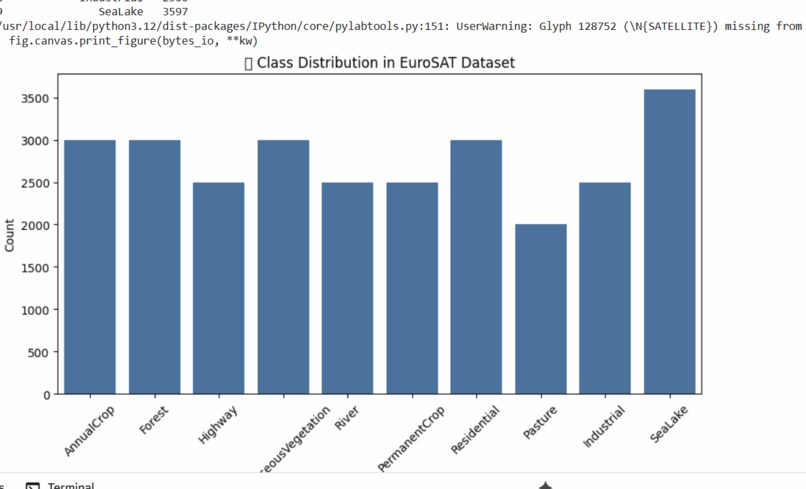
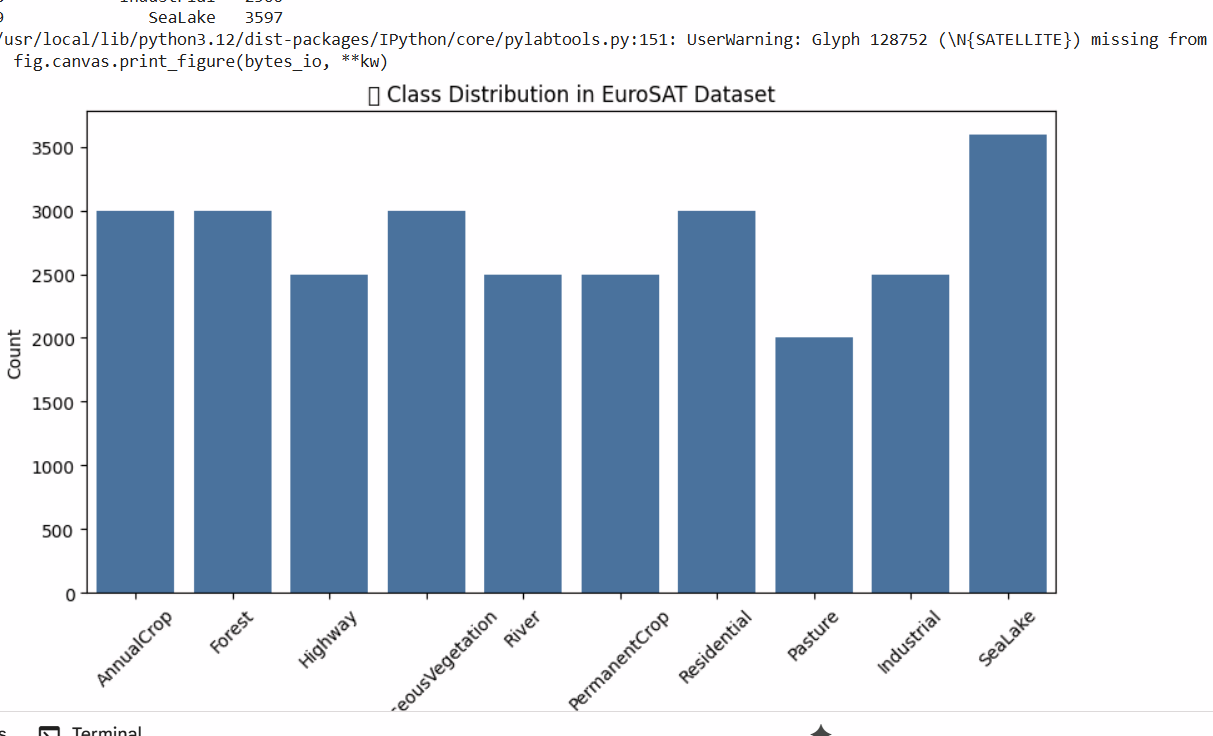
class distribution of EuroSAT dataset
Inspiration
Crop monitoring in India is challenging due to small, fragmented farms and diverse cropping practices. Inspired by the Track 1 challenge, we wanted to build an AI system that can identify crops from satellite imagery and scale to real-world use cases like yield prediction and food security planning.
What it does
AgriVision classifies satellite imagery into different crop/land cover types using deep learning.
- Input: Sentinel-2 satellite patch (EuroSAT dataset).
- Output: Predicted crop/land cover class (e.g., Annual Crop, Forest, Pasture).
- Visuals: EDA heatmaps, class distributions, accuracy/loss curves, confusion matrix, and map-style visualizations of predictions.
How we built it
- Dataset: EuroSAT (Sentinel-2 imagery, 10 land cover/crop classes) downloaded via Kaggle API.
- Data Cleaning & EDA: Removed corrupted images, visualized class balance, generated correlation heatmaps of spectral features.
- Modeling: Trained a Convolutional Neural Network (CNN) with data augmentation for crop classification.
- Evaluation: Accuracy, F1-score, confusion matrix, and prediction visualizations.
- Visualization: Created “map-like” classification grids to simulate land cover maps from model outputs.
Challenges we ran into
- Limited access to real AgriFieldNet/ISRO SAR datasets during the hackathon, so we had to prototype using EuroSAT.
- Handling dataset imbalance across classes.
- Designing visuals that communicate results effectively in limited hackathon time.
Accomplishments that we're proud of
- Built an end-to-end pipeline in Colab: from data ingestion → cleaning → modeling → evaluation → visualization.
- Achieved high accuracy on EuroSAT classes using our CNN model.
- Created intuitive visuals (heatmaps, confusion matrix, colorful map-style predictions) that make the model’s performance easy to understand.
- Demonstrated a clear roadmap to extend to real-world Indian agricultural fields (Track 1 vision).
What we learned
- How to process and analyze satellite imagery for agricultural applications.
- The importance of feature extraction and visualization in understanding geospatial data.
- How small tweaks (augmentation, normalization, dropout) can significantly improve CNN model performance.
- The gap between clean benchmark datasets (EuroSAT) and real, noisy, heterogeneous datasets (Indian farms).
What's next for AgriVision: Smart Crop Detection from Space
- Extend the pipeline to AgriFieldNet India dataset with SAR + optical time-series.
- Explore geospatial foundation models for better generalization across regions.
- Deploy as a web dashboard or Gradio app for farmers, policymakers, and researchers.
- Incorporate temporal satellite data (multi-season, multi-date) for crop monitoring and yield forecasting.
👉 Do you want me to also make a 1-slide summary (Problem → Solution → Results → Roadmap) for your hackathon pitch?
Built With
- accuracy-curves
- classification-report)-pandas-&-numpy-?-data-handling-&-preprocessing-matplotlib-&-seaborn-?-visualization-(heatmaps
- googlecolab
- kaggleapi
- keras
- matplotlib
- numpy
- opencv
- pandas
- pil
- python
- scikit-learn
- seaborn
- tensorflow


Log in or sign up for Devpost to join the conversation.