-
-
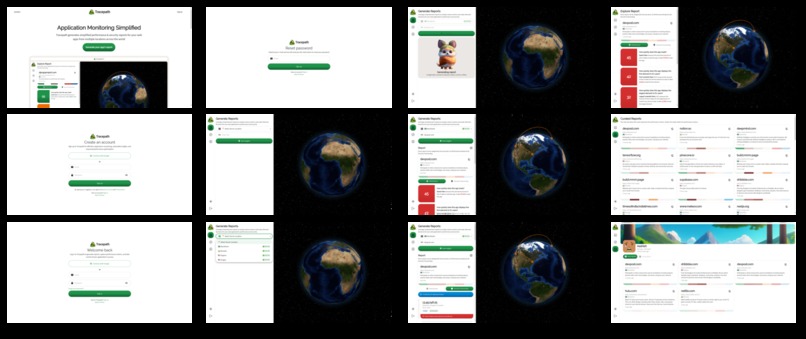
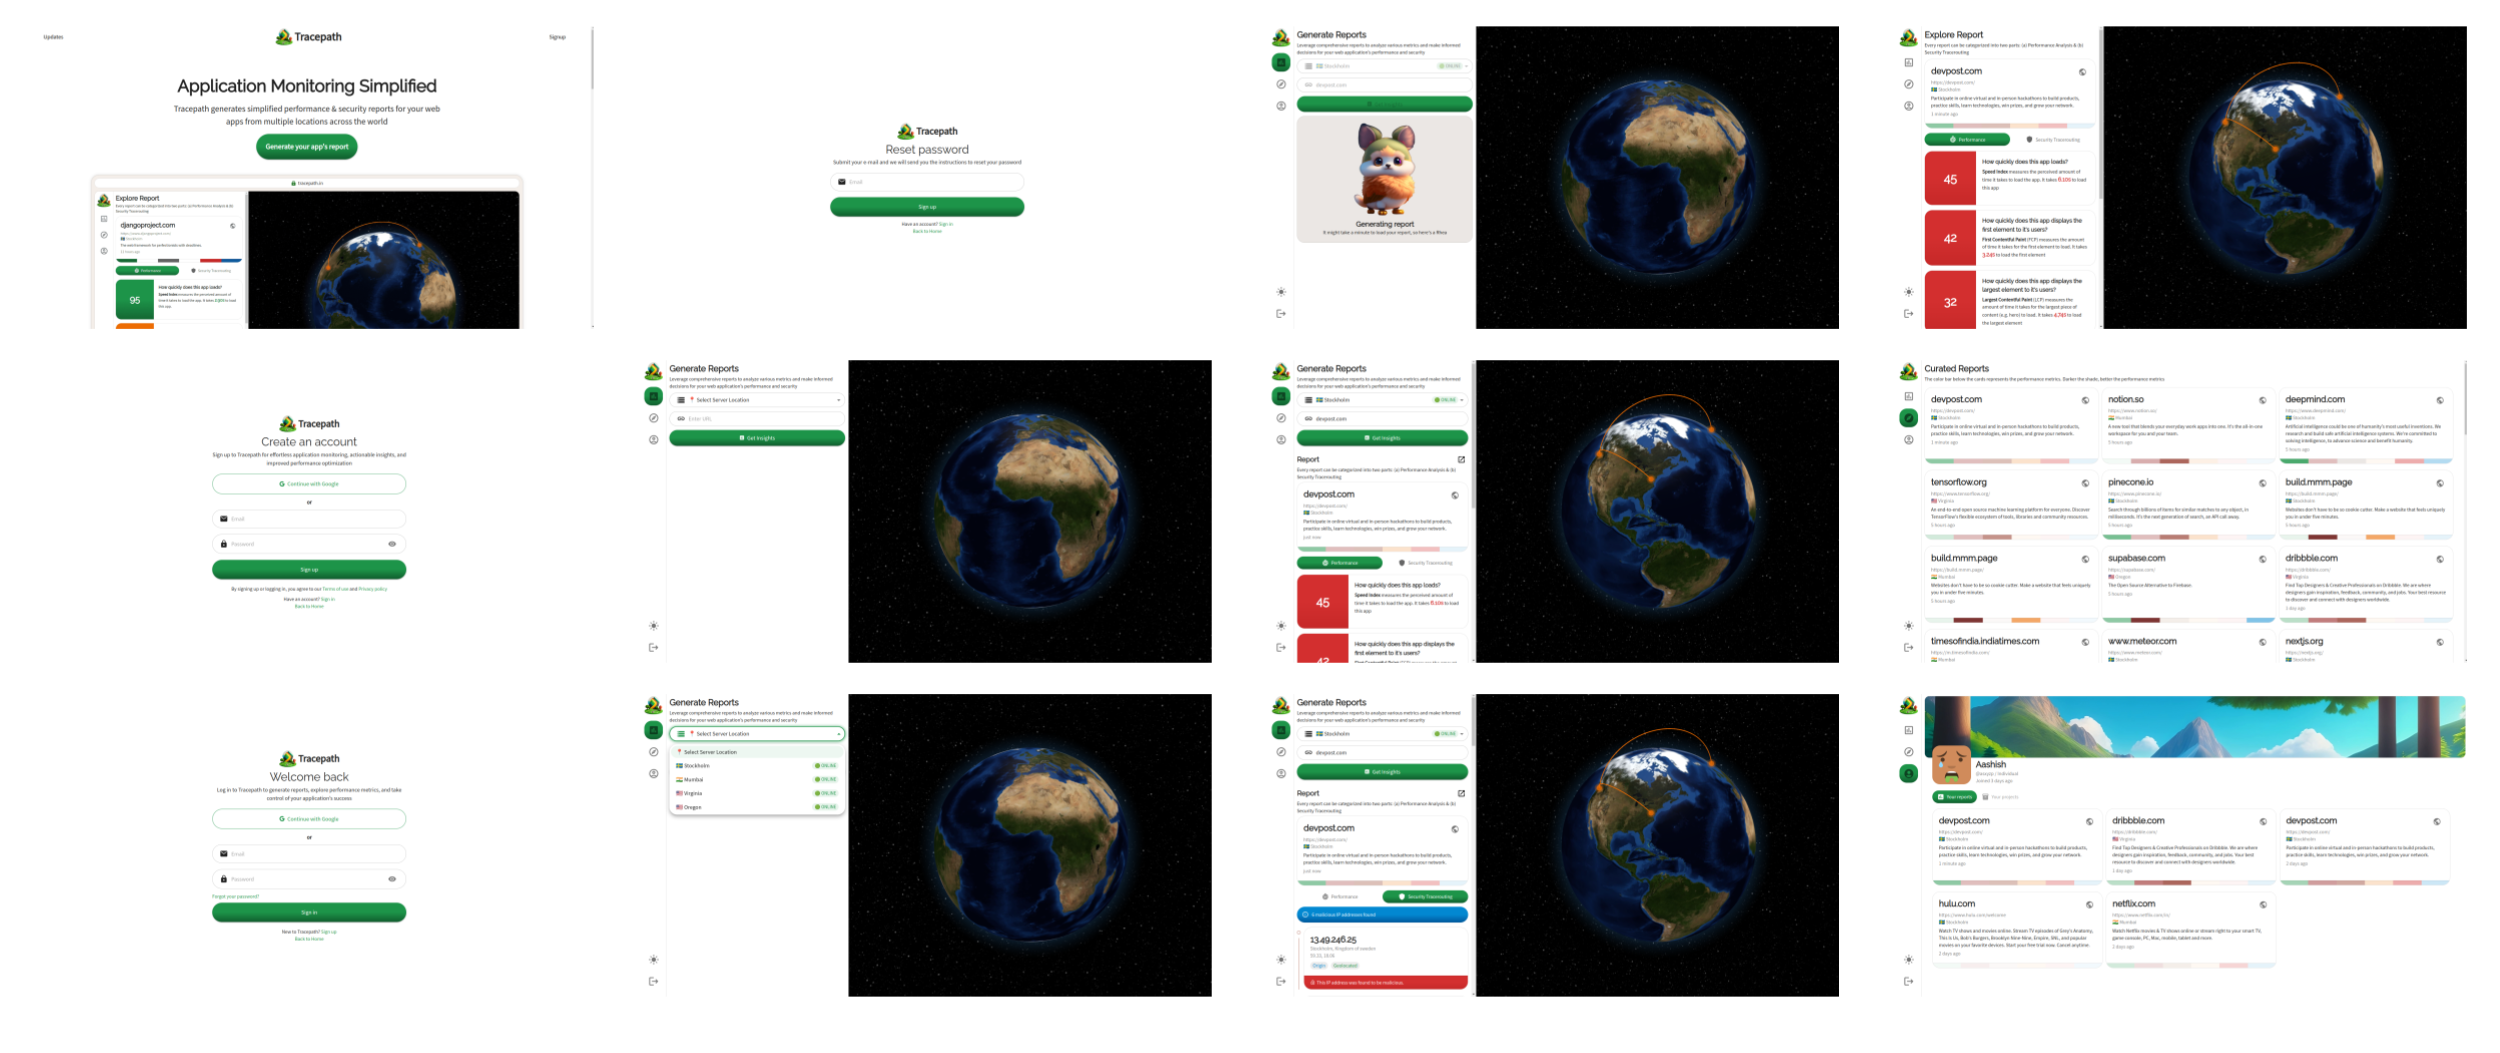
Collage of screens
-
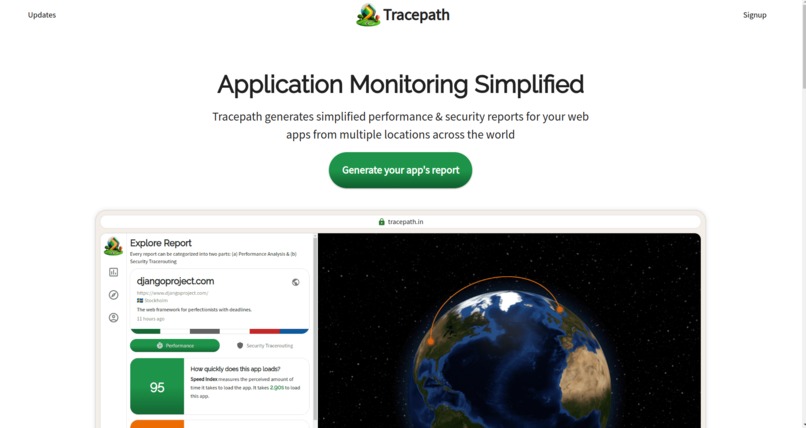
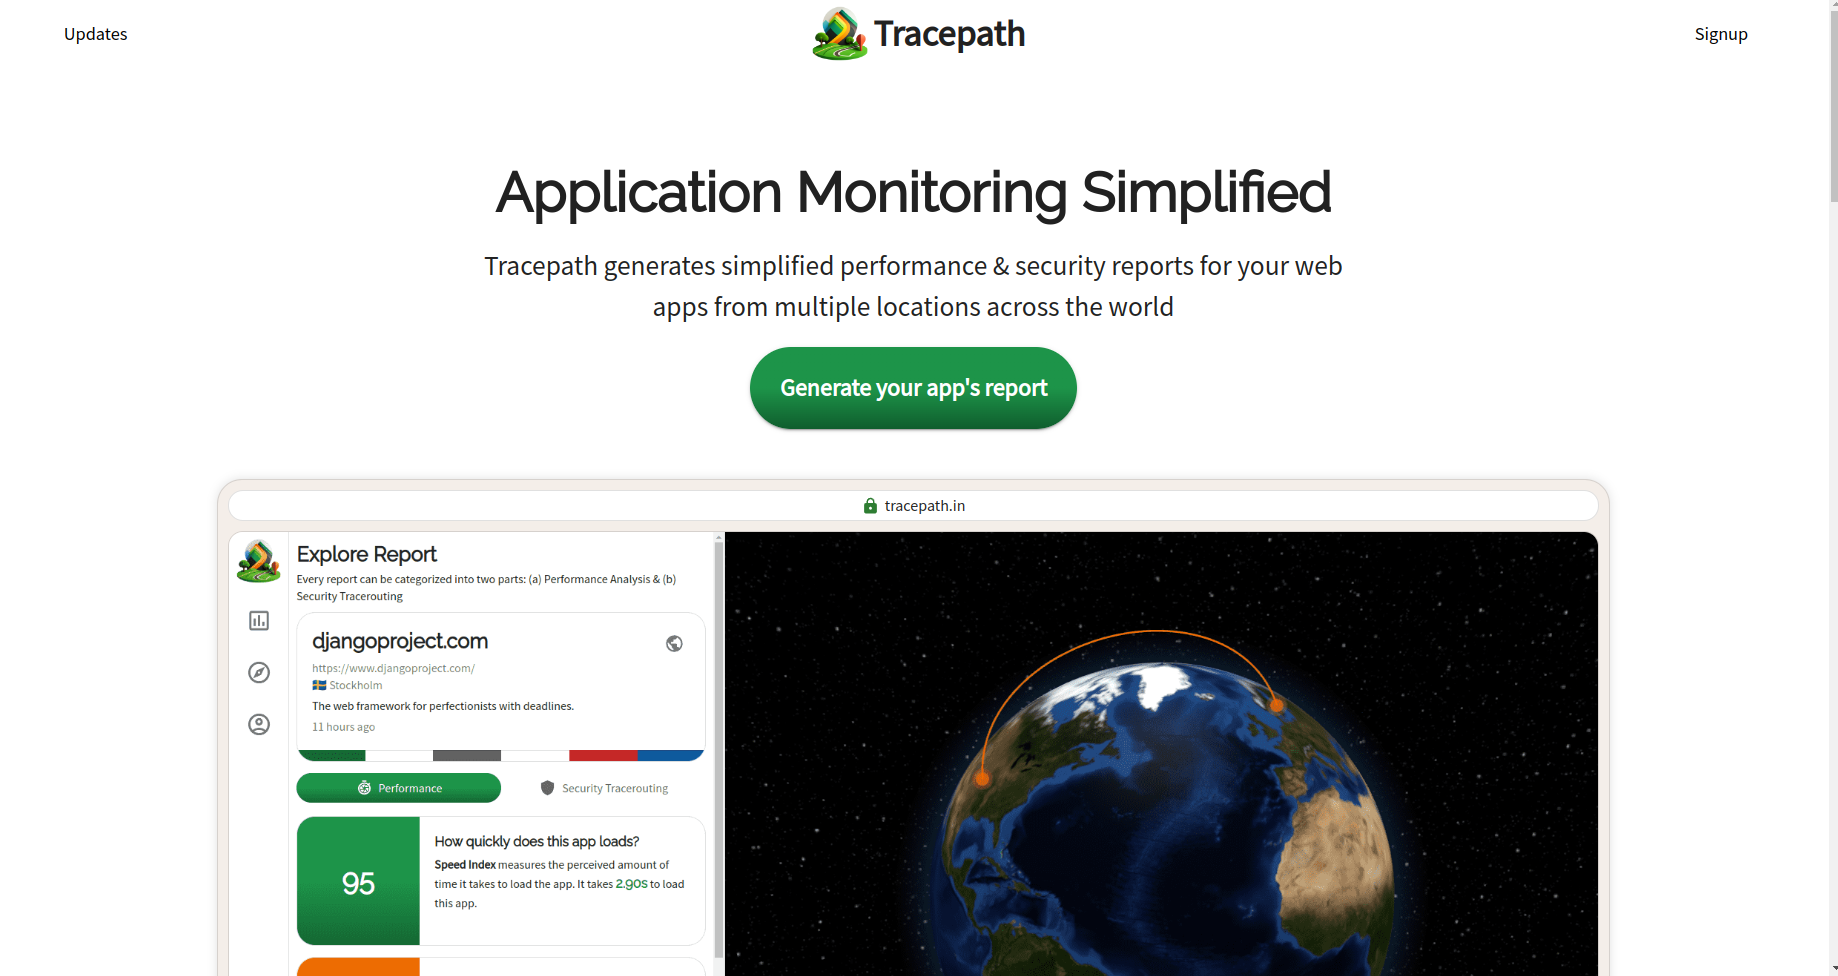
Landing page
-
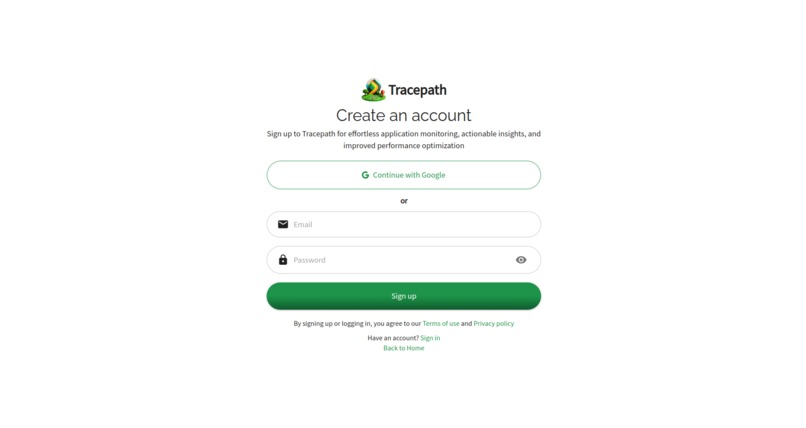
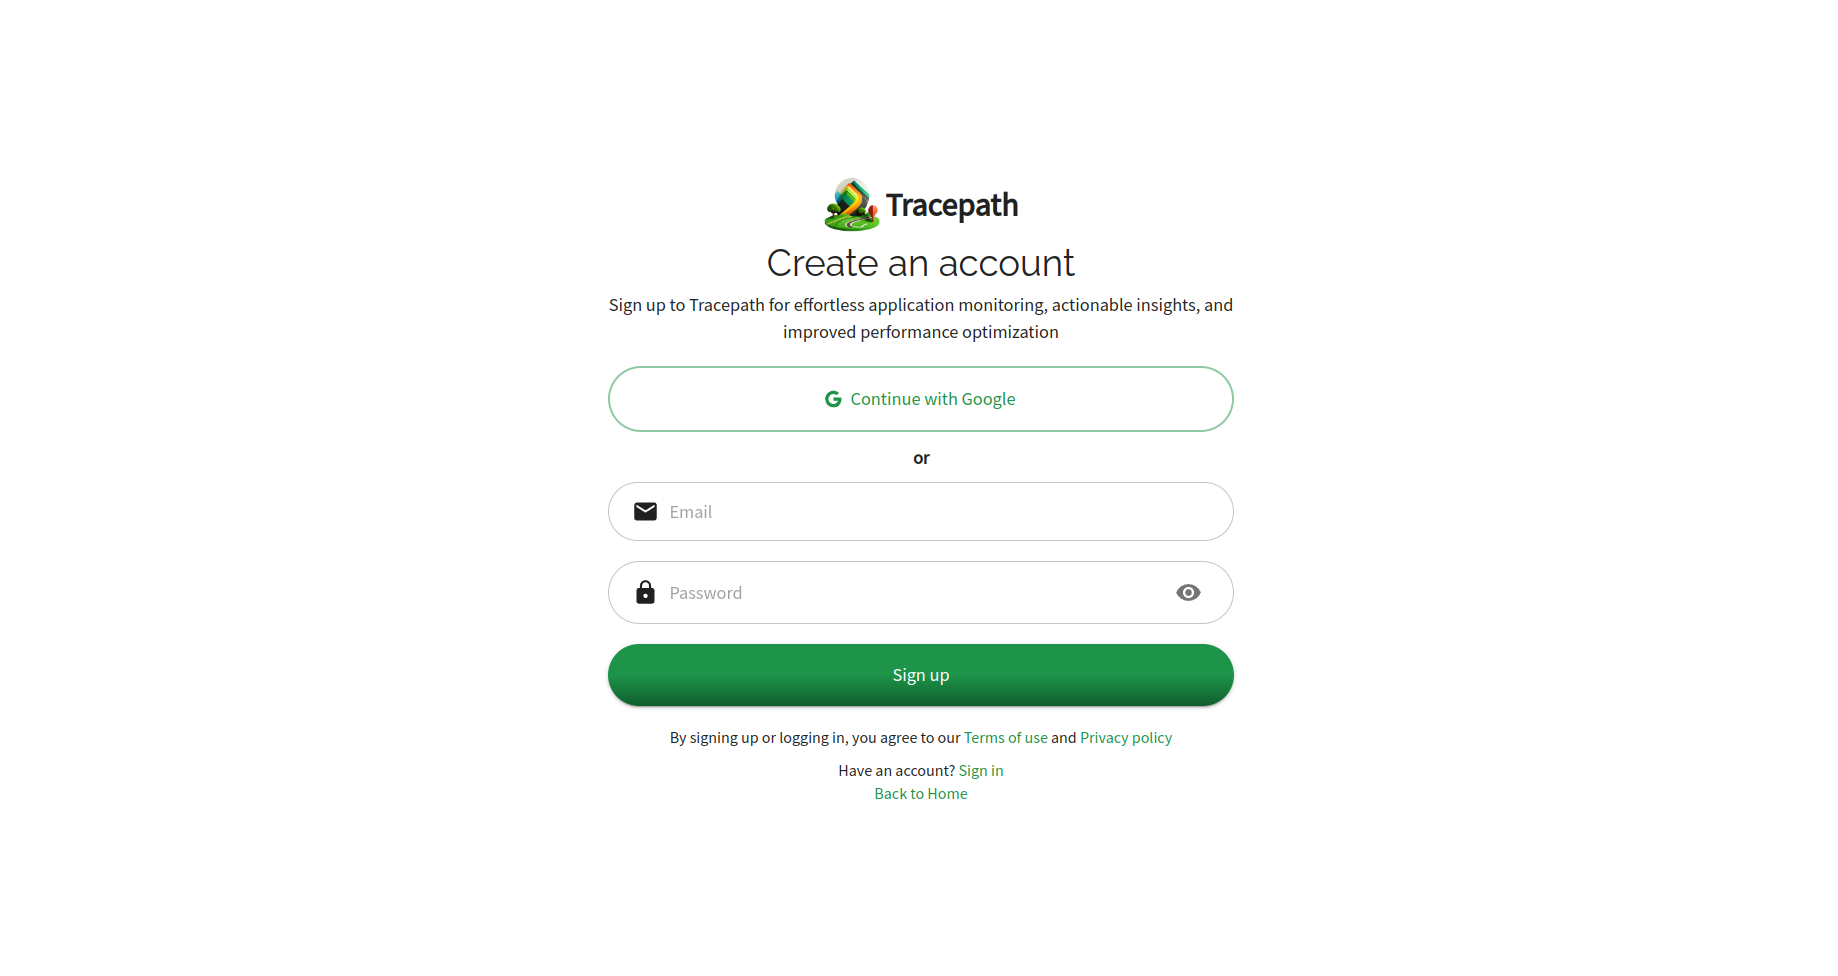
Signup page
-
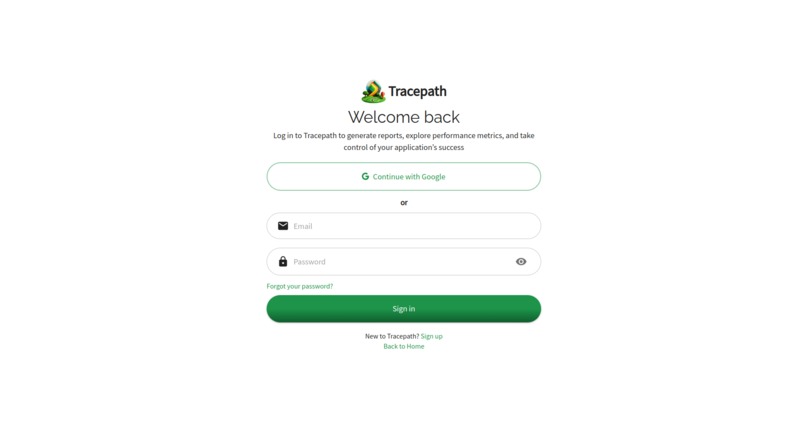
Login page
-
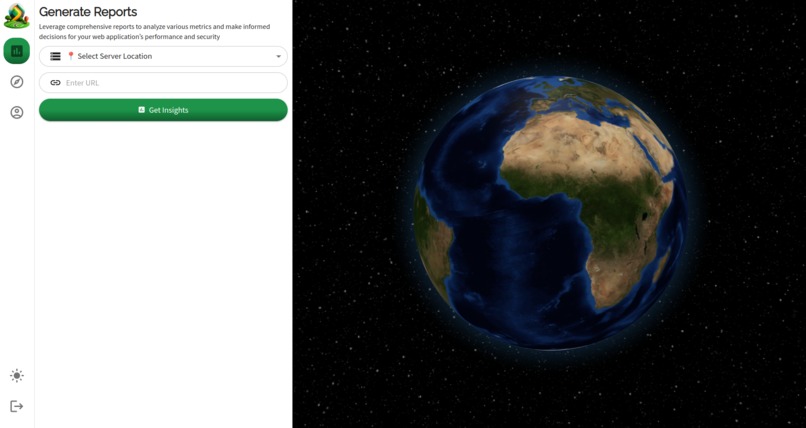
Generate report screen in empty state (i.e. when no report is currently being generated)
-
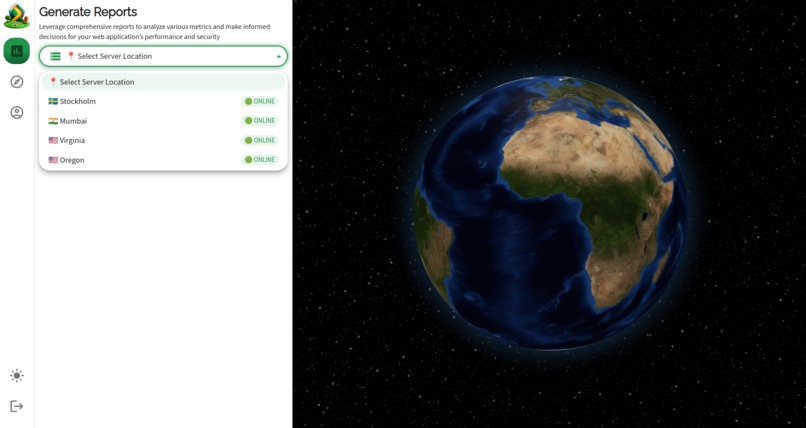
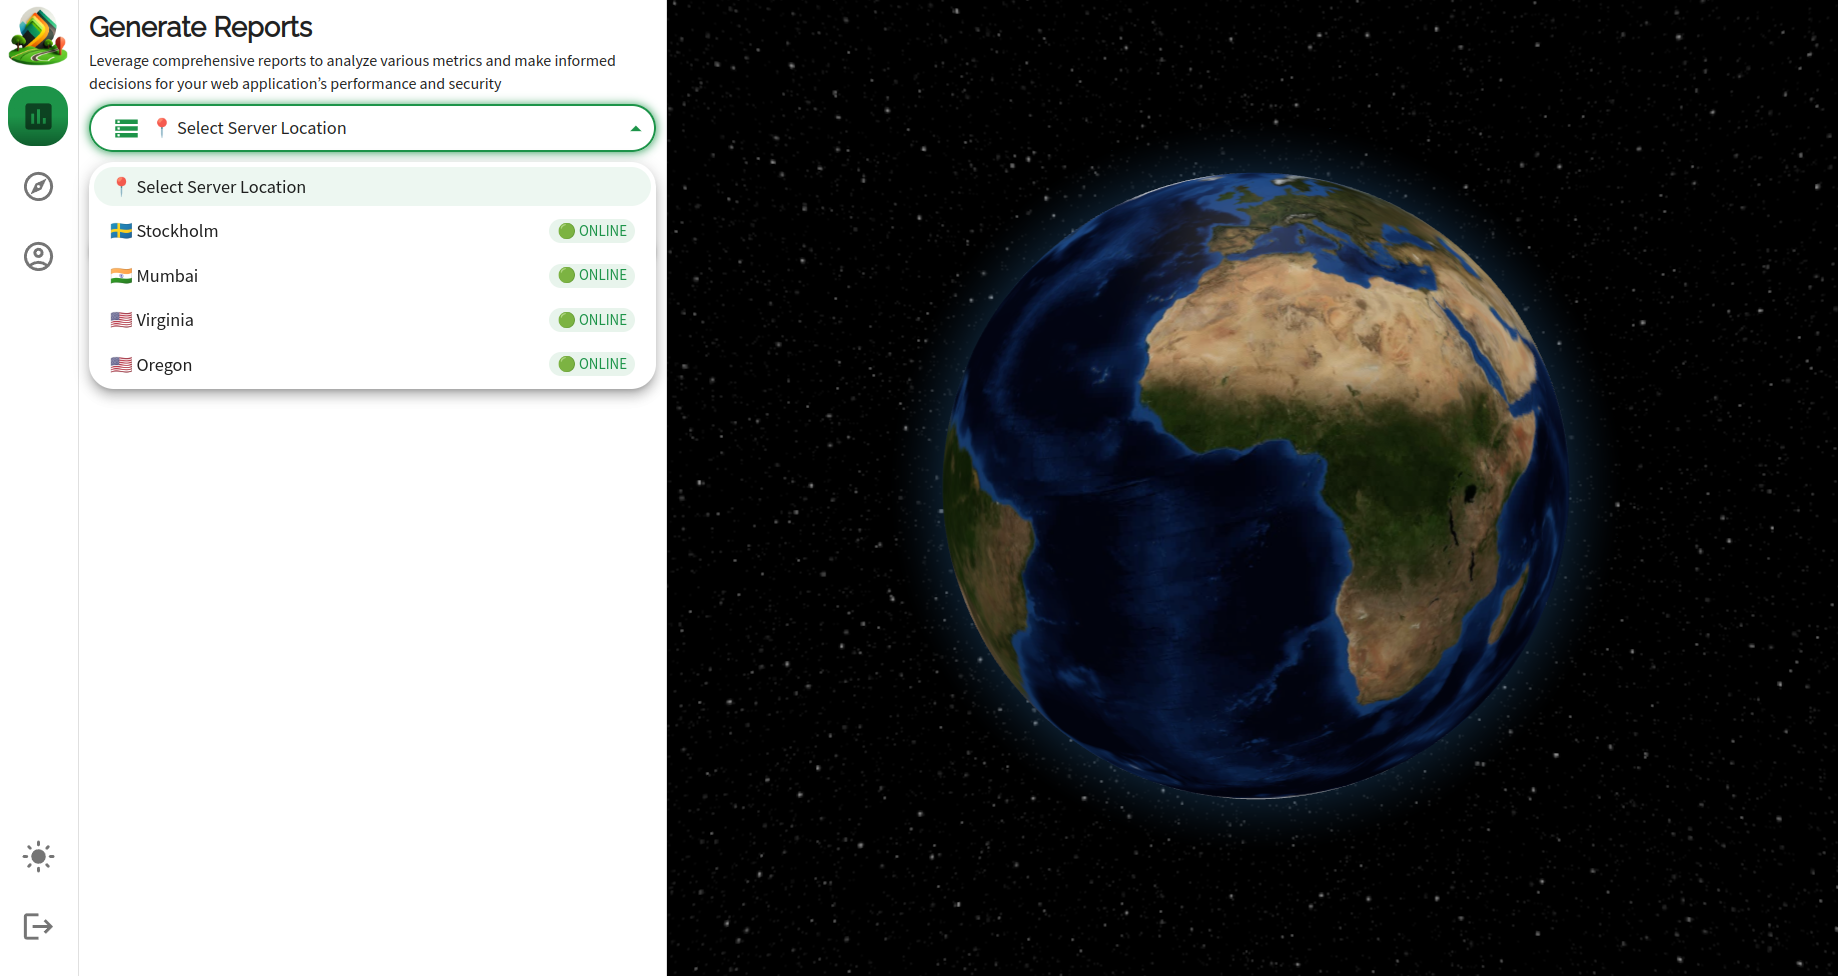
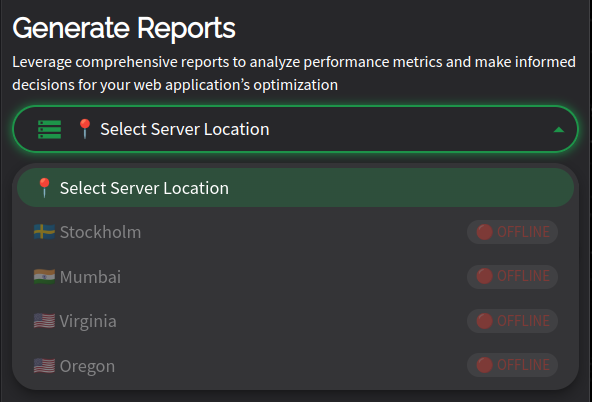
Generate report screen with diagonostics server selection dropdown which allows to select the diganostics server for report generation
-

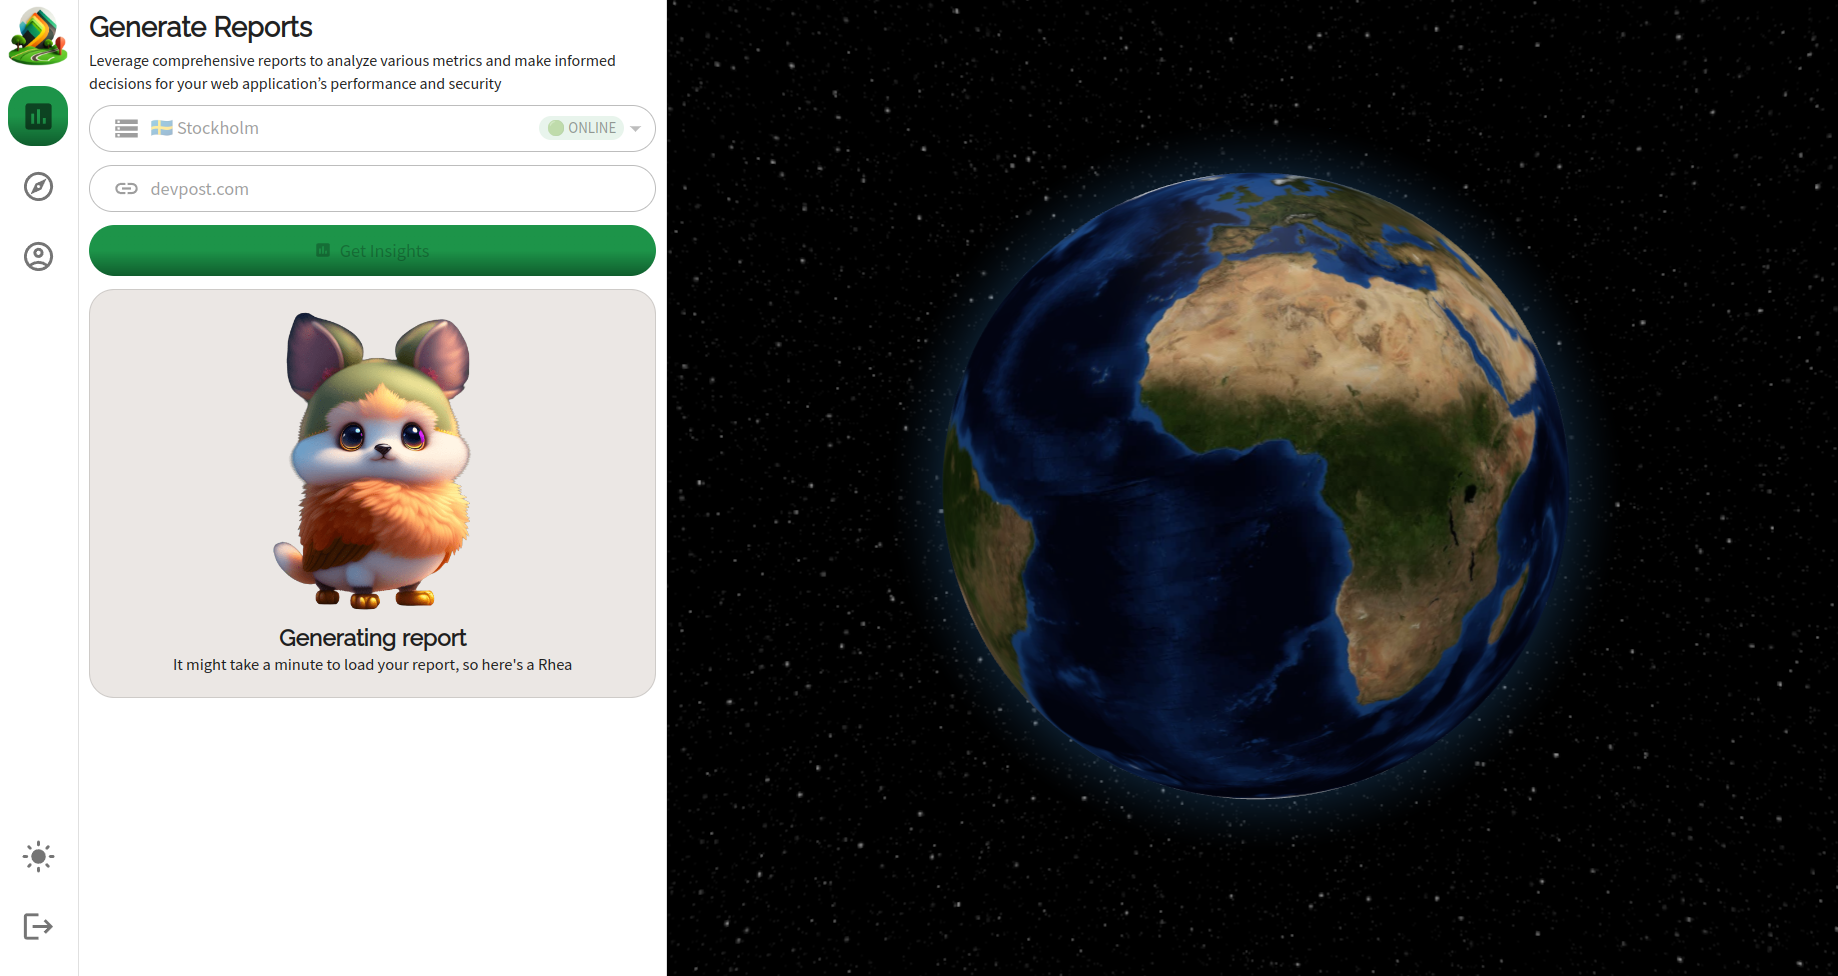
Generate report screen when the report generation is in progress
-

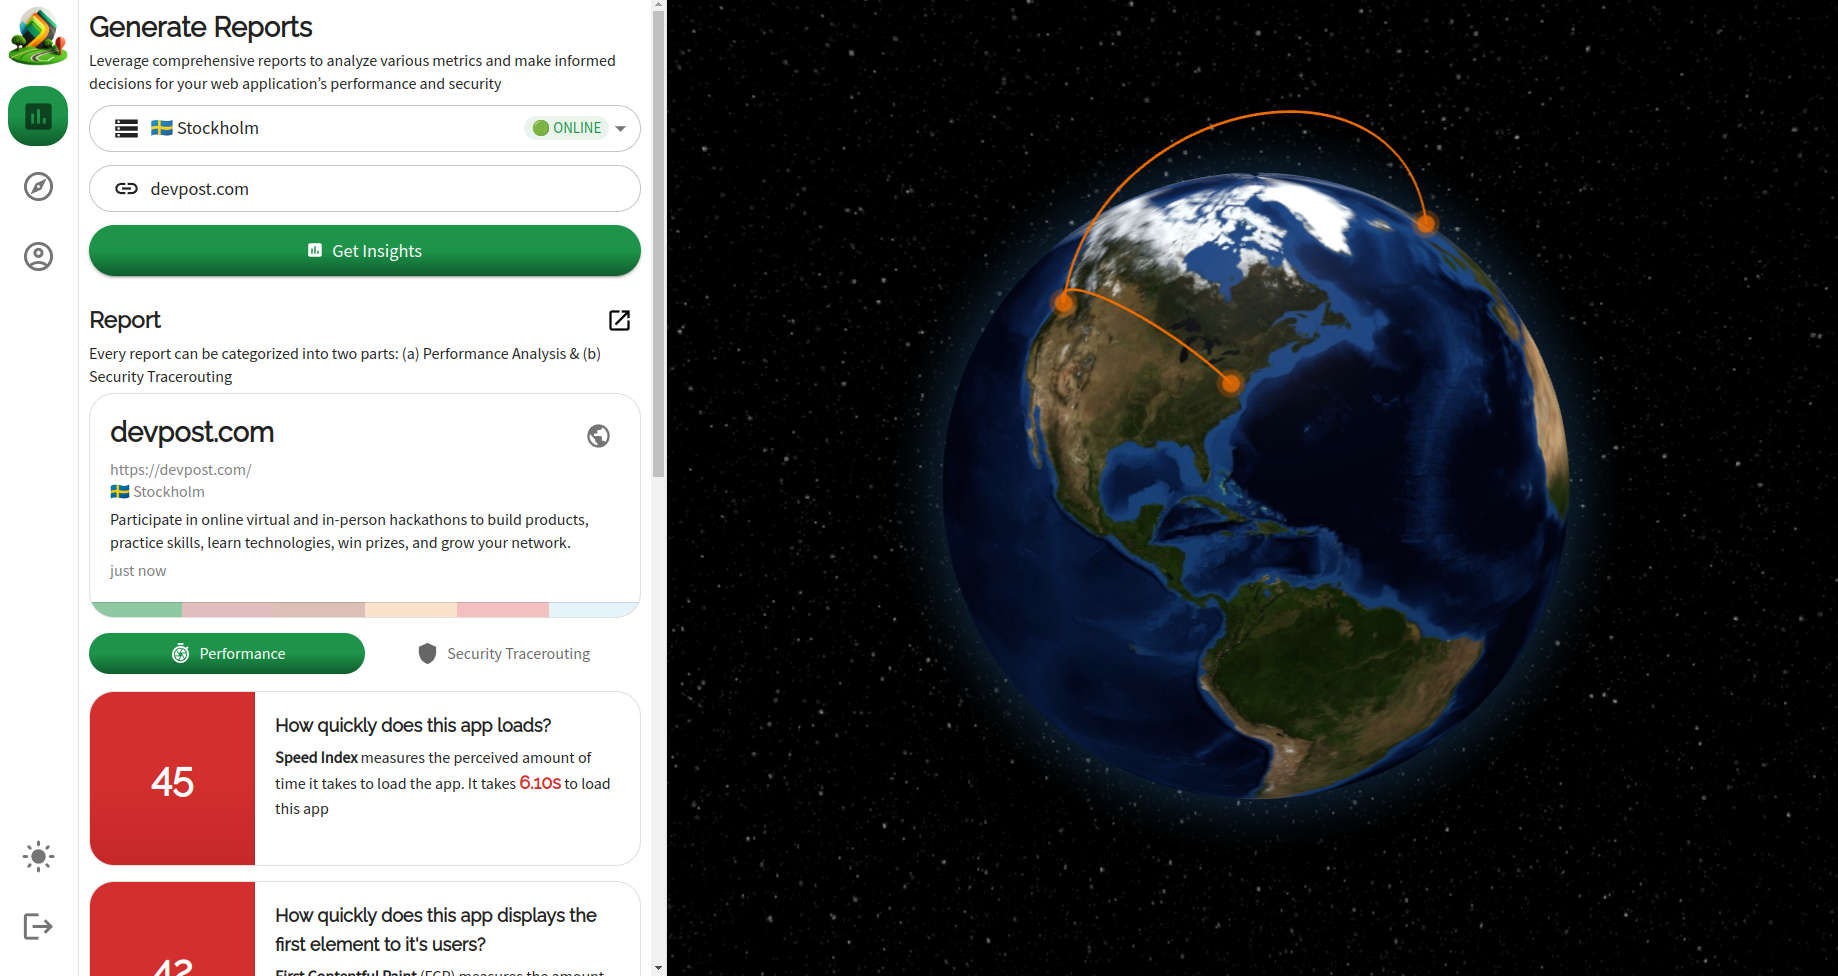
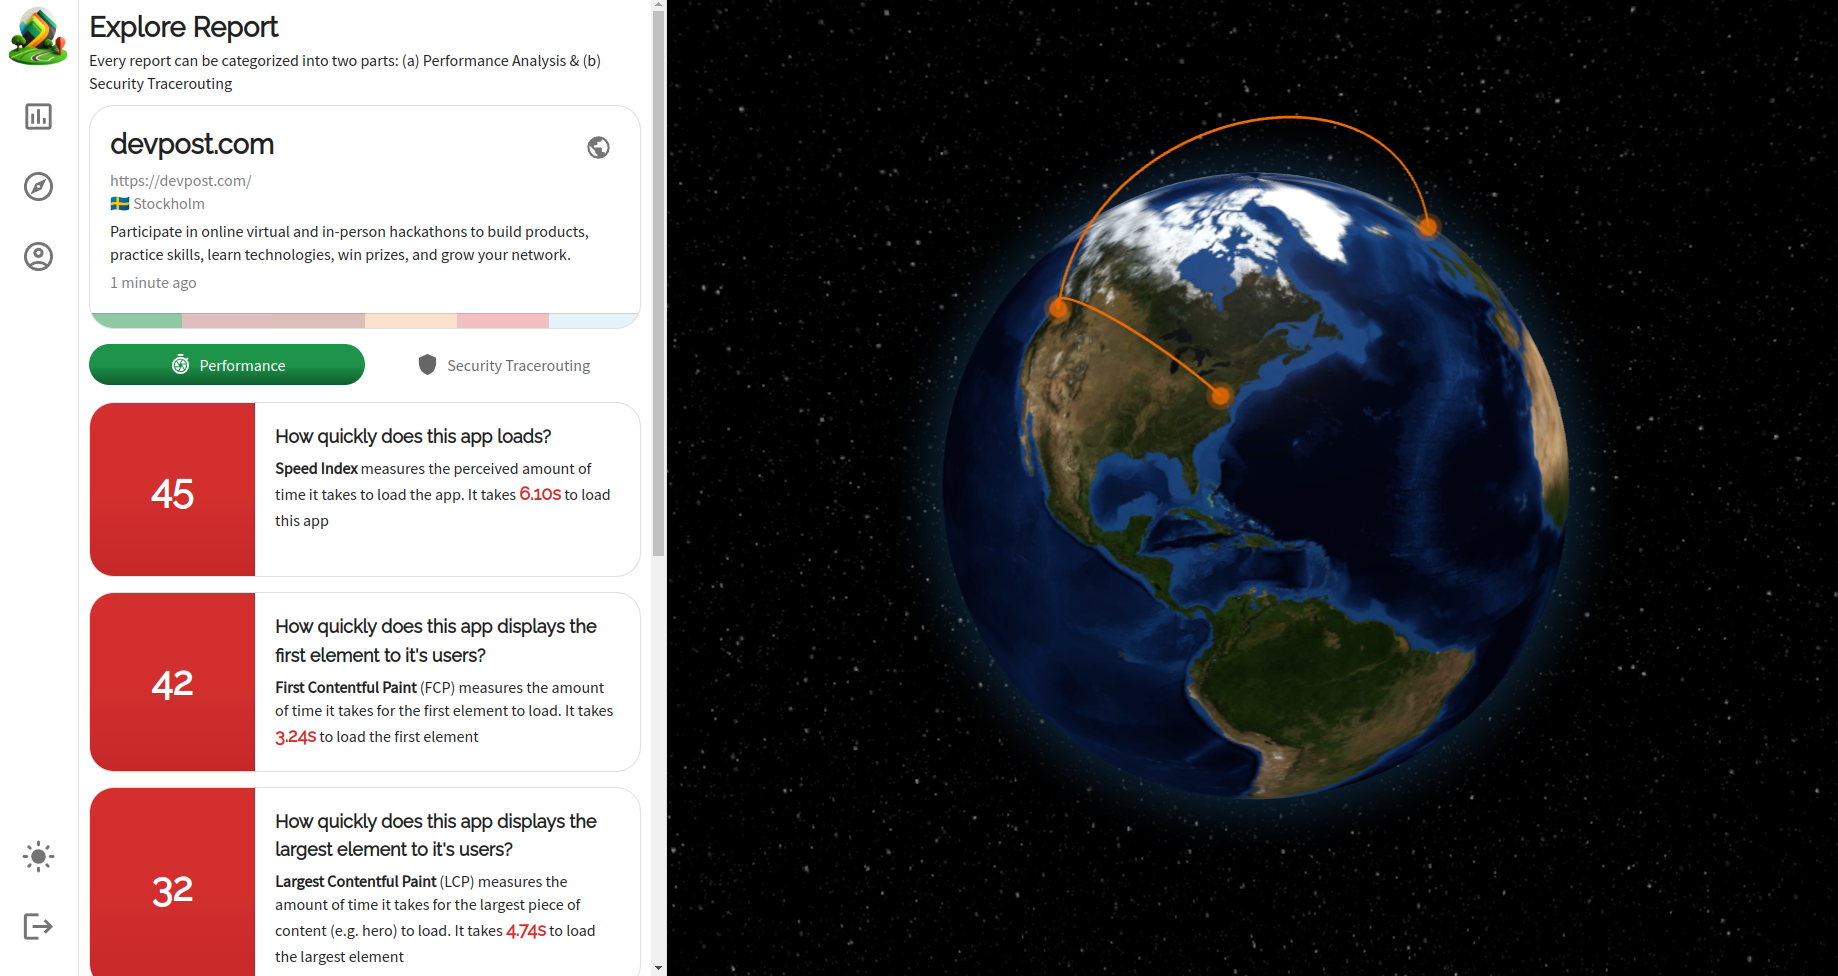
Generate report screen with the performance section of new report, after a new report has been generated
-
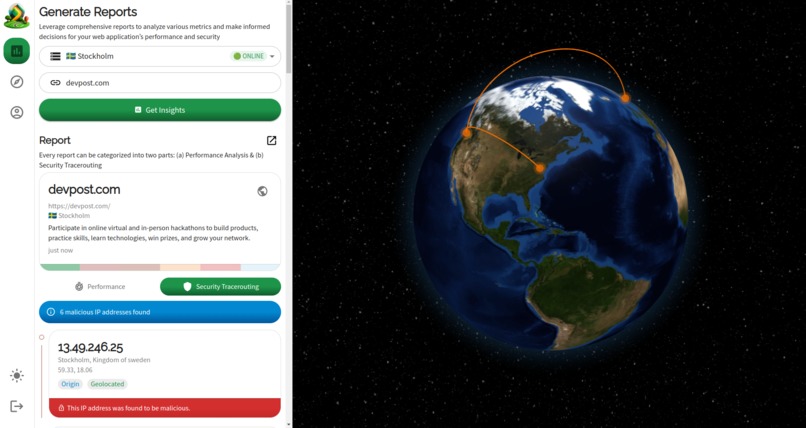
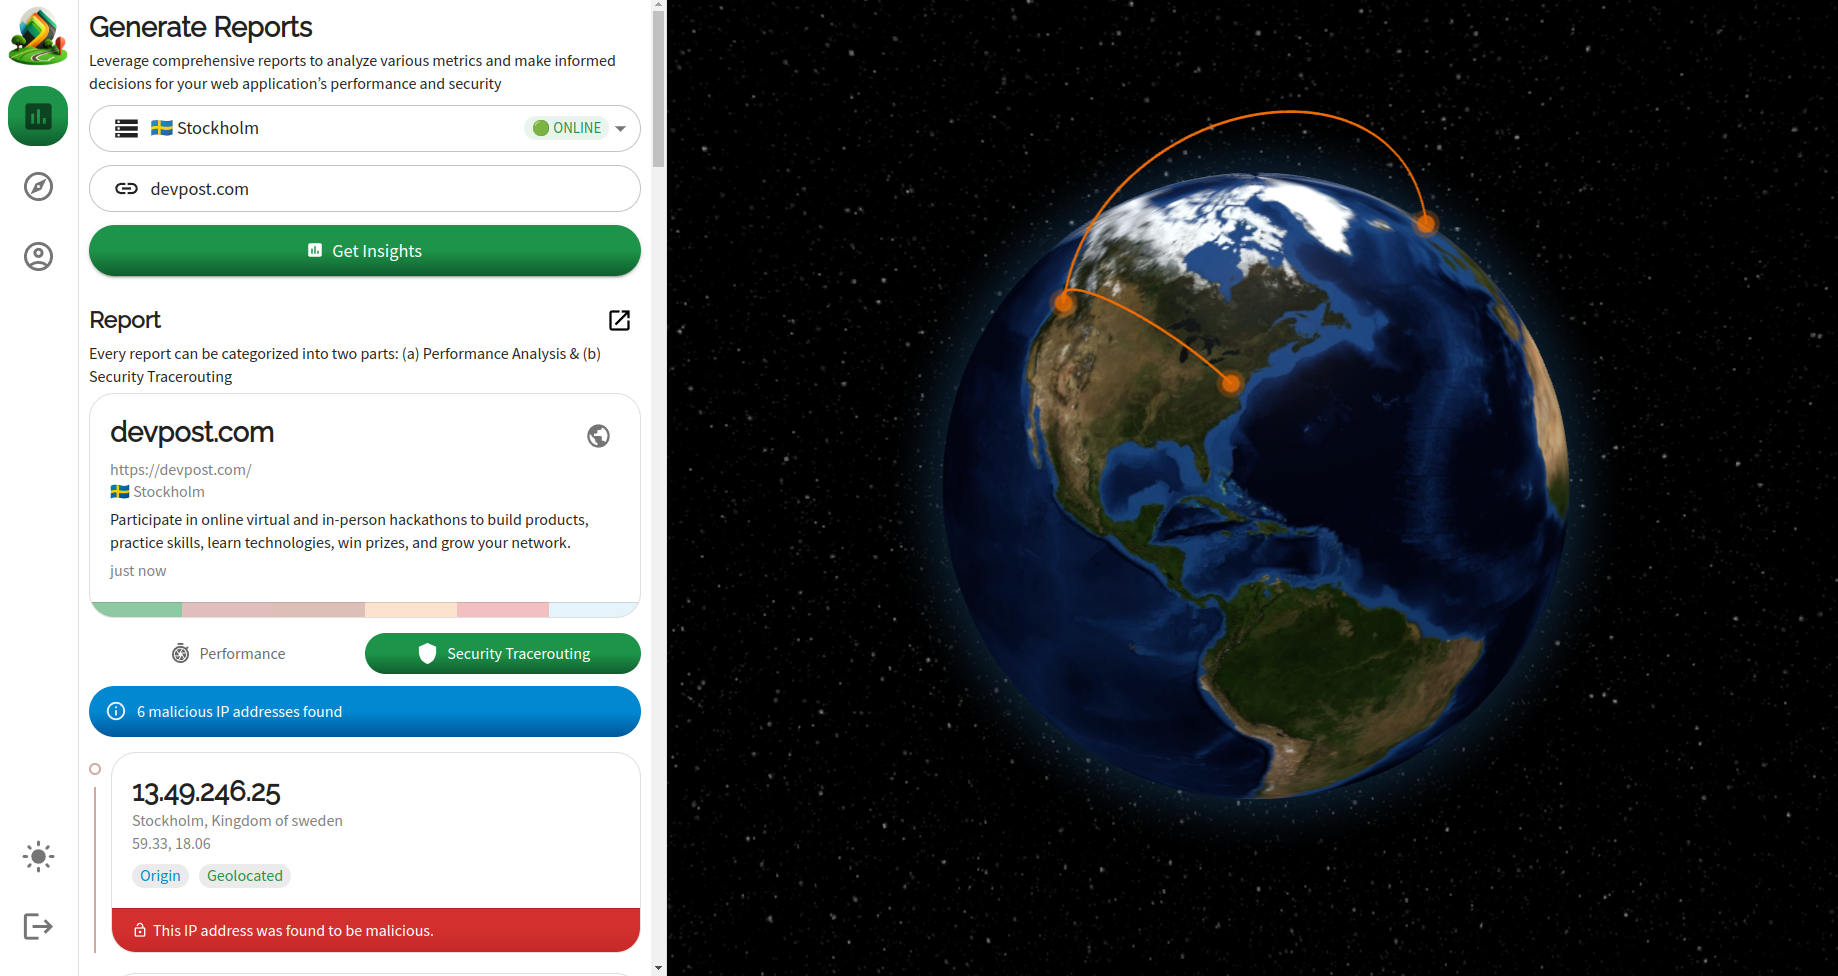
Generate report screen with the security tracerouting section of new report, after a new report has been generated
-
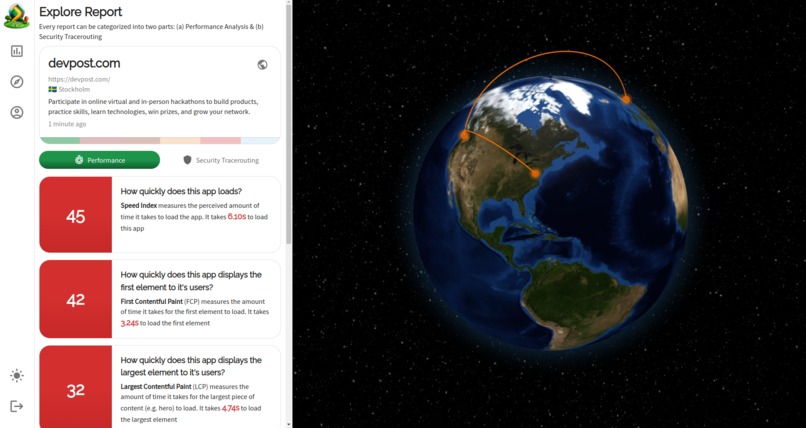
Explore report screen to view an individual report
-
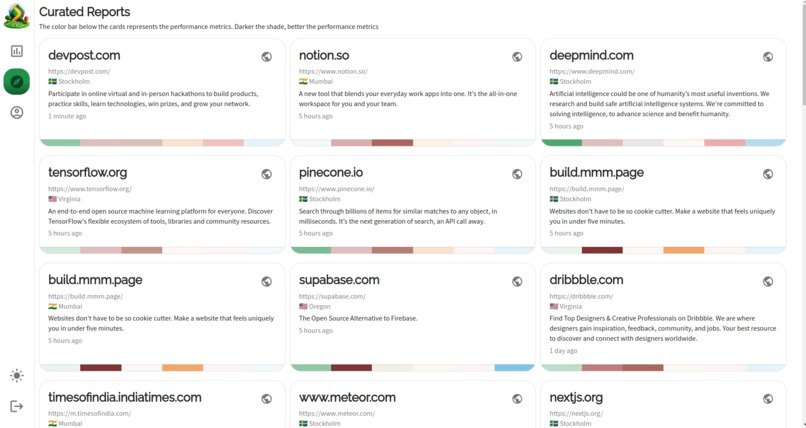
Curated report screen
-

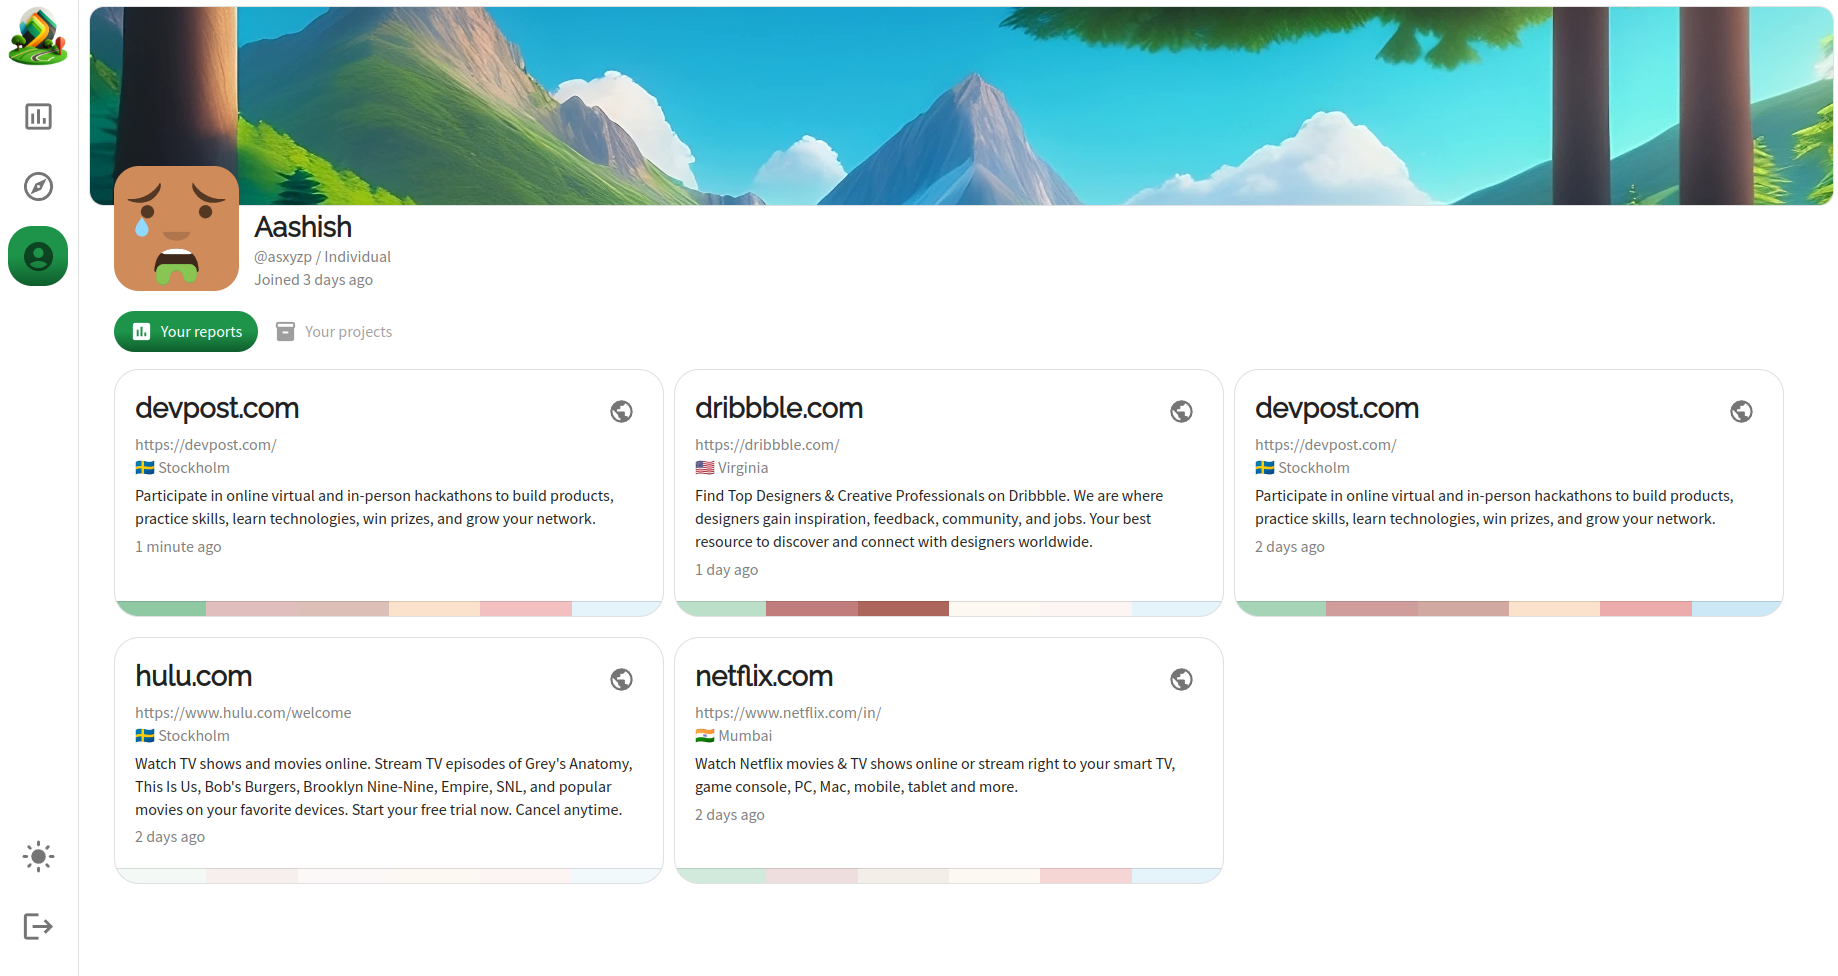
User profile screen


Introduction

Tracepath.in is an open-source application performance and security monitoring system. Currently, for any given web application's URL (e.g., pangea.cloud), it generates a report consisting of two parts:
Performance analysis, which contains the web application's performance report generated against one of Tracepath's diagnostic servers (refer to the
tracepath-diagnosticsrepository for details). These servers run on a cloud instance deployed at a specific location (e.g., Mumbai, Stockholm). The performance analysis is conducted using Google'slighthousetool running on a headless Chrome browser. However, unlike a typical Lighthouse report, Tracepath presents the performance metrics in a jargon-free form that can be easily understood by non-technical stakeholders of a project.Security tracerouting, a unique feature offered by Tracepath, helps visualize the routing path of packets along with their geographic location and IP reputation score to identify malicious IP addresses through which the IP packets might be passing. It combines tracerouting, IP geolocation, and IP threat/reputation intelligence.
How I built it
The development of Tracepath can be broken down into three parts:
Exploration: I've been wanting to build this app for a while now, but initially, I didn't understand how all the parts would fit together. For example, I knew about Tracerouting but didn't know how it worked internally (i.e. using incremental TTL values) or how lighthouse could be triggered programmatically or what many of the performance metrics even signify. Figuring these out, took about a week's time, in which I ran through a whole bunch of tests.
Diagnostics Server Development: Once I'd figured out the basics of generating performance reports programmatically using lighthouse on a headless Chrome browser and using tracerouting along with Pangea's IP geolocation endpoint. The next step was to take the code I'd written in these tests into an Express.js server. I used
express-generatorto generate boilerplate code for the diagnostics server which contains two API endpoints:/api/status, which is a GET endpoint to check whether the diagnostics server is up and running, which can be seen in the "Generate Report" screen (See the screenshot attached below) and/api/report, which is a POST endpoint to generate the report. And finally, I also integrated it with the IP Reputation endpoint to complete the Security Tracerouting feature. This took about a week to develop and perhaps one or two more days to figure out its deployment.Application Client & Server Development: Once the initial version of the diagnostics server was developed, I started working on the application client and server which is developed using Redwood.js, which is a full-stack framework which helps in setting up the application quickly through its scaffolding command which generates CRUD GraphQL endpoints and it's equivalent pages based on the Prisma ORM schema. Once the scaffolding was done, then it was more about developing the individual screens and components and replacing the original business logic on the application server generated by Redwood with the custom logic. This took about 2-2.5 weeks to complete, including the application deployment to tracepath.in.
Challenges I ran into
There are multiple challenges I ran into:
I learnt this in the first week itself that while there are multiple nice wrappers around
tracerouteutil, none of them, actually work directly on a typical server deployment such as a node repl on repl.it or on Render.com or Netlify, because it requires greater administrative privileges to install the util (e.g.sudo apt-get install traceroute). Even sloppy tracerouting (e.g. https://gist.github.com/liamgriffiths/9064335) doesn't work on a typical server deployment because of firewall issues. So the way around this is by deploying the diagnostics server on a cloud instance & even figuring that out took a day because I'd never used a cloud instance before, but AWS Lightsail has a nice interface.I was unaware of lighthouse metrics, what they signify and how to trigger a Lightsail report generation programmatically via a headless Chrome browser. I find it funny, but I tried to deploy the diagnostics server on a 512MB AWS Lightsail instance because it was the cheapest option at $5/mo, but the report generation on the deployed server kept failing. As it turns out, it was running out of memory because the headless Chrome browser on which the lighthouse reports are generated takes more than 512MB. I'd switch to a 2GB instance, which costs $20/mo.
Once the development of v0 of the diagnostics server was done, I started working on the application client and server part, which took significantly longer because I'd pictured the application in my mind in a specific way and it needed to be picture-perfect. I also needed to "fail-proof" the application to an extent and this was hard.
Accomplishments that I'm proud of
If I were to have just shown tracepath.in to myself a year or two ago, I wouldn't have believed that I built this app from scratch in almost a month. I've become a better engineer just by attempting to complete this application within this timeframe. I'm also proud that I was able to break down the application development steps into smaller chunks, so as not to get overwhelmed by the entire scope of the application.
What I've learned
I've shared some of the learnings in the previous sections, but summing it up as:
- Learned the fundamentals of traceroute util and networking basics.
- Learned the limitations and issues with IP geolocation (i.e. It's a perfect science).
- Learned about performance metrics and how to assess them.
- Learned how to deploy an application on a cloud instance and how to connect to it via SSH.
- Improved my frontend skills, especially with the MUI component library, especially on its reusable styling part.
What's next for Tracepath
If I win the first prize, I want to use the prize amount to work on tracepath.in full-time and some of the features, that I want to add to it are:
- Security & performance analysis on authenticated routes. Currently, it's only able to generate reports on non-authenticated routes like the landing page.
- Improving the security and performance analysis feature.
- Project-level tracking with mail alerts which allows to generate reports on scheduled intervals.
- Competitor analysis will allow users to compare their apps' performance and security against their industry rivals.
Built With
- express.js
- graphql
- lighthouse
- node.js
- postgresql
- prisma
- react
- redwood

Log in or sign up for Devpost to join the conversation.