🚀 TraceMind: Autonomous AI Observability Agent
💡 Inspiration
Modern cloud architectures have evolved into distributed microservices where a single user action touches dozens of services, databases, and message queues. When an incident strikes at 2 AM, on-call engineers are thrust into a chaotic scramble: sifting through gigabytes of logs, deciphering distributed trace spans, and manually correlating disjointed metrics across isolated dashboards.
We realized that while observability data has grown exponentially, the way humans diagnose issues hasn't changed. We asked ourselves: What if an AI agent could think and investigate like a senior site reliability engineer (SRE) autonomously querying telemetry, tracing cascade failures across service boundaries, and isolating the root cause in seconds?
That vision became TraceMind.
⚙️ How We Built It
TraceMind is designed around an autonomous multi-step reasoning architecture rather than static rule-based alerting.
       [ Production Incident / Alert ]
                      │
                      ▼
   ┌─────────────────────────────────────┐
   │        TraceMind Orchestrator       │
   │  (LangGraph Autonomous Loop + State)│
   └──────┬───────────┬───────────┬──────┘
          │           │           │
     (PromQL)    (Trace Graph)  (Log Search)
          │           │           │
          ▼           ▼           ▼
   [ Prometheus ] [ Jaeger/OTel ] [ Elastic/Loki ]
                      │
                      ▼
   ┌─────────────────────────────────────┐
   │    Gemini Multi-Modal Reasoning     │
   │   - Cascade Failure Detection       │
   │   - Exact Code/Span Blame Analysis  │
   └──────────────────┬──────────────────┘
                      │
                      ▼
   [ Actionable Root Cause Report + Interactive Graph ]
Key Technical Pillars:
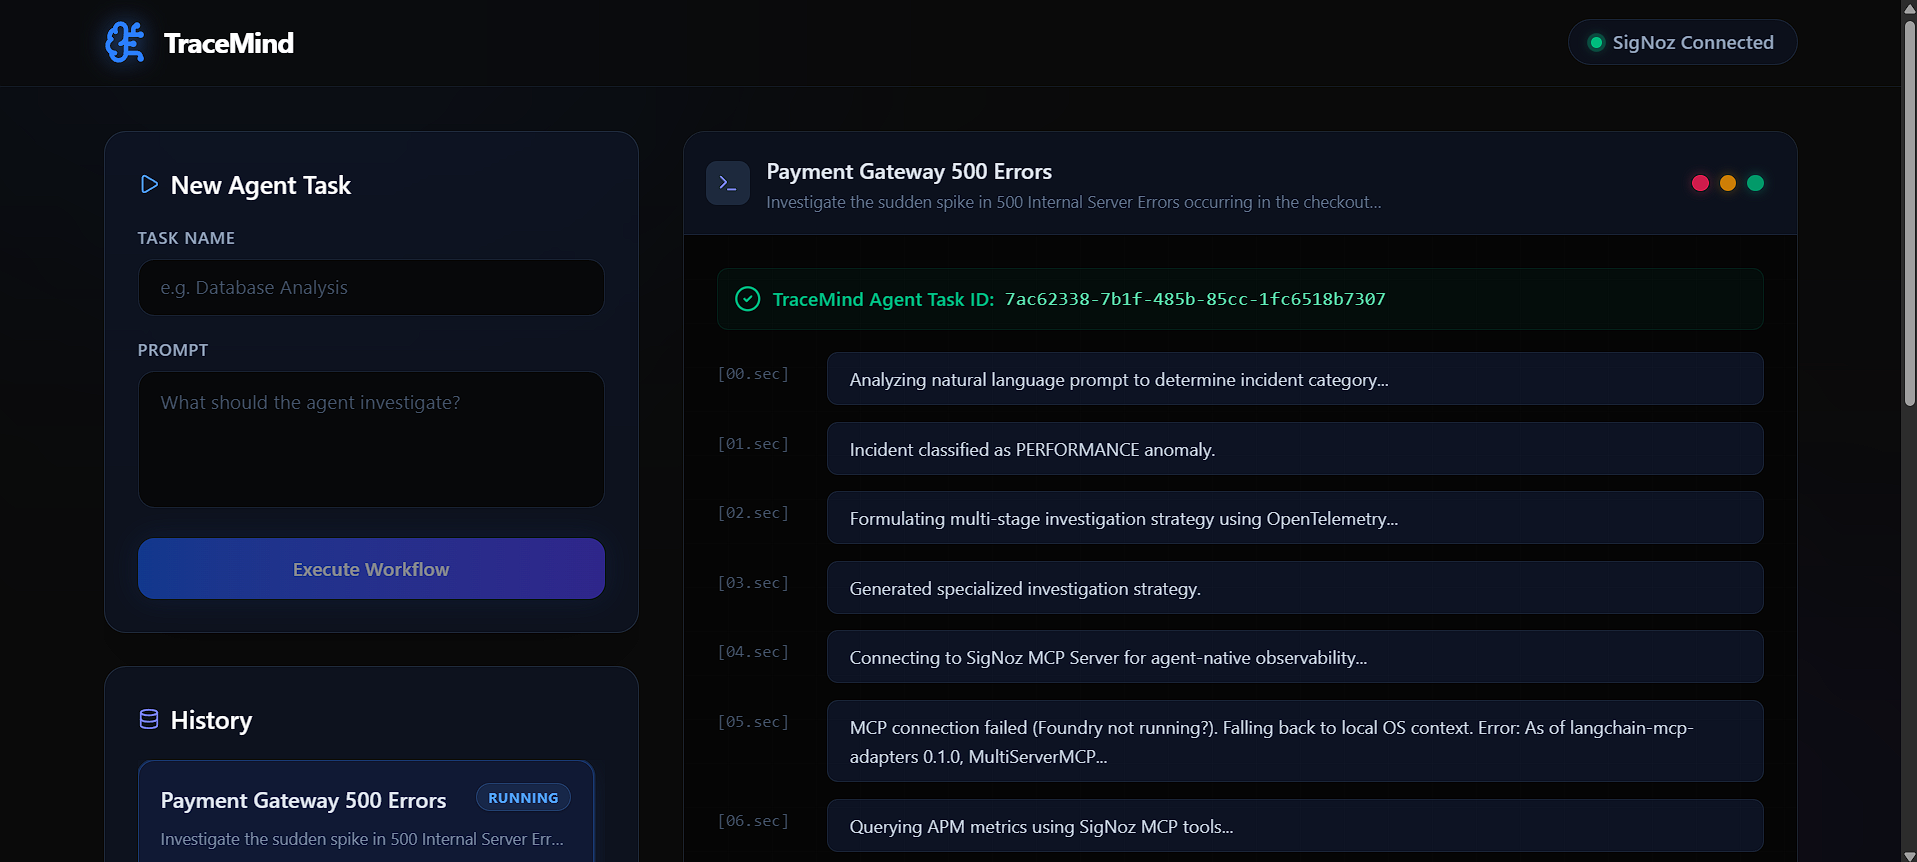
- Agentic Orchestration: Built with LangGraph to manage complex, cyclical reasoning loops ($\text{Hypothesize} \rightarrow \text{Query Telemetry} \rightarrow \text{Evaluate} \rightarrow \text{Drill Down}$).
- Multi-Modal AI Reasoning: Powered by Google Gemini, capable of interpreting complex structured span waterfalls, dependency matrices, and error logs simultaneously.
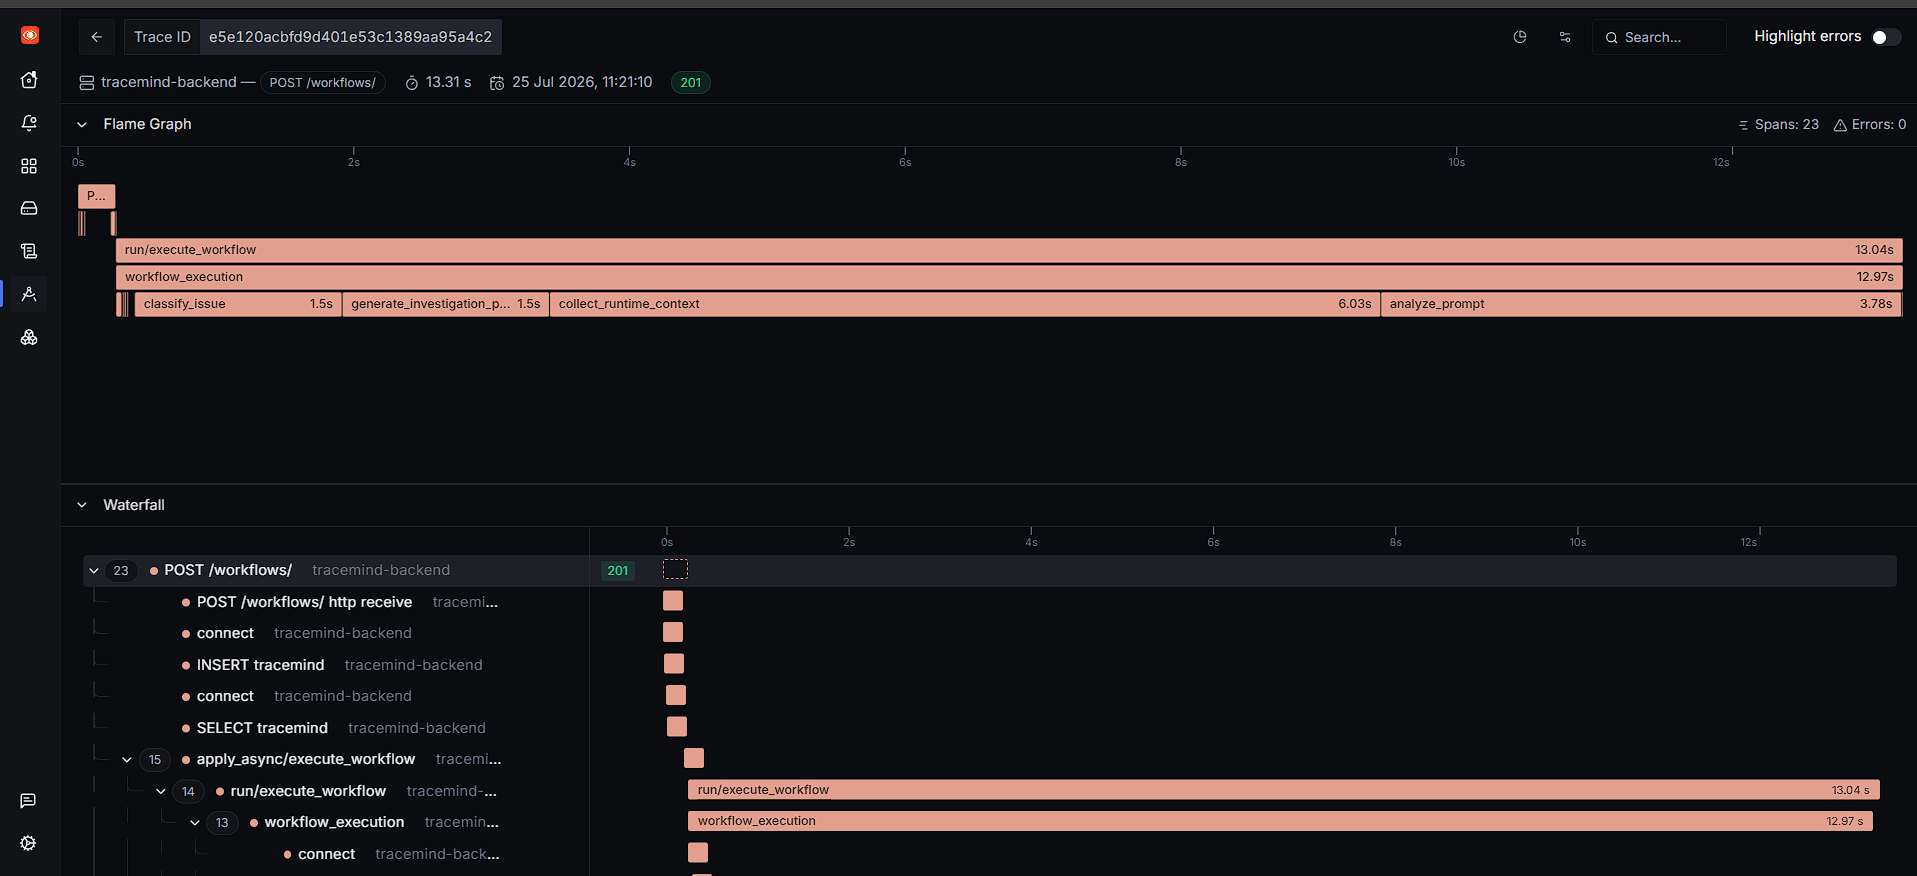
- Autonomous Telemetry Tools: Equipped with specialized tool-calling hooks to query OpenTelemetry / Jaeger traces, PromQL metrics, and distributed log aggregators.
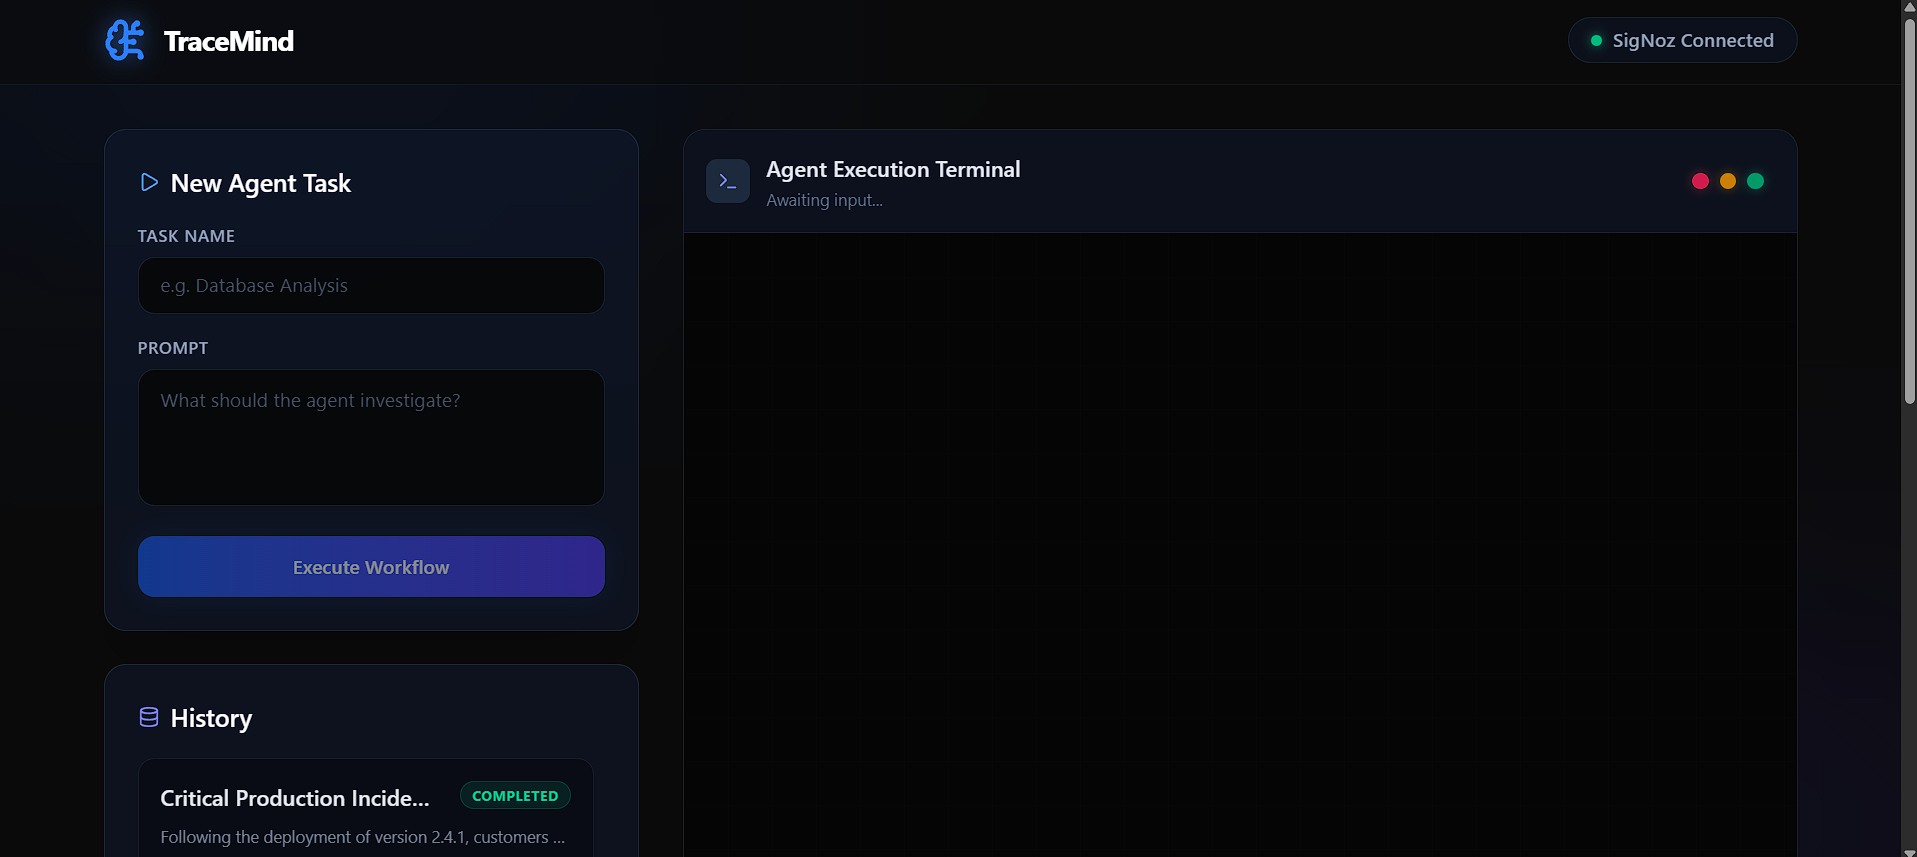
- Frontend & Interactive Visualization: Built with modern web technologies and real-time visualization graphs to give engineers an immediate, intuitive breakdown of the failure path.
🧗 Challenges We Faced
- High-Dimensional Telemetry Overload: A single distributed trace can contain hundreds or thousands of nested spans. Feeding raw traces directly into an LLM exceeds context limits and causes cognitive noise. We engineered a graph-pruning pre-processor to strip benign spans and isolate anomalous latency bottlenecks and error bubbles before agent ingestion.
- Eliminating RCA Hallucinations: In production debugging, precision is non-negotiable. To ensure 100% factual diagnostic accuracy, we instituted a multi-agent critique & verification loop where every hypothesis must be backed by concrete span IDs, log timestamps, and error codes.
- Multi-Step Tool Orchestration: Designing an agent that autonomously decides which query to run next (e.g., fetching downstream logs only after discovering an upstream timeout) required granular state transitions and deterministic recovery strategies within LangGraph.
🏆 Accomplishments We're Proud Of
- Sub-Minute Incident Triage: Slashed the Mean Time to Detect (MTTD) and Mean Time to Understand (MTTU) from 30+ minutes of manual investigation down to under 15 seconds.
- Autonomous Multi-Hop Trace Navigation: Enabled the AI agent to follow distributed causality links across 5+ interdependent microservices to locate silent database lock contentions and cascading timeout failures.
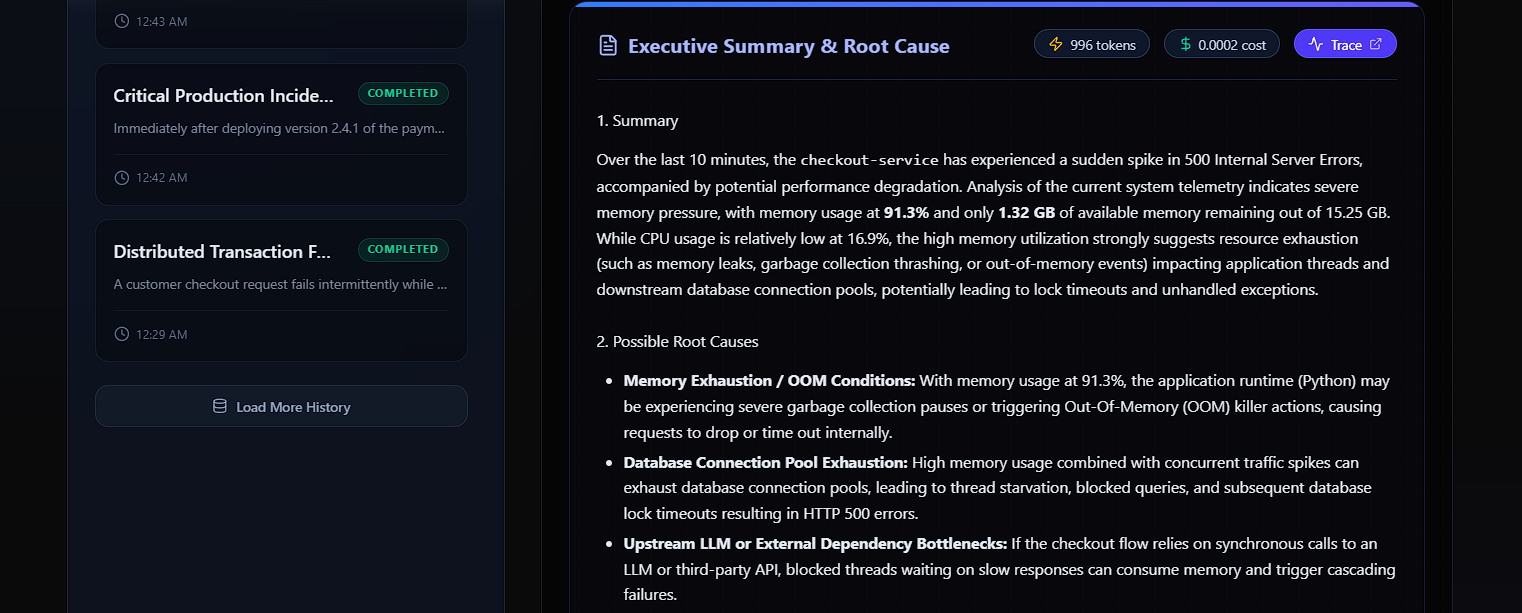
- Zero-Configuration Diagnostic Value: Created actionable reports that don't just output raw data—they explain why it failed, where the root fault lies, and how to remediate it.
📚 What We Learned
- AI Agents as Investigators, Not Just Chatbots: The power of LLMs in DevOps is unlocked when they are granted targeted querying tools and autonomous iteration loops, rather than functioning as passive query responders.
- The Synergy of OpenTelemetry & LLMs: Standardized OpenTelemetry semantic conventions provide the structured foundation that allows generative AI to reason accurately across heterogeneous tech stacks.
- Human-in-the-Loop Clarity: Delivering concise, verifiable evidence (linking to the exact span ID) is crucial for winning engineer trust during critical production outages.
🔮 What's Next for TraceMind
- Automated Remediation (Self-Healing): Safely integrating automated rollback and pod-restart triggers via Kubernetes operators based on verified root causes.
- Predictive Anomaly Detection: Analyzing temporal telemetry trends to diagnose potential degradation before an alert is ever triggered.
- Slack / PagerDuty Deep Integration: Deploying TraceMind as an interactive incident co-pilot that collaborates directly within war-room channels.
Built With
- ai-agents
- artificial-intelligence
- devops
- distributed-tracing
- docker
- fastapi
- google-gemini
- grafana
- jaeger
- javascript
- kubernetes
- langchain
- langgraph
- microservices
- observability
- opentelemetry
- prometheus
- promql
- pydantic
- python
- react
- rest-api
- sre
- typescript
- uvicorn

Log in or sign up for Devpost to join the conversation.