Inspiration
Debugging modern distributed systems is an absolute nightmare. When a single request hops across four different microservices, databases, and third-party APIs, figuring out exactly where a 500 error originated or why a query is slow takes way too long.
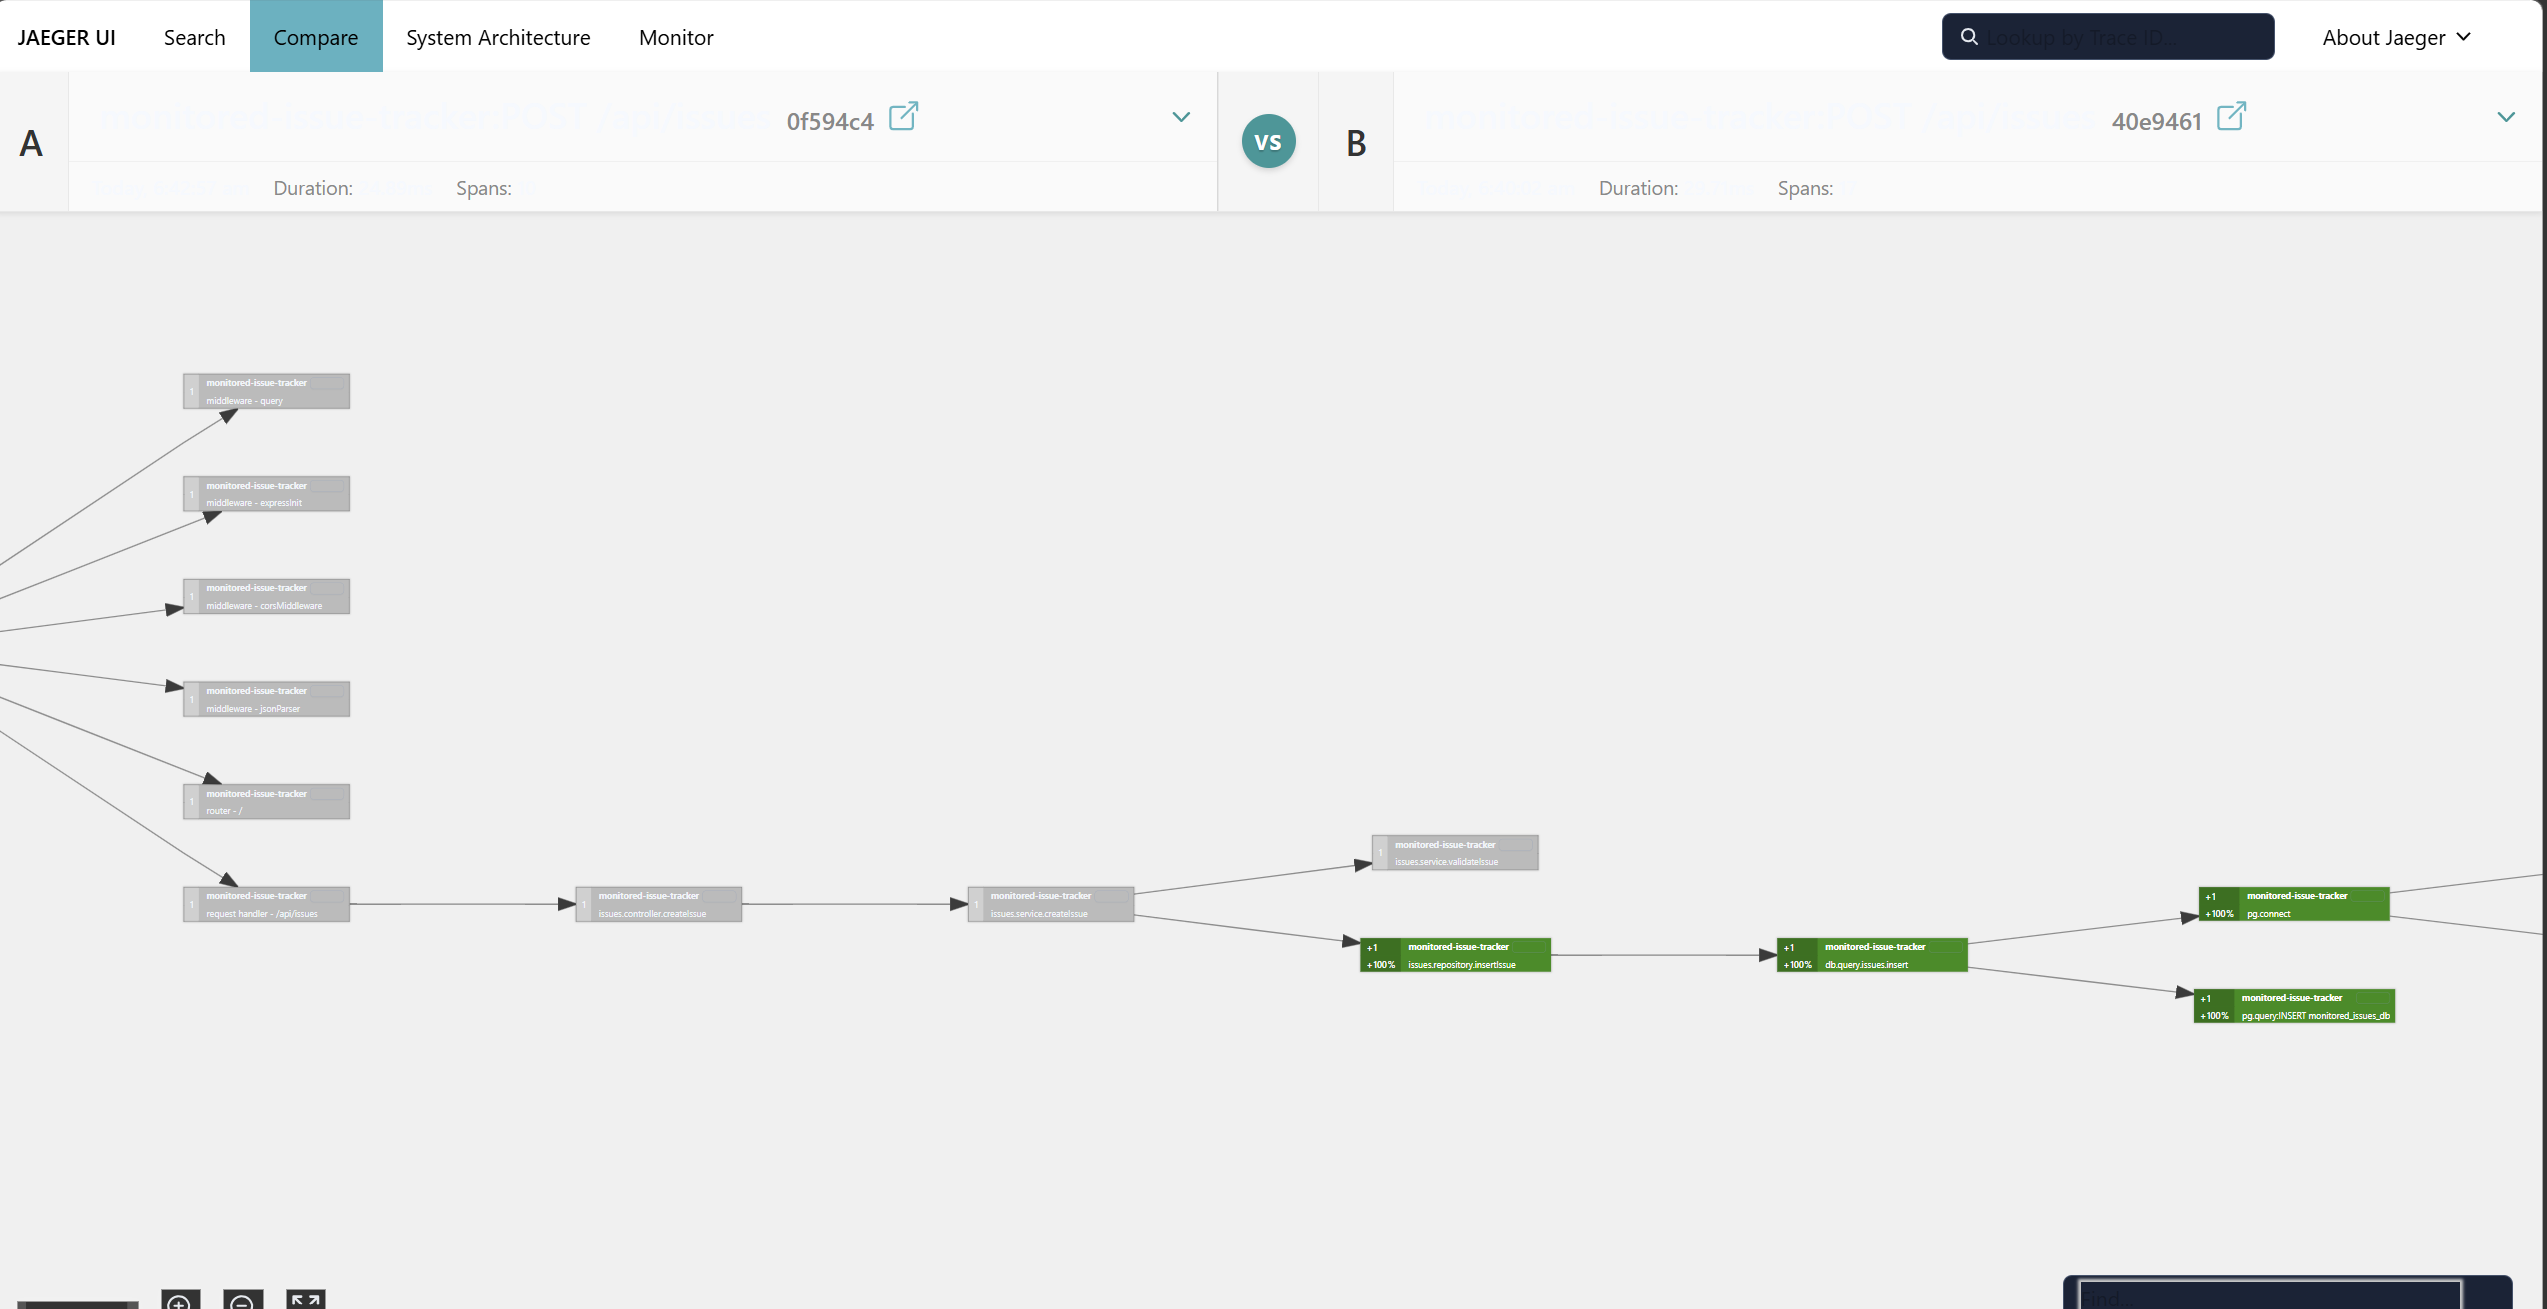
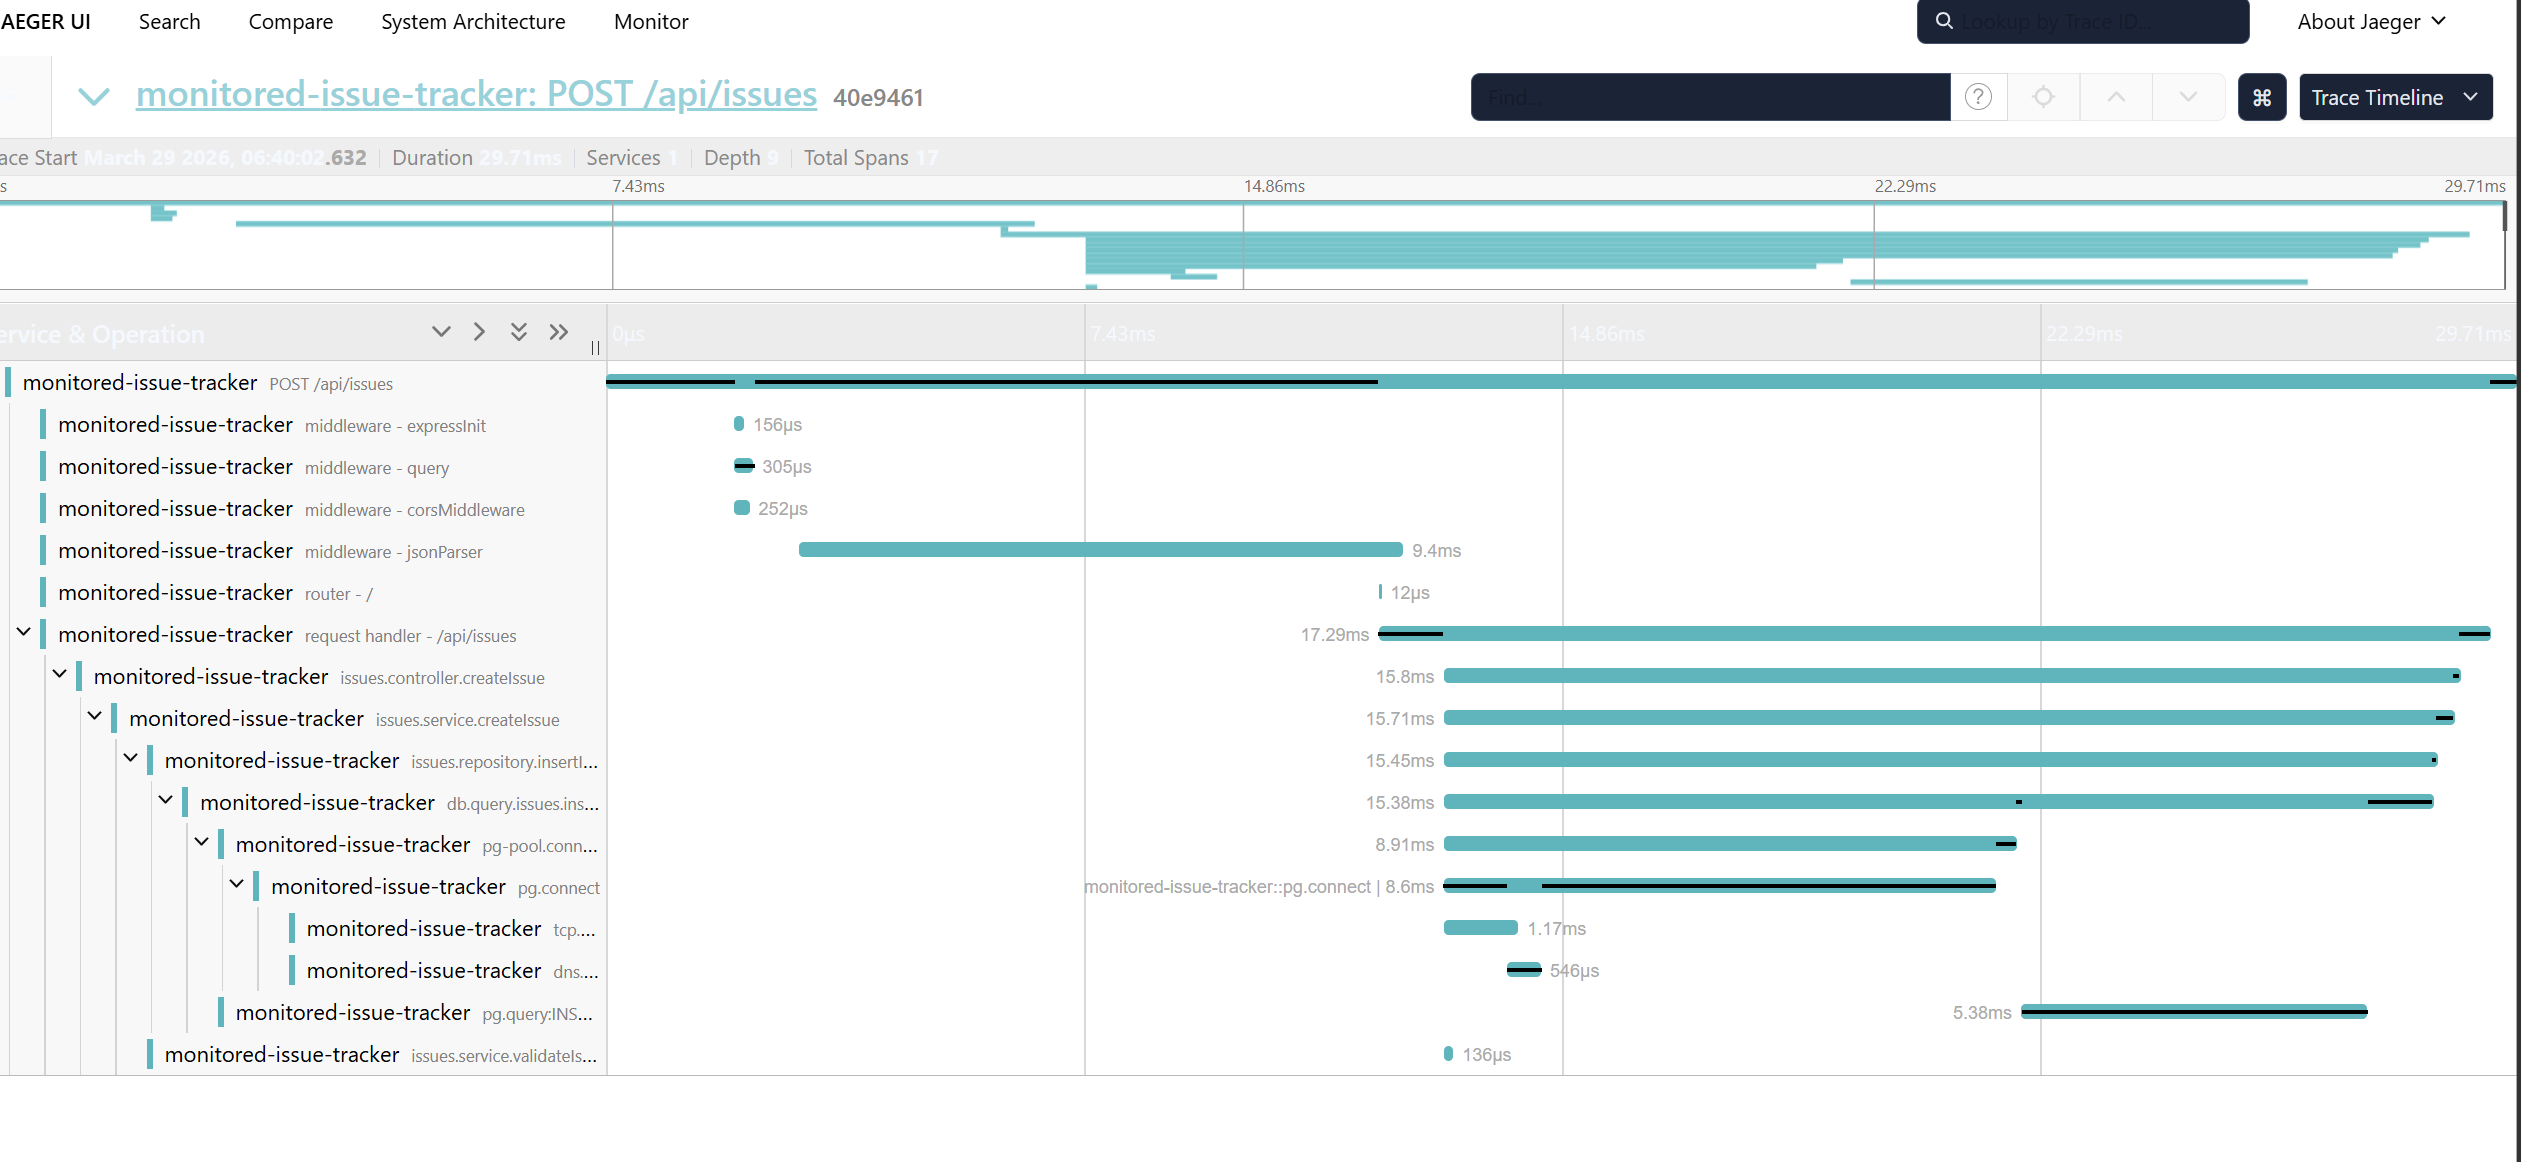
Even with powerful industry-standard tools like OpenTelemetry and Jaeger, the raw data exists, but it is fundamentally unintuitive. As a solo developer, I found myself repeatedly forced to dig through endless rows of raw JSON spans just to mentally reconstruct the architectural flow of a request.
I wanted to fix this. I built TraceLens to make debugging feel visual, immediate, and effortless—like watching your entire backend think and operate in real-time.
What it does
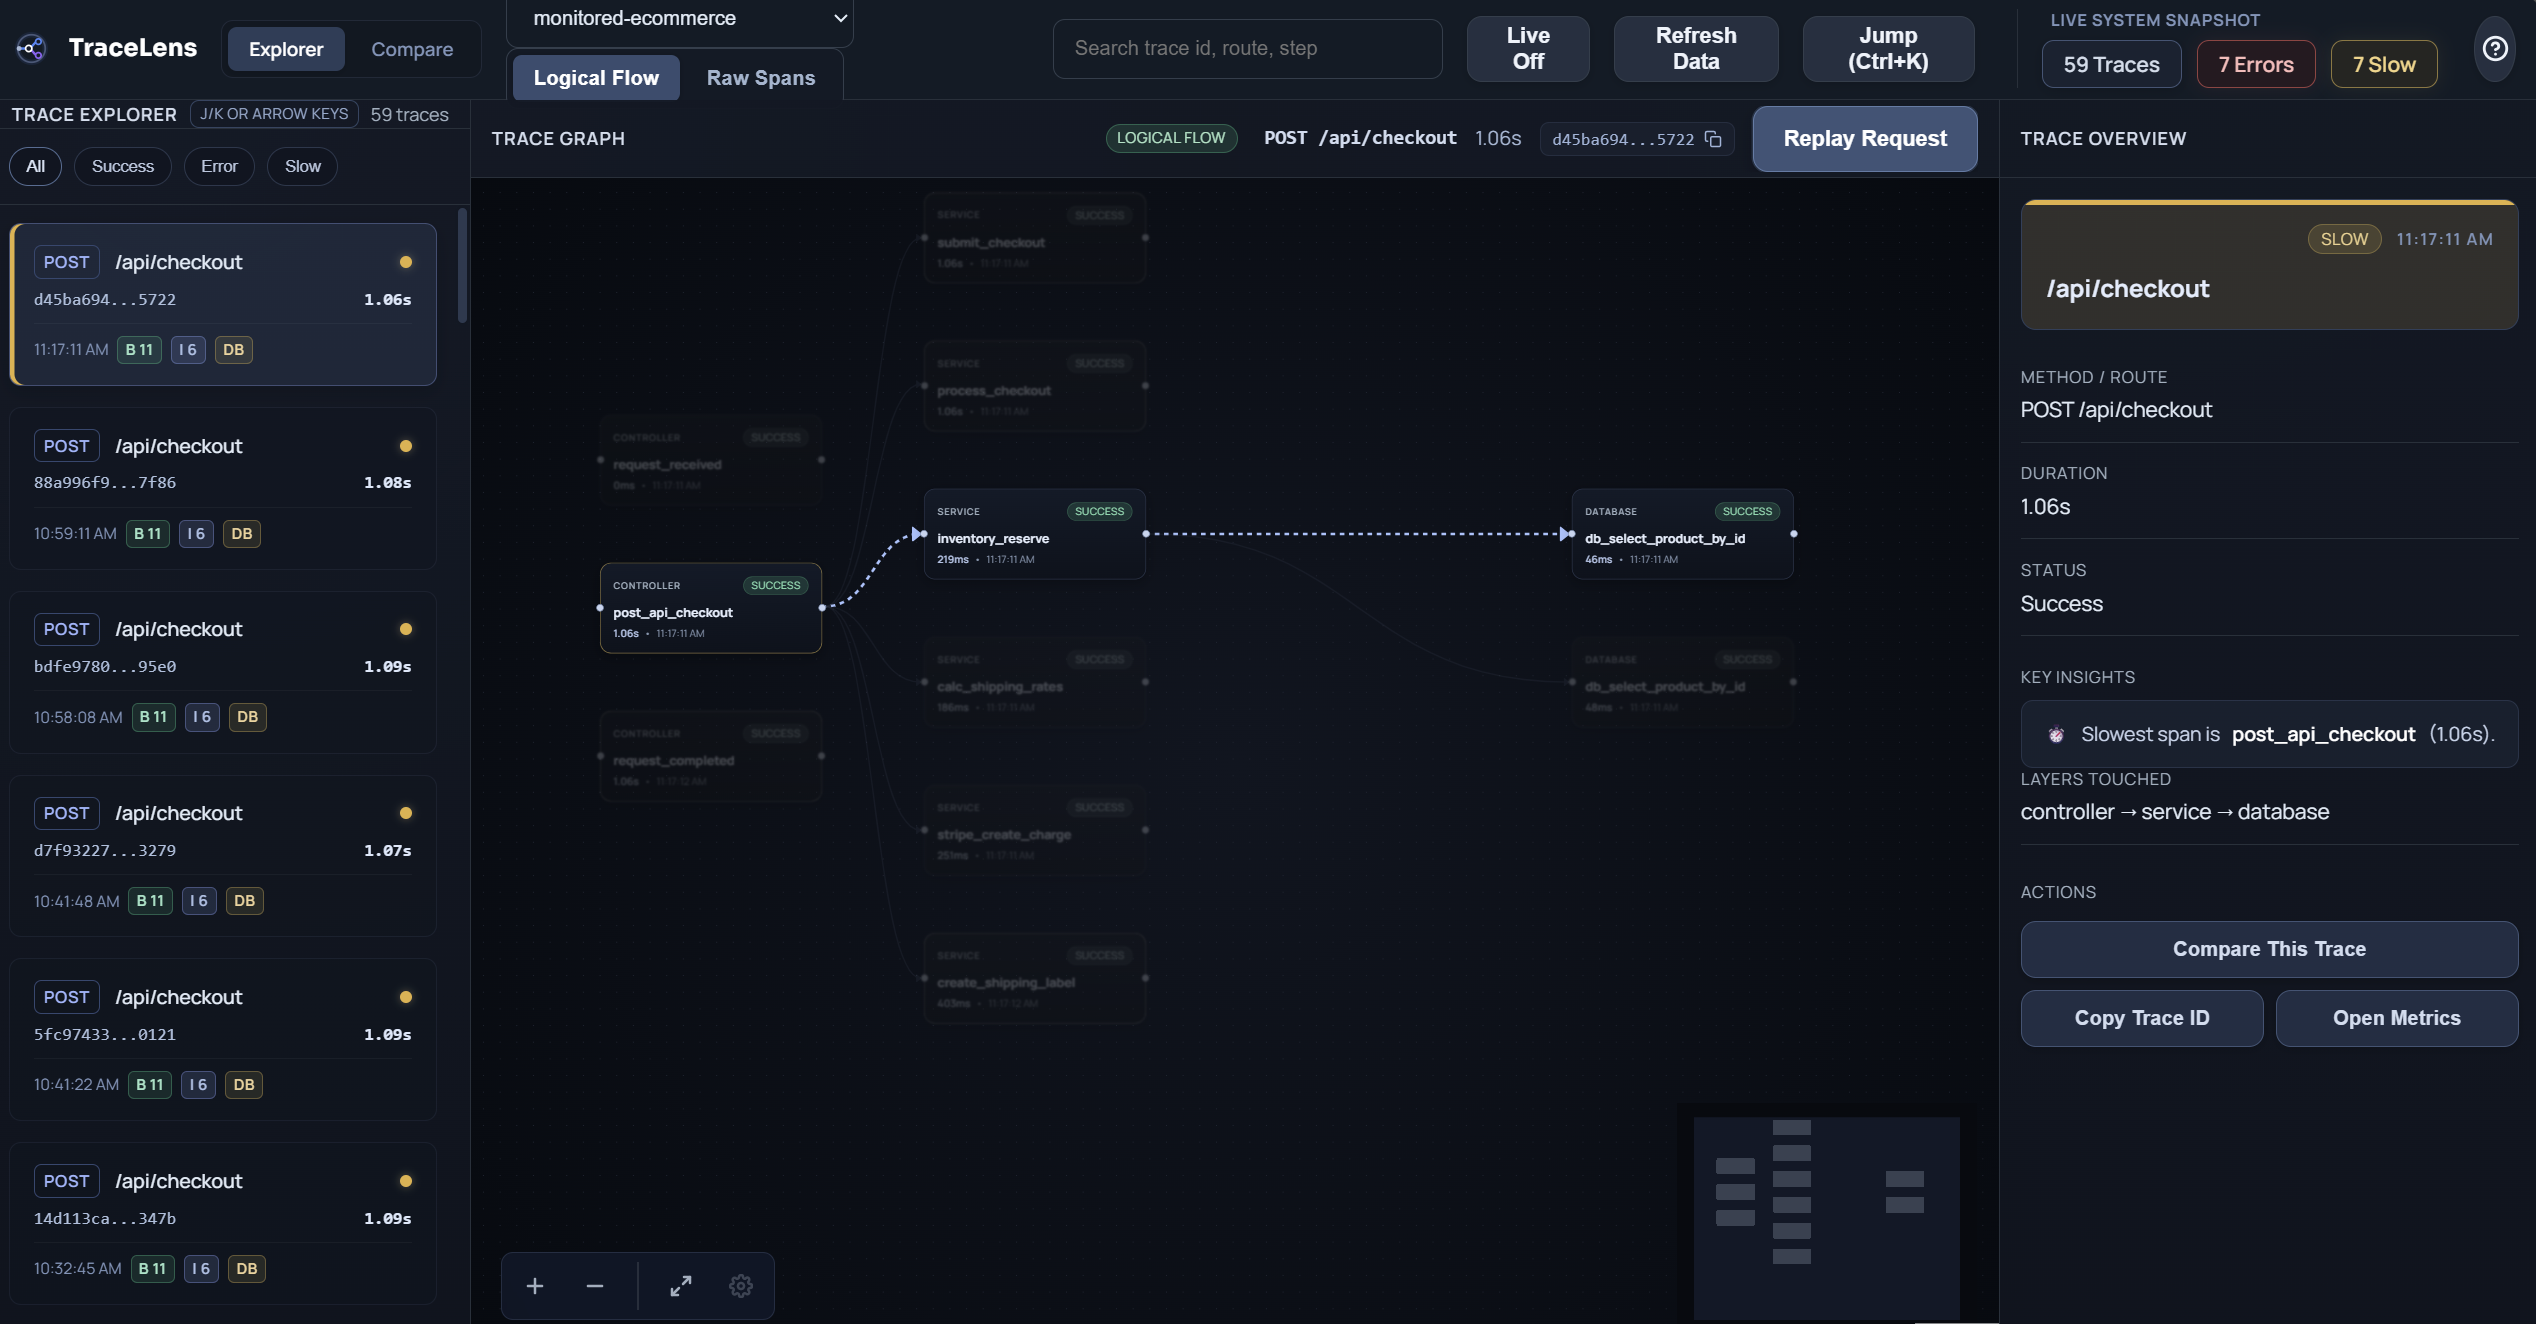
TraceLens is an open-source observability platform that turns raw backend request logs into a live, highly interactive visual node graph.
Instead of reading text logs, TraceLens maps the exact lifespan of a request as it waterfalls through Controllers, Services, and Databases.
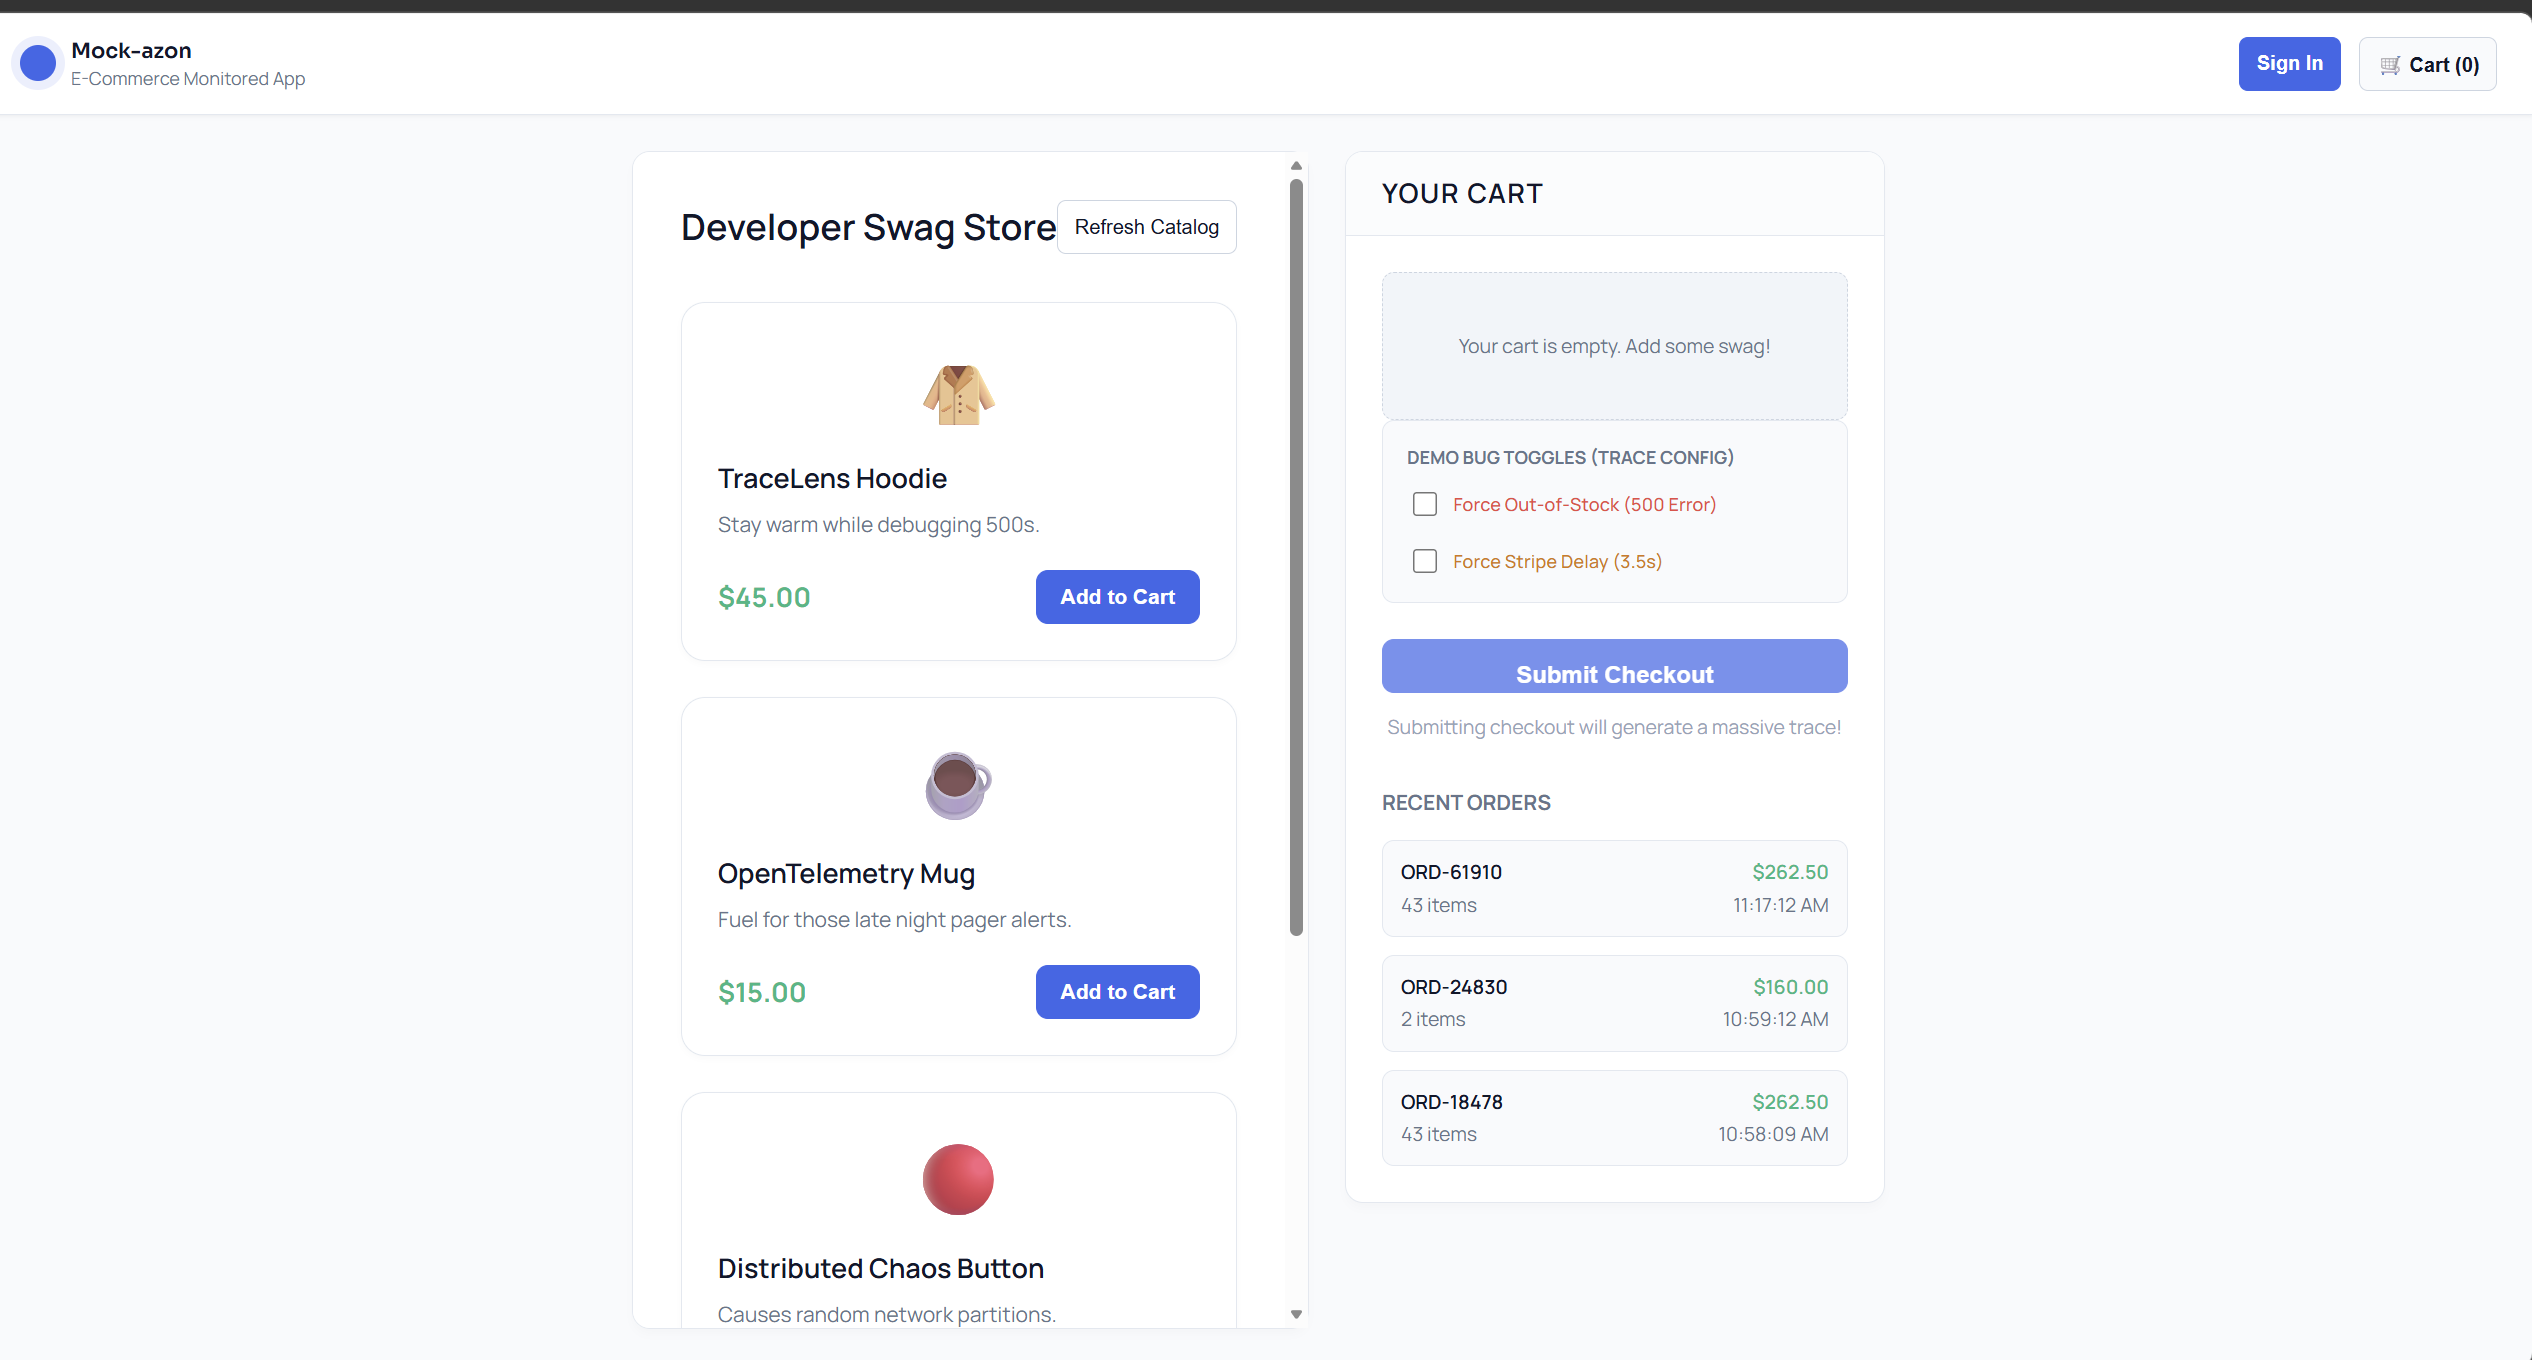
To prove it works, I also built and instrumented Mock-azon, a fully functional mock E-Commerce microservice architecture designed specifically to break:
- TraceLens Dashboard: Connects to OpenTelemetry pipelines, dynamically reconstructs parent-child span relationships, and renders them onto a beautiful React Flow canvas. You can instantly spot latency bottlenecks, pinpoint cascading 500 errors, and inspect specific database activity at each node.
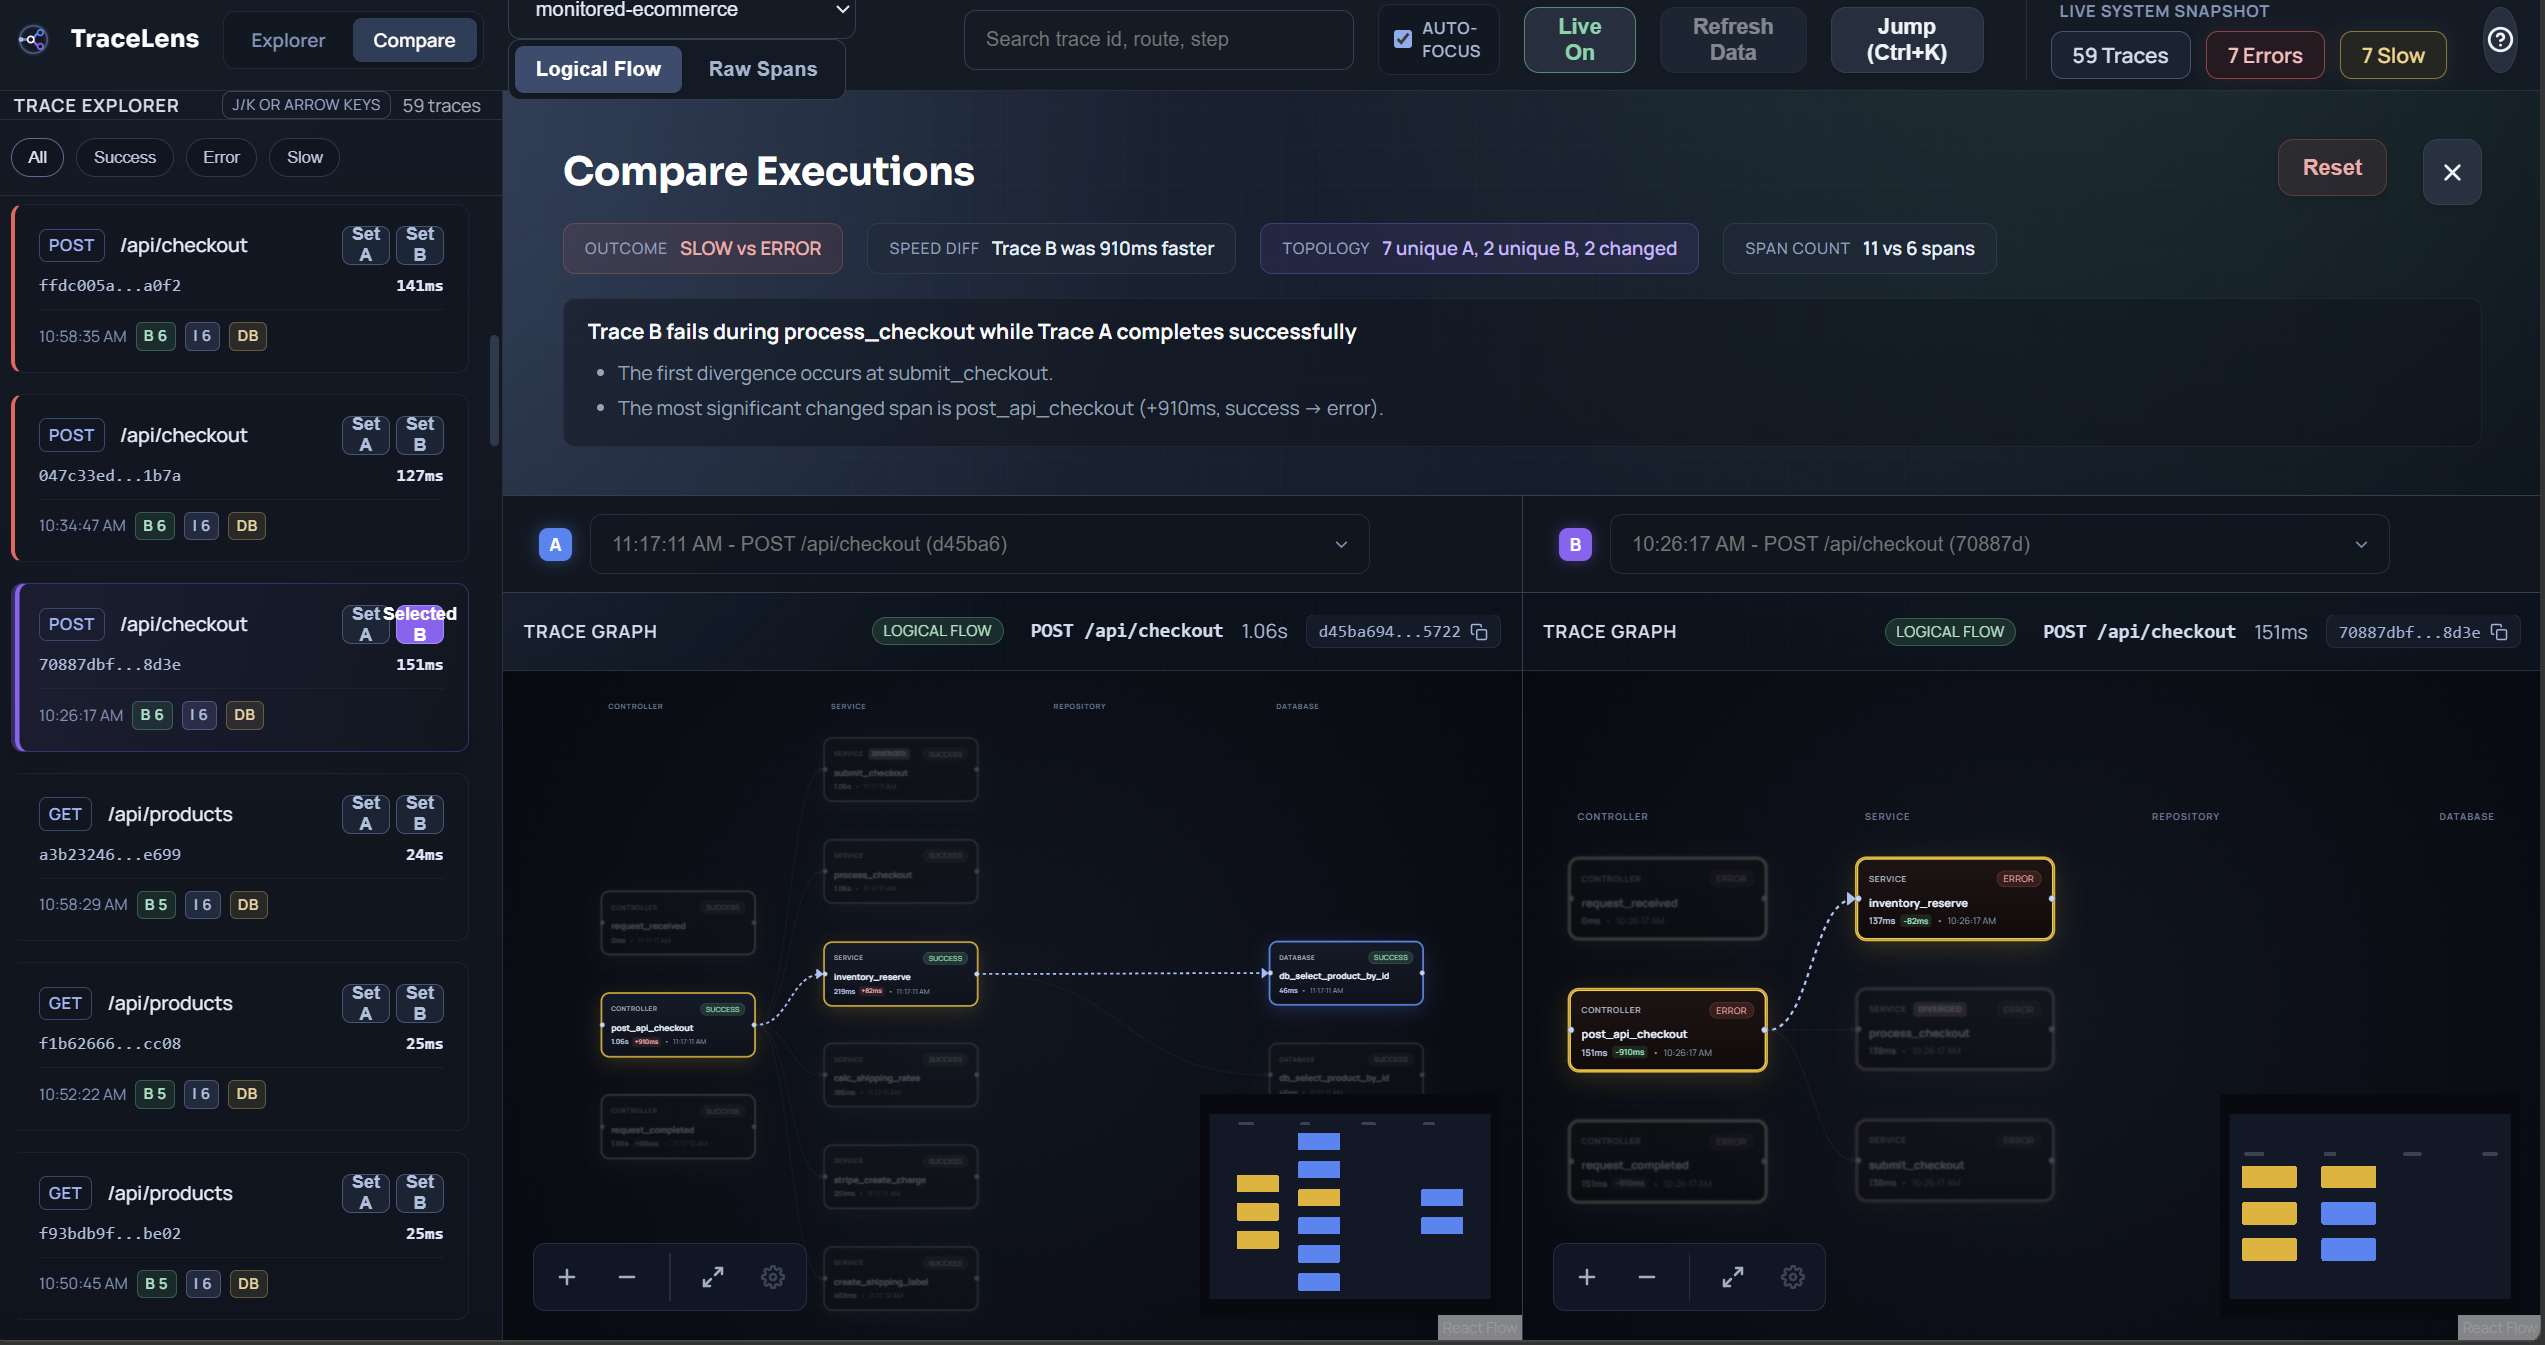
- The Mock-azon Demo: An interactive frontend where users can actively place orders, force fake Stripe API delays (latency testing), and trigger inventory database crashes (500 error testing). When you click a bug in Mock-azon, TraceLens instantly visualizes the failure across the distributed system.
How we built it
I built TraceLens as a complex, 4-part monorepo architecture engineered for scale:
1. TraceLens Core Platform:
- Backend Processing Engine: The backend does the heavy lifting. It doesn't just fetch data—it actively processes, parses, and correlates disparate raw OpenTelemetry spans from the Jaeger API, transforming decentralized logs into a structured, unified graph format before serving it to the UI.
- Frontend: An enterprise-grade, meticulously designed UI that converts the processed backend spans into interactive graphical nodes and edges. It visually calculates latency timings, hierarchical depth, and network errors.
2. The Monitored App (Mock-azon):
- Backend: A realistic microservice environment simulating Checkout, Inventory, and Payment services. It is deeply instrumented with OpenTelemetry to automatically push traces out.
- Frontend: A beautiful storefront UI with built-in "Bug Toggles" that allow you to intentionally sabotage the backend to generate interesting traces for the TraceLens dashboard.
Challenges we ran into
Being a solo developer on this project was intense, but the biggest hurdle was the steep learning curve of Observability infrastructure:
- Learning OpenTelemetry from Scratch: The "tracing stuff" was entirely new to me. Instrumenting Node.js apps, understanding span contexts, trace IDs, and figuring out how to successfully propagate trace contexts across network hops was a massive technical hurdle that took extensive trial and error.
- Making Traces Understandable: Raw OpenTelemetry spans are incredibly noisy and messy. Turning them into a clean graph required me to build backend logic to recursively reconstruct parent-child relationships, handle missing or abandoned asynchronous spans, and implement an auto-layout algorithm that makes visual sense.
- UI Clarity vs. Complexity: Node graphs can turn into confusing "spiderwebs" very quickly. I spent a massive amount of time balancing deep technical detail with scannable readability so the UX didn't overwhelm the developer.
Accomplishments that we're proud of
- Built a fully working, end-to-end trace-to-graph data processing pipeline completely solo using complex enterprise-standard tools (OpenTelemetry/Jaeger).
- Successfully visualized real backend logic paths (Controller → Service → DB) purely from telemetry data without hardcoding the graph logic.
- Designed a UI that genuinely feels like a premium, production-level SaaS tool, rather than a hastily-built hackathon demo.
- Created an interactive, engaging way for developers to actually simulate backend destruction and watch the traces catch the bugs in real-time.
What we learned
- UX is everything. Observability tools give you massive amounts of data, but data is useless without intelligent abstraction.
- Distributed tracing is incredibly powerful, but hard to architect and trace correctly when initially learning the OTel SDKs.
- Enforcing clean backend system design (
Controller → Service → Repository) makes observability and tracing exponentially easier to understand. - The best developer tools don't add more features—they reduce mental load.
Built With
- nestjs
- react


Log in or sign up for Devpost to join the conversation.