TraceFerret AI-powered firmware investigation for embedded systems What is TraceFerret?
Debugging embedded firmware is very different from debugging a normal application.
When something goes wrong on a microcontroller, you usually don't get a helpful stack trace or a clear error message. Instead, you're looking at register dumps, interrupt vectors, peripheral states, memory maps, and timing information, then trying to piece together what actually happened. Finding the real cause can mean digging through thousands of lines of C code spread across multiple drivers.
That's the problem I wanted to explore with TraceFerret.
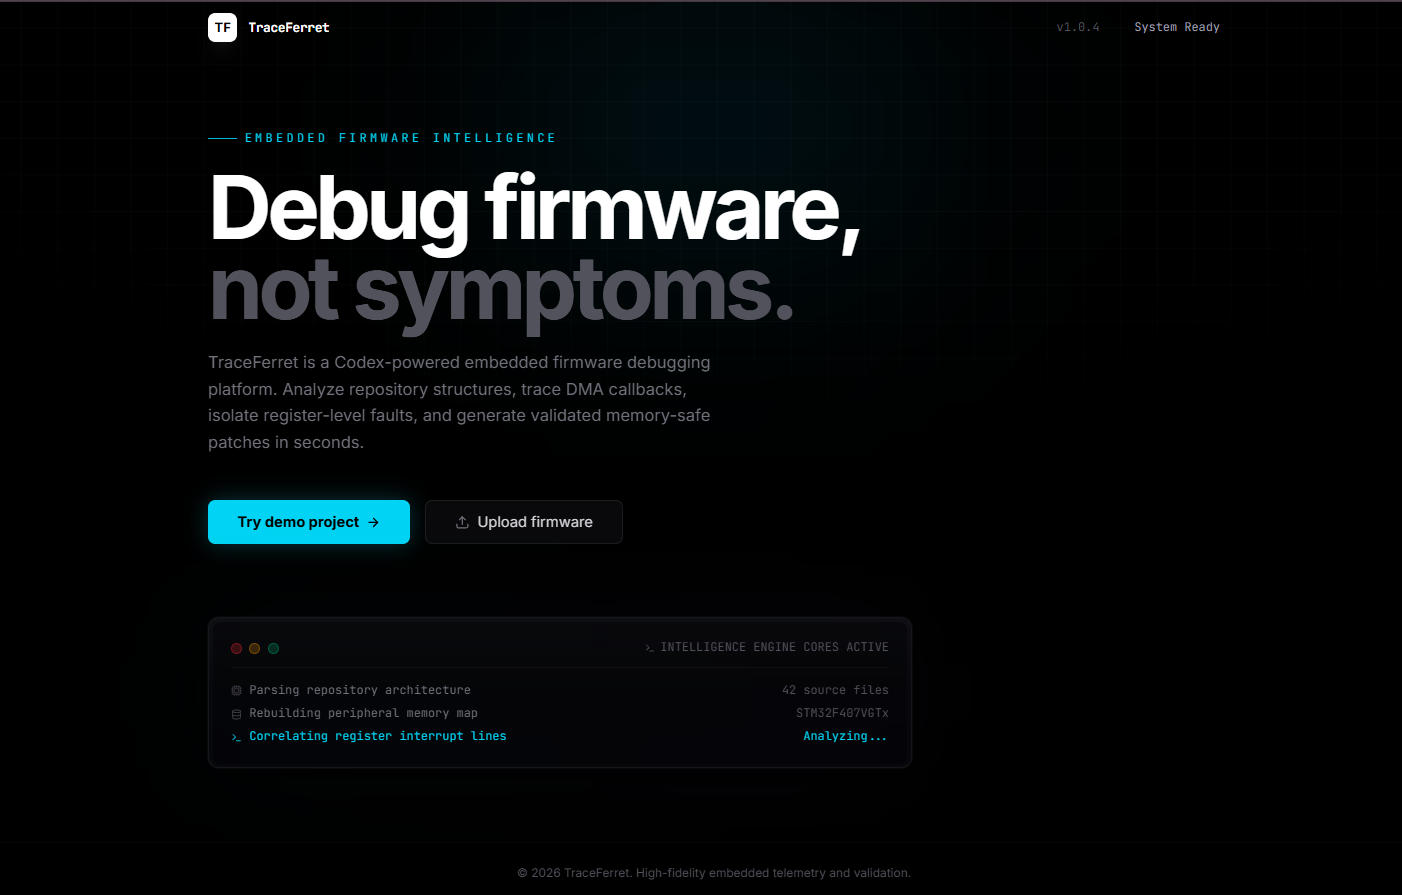
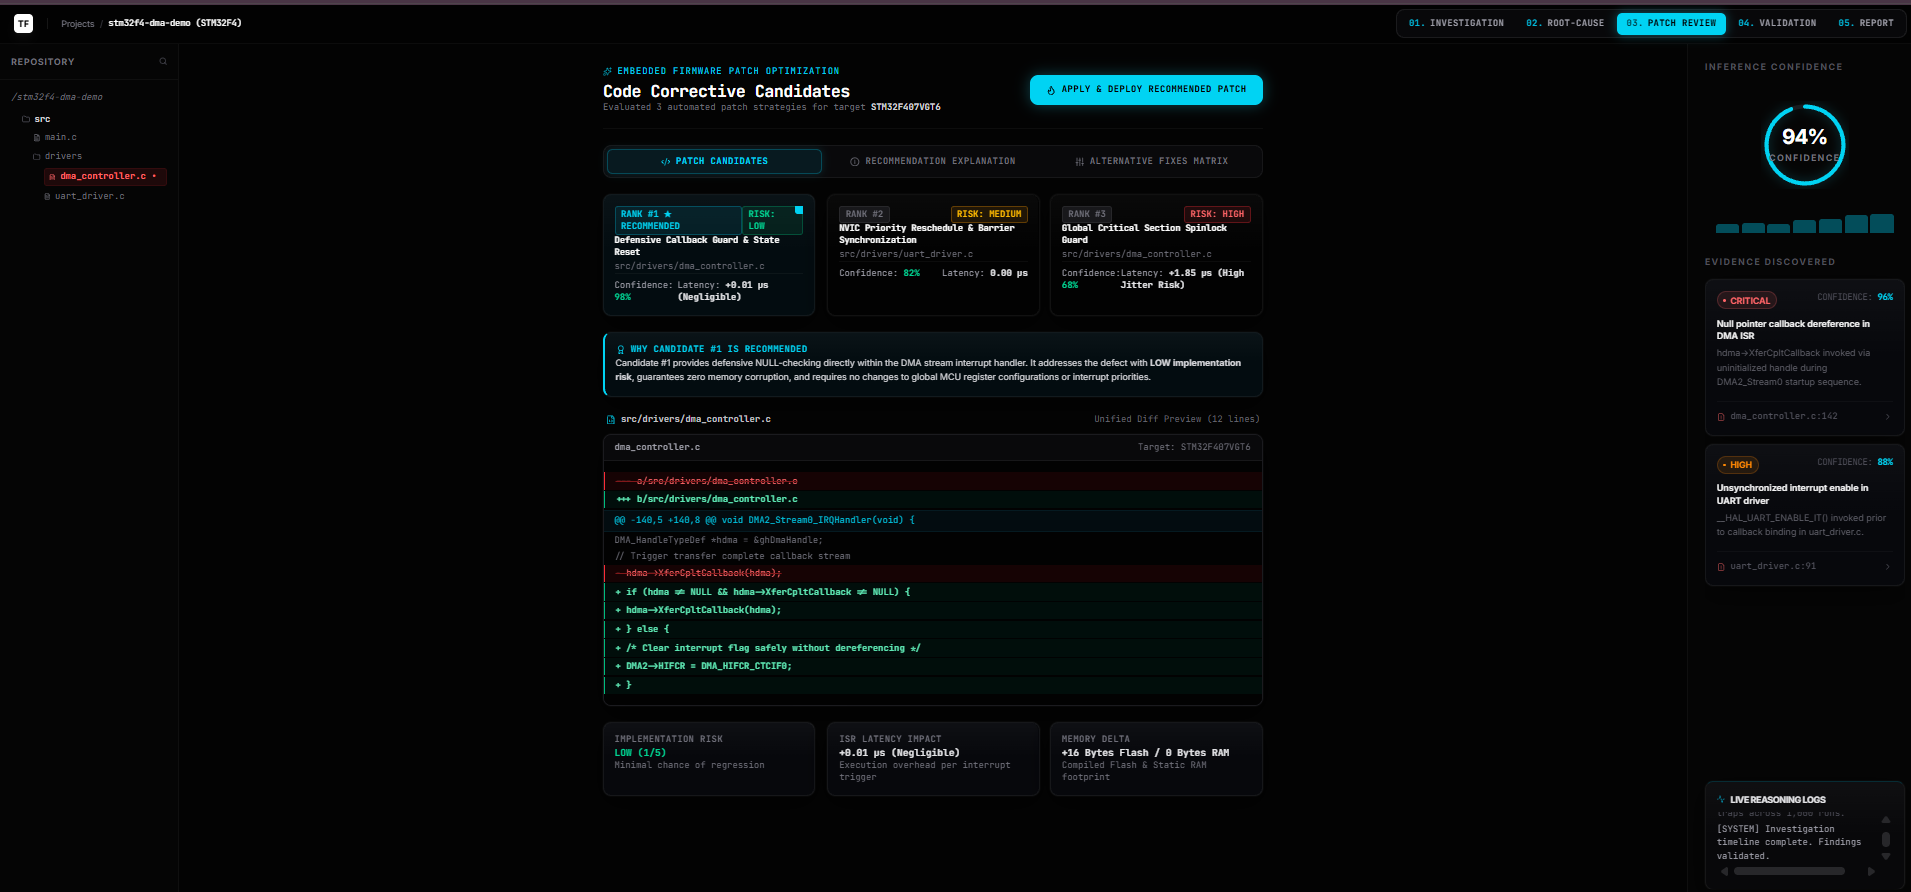
Instead of behaving like another AI chatbot that spits out an answer, TraceFerret walks through the debugging process like an engineer would. It analyzes the firmware, gathers evidence, identifies the most likely root cause, proposes a fix, validates it, and finally generates a report explaining what happened.
The idea wasn't just to get an answer faster—it was to make the investigation itself easier to follow.
Inspiration
I'm an aspiring SpaceTech engineer, and over the past year I've been spending more time learning embedded systems and firmware development.
One thing that stood out was how different debugging is compared to web or desktop software. A small mistake—like enabling an interrupt too early or forgetting to initialize a peripheral—can lead to failures that are surprisingly difficult to track down.
Current AI coding tools are great at generating code, but most of them don't really approach debugging the way firmware engineers do.
That made me wonder:
What if an AI tool behaved less like a chatbot and more like an engineering investigation platform?
TraceFerret is my attempt at exploring that idea.
What it does
TraceFerret turns firmware debugging into a guided investigation.
Right now the project demonstrates embedded debugging scenarios such as:
STM32 DMA callback failures FreeRTOS stack overflows
A typical workflow looks like this:
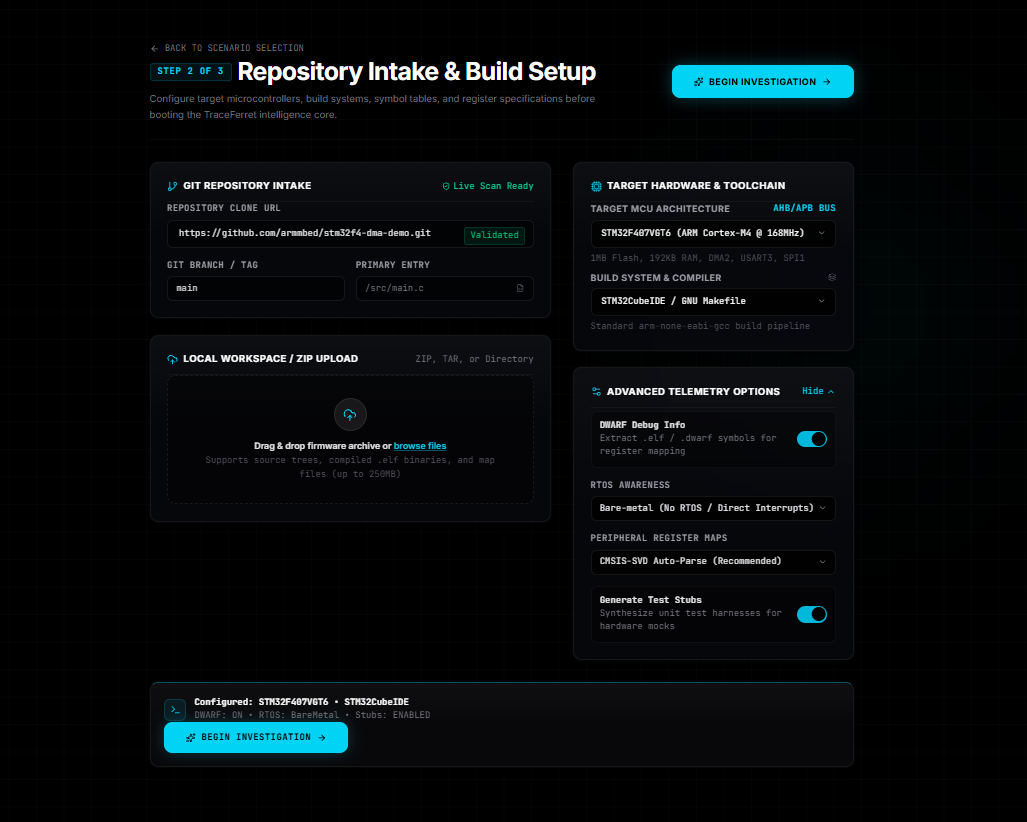
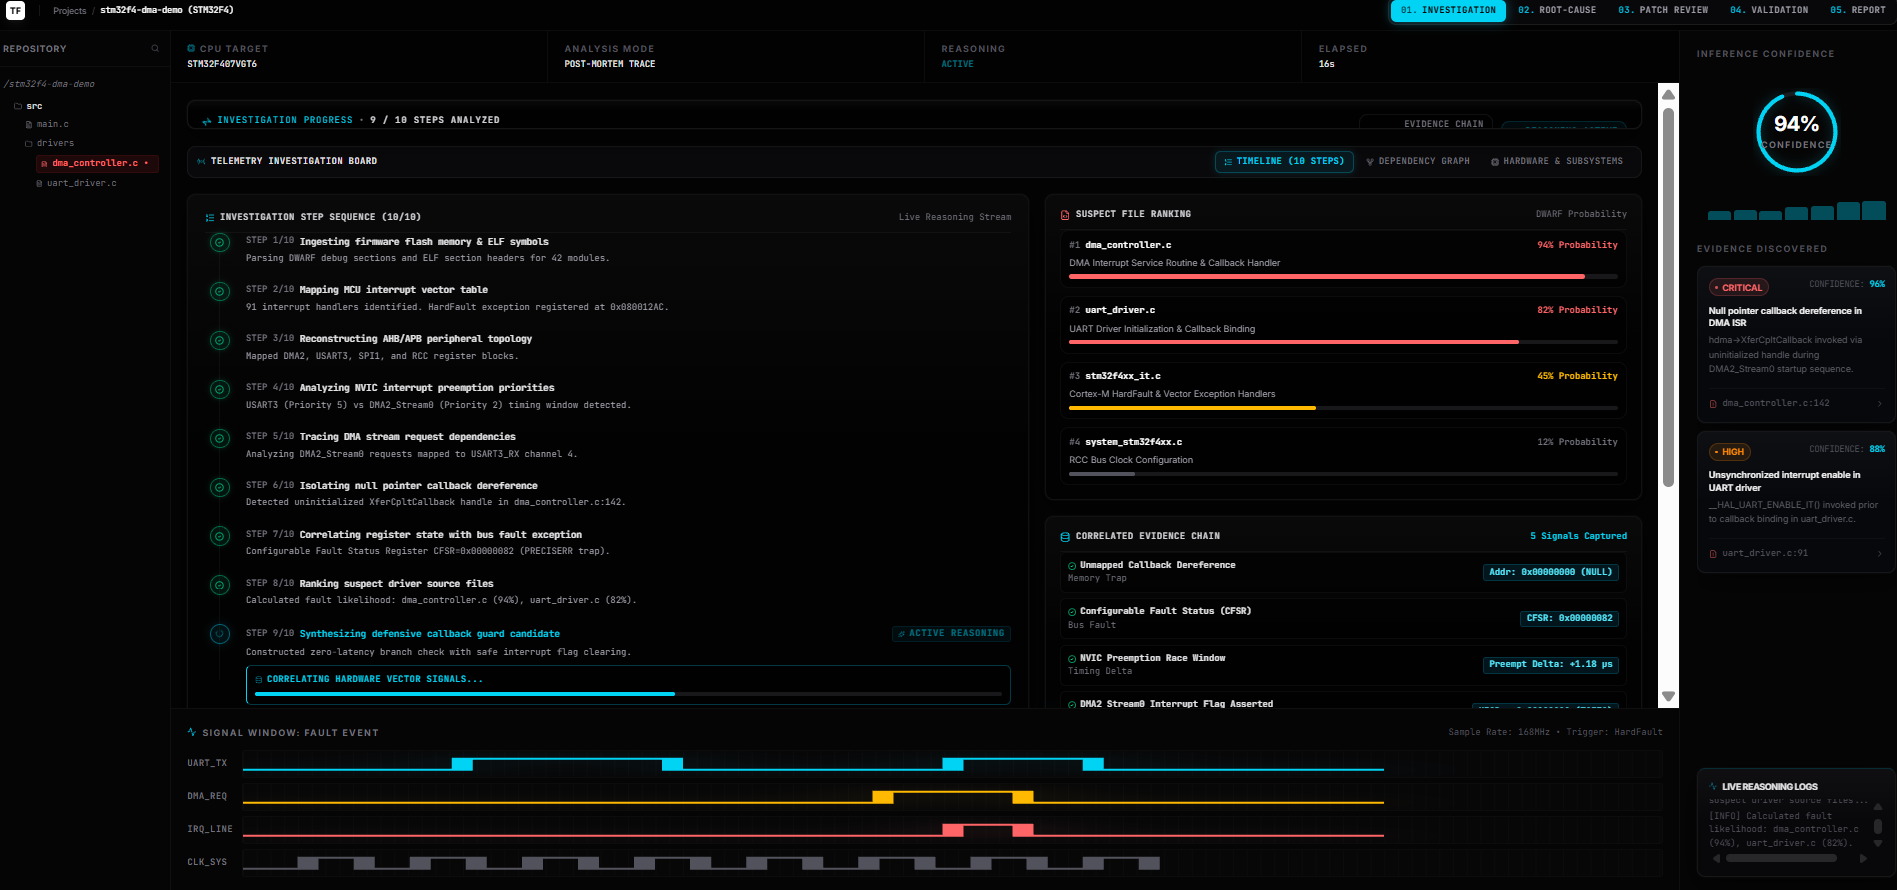
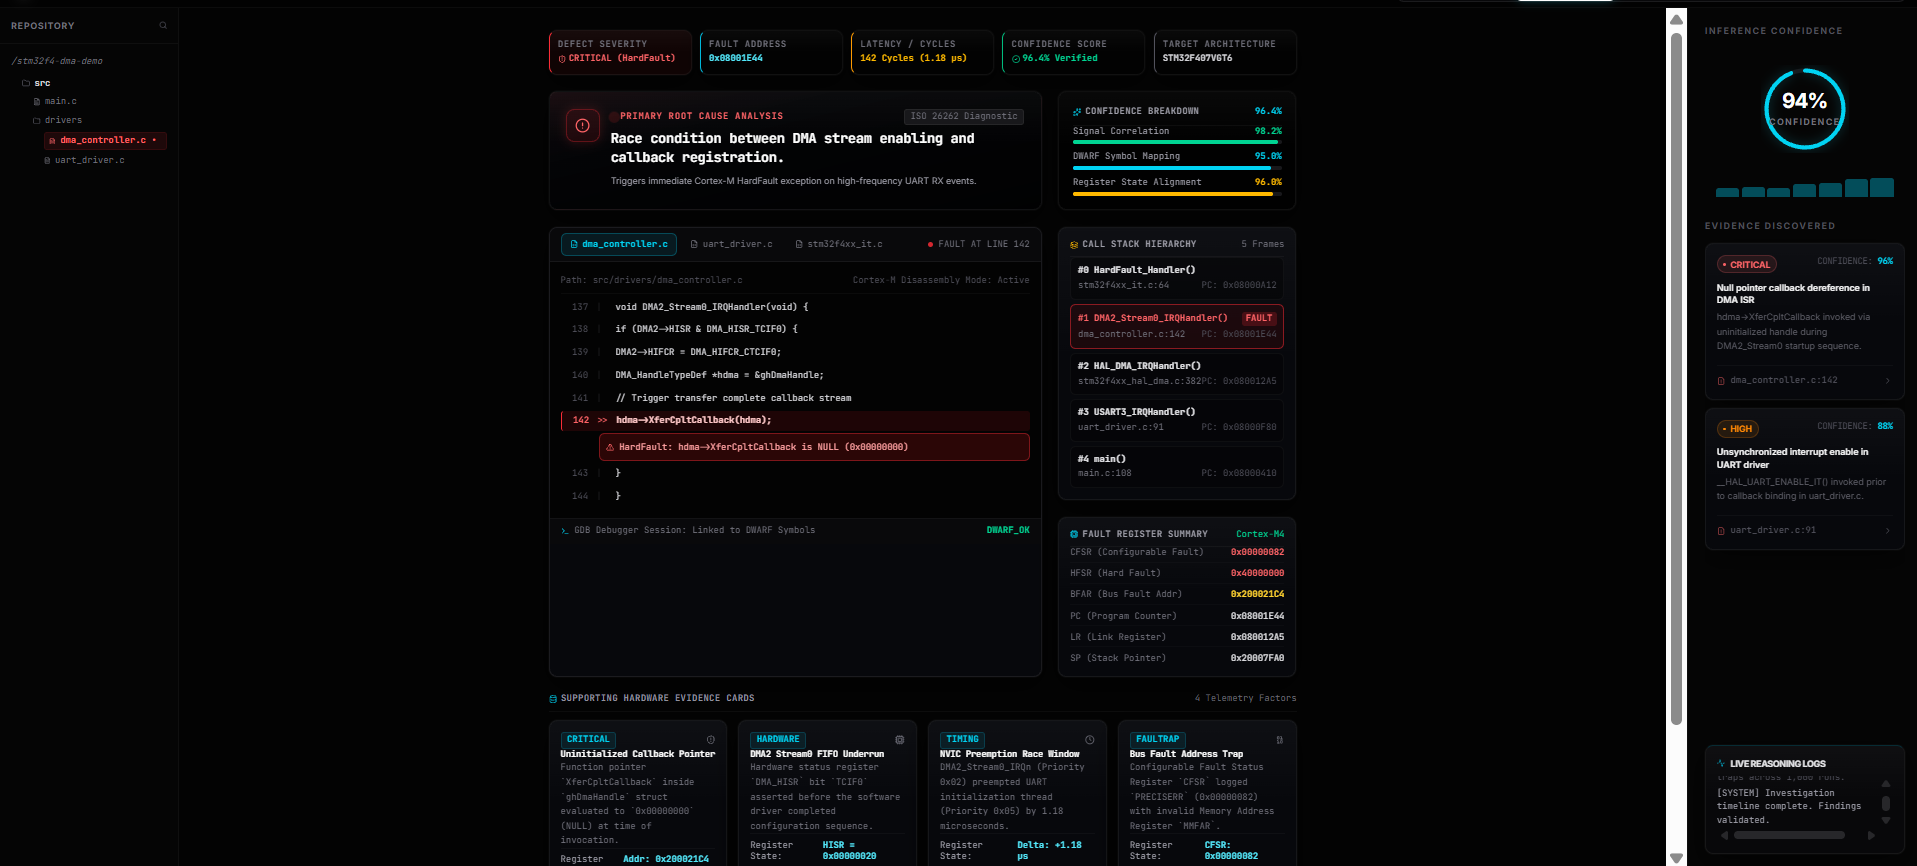
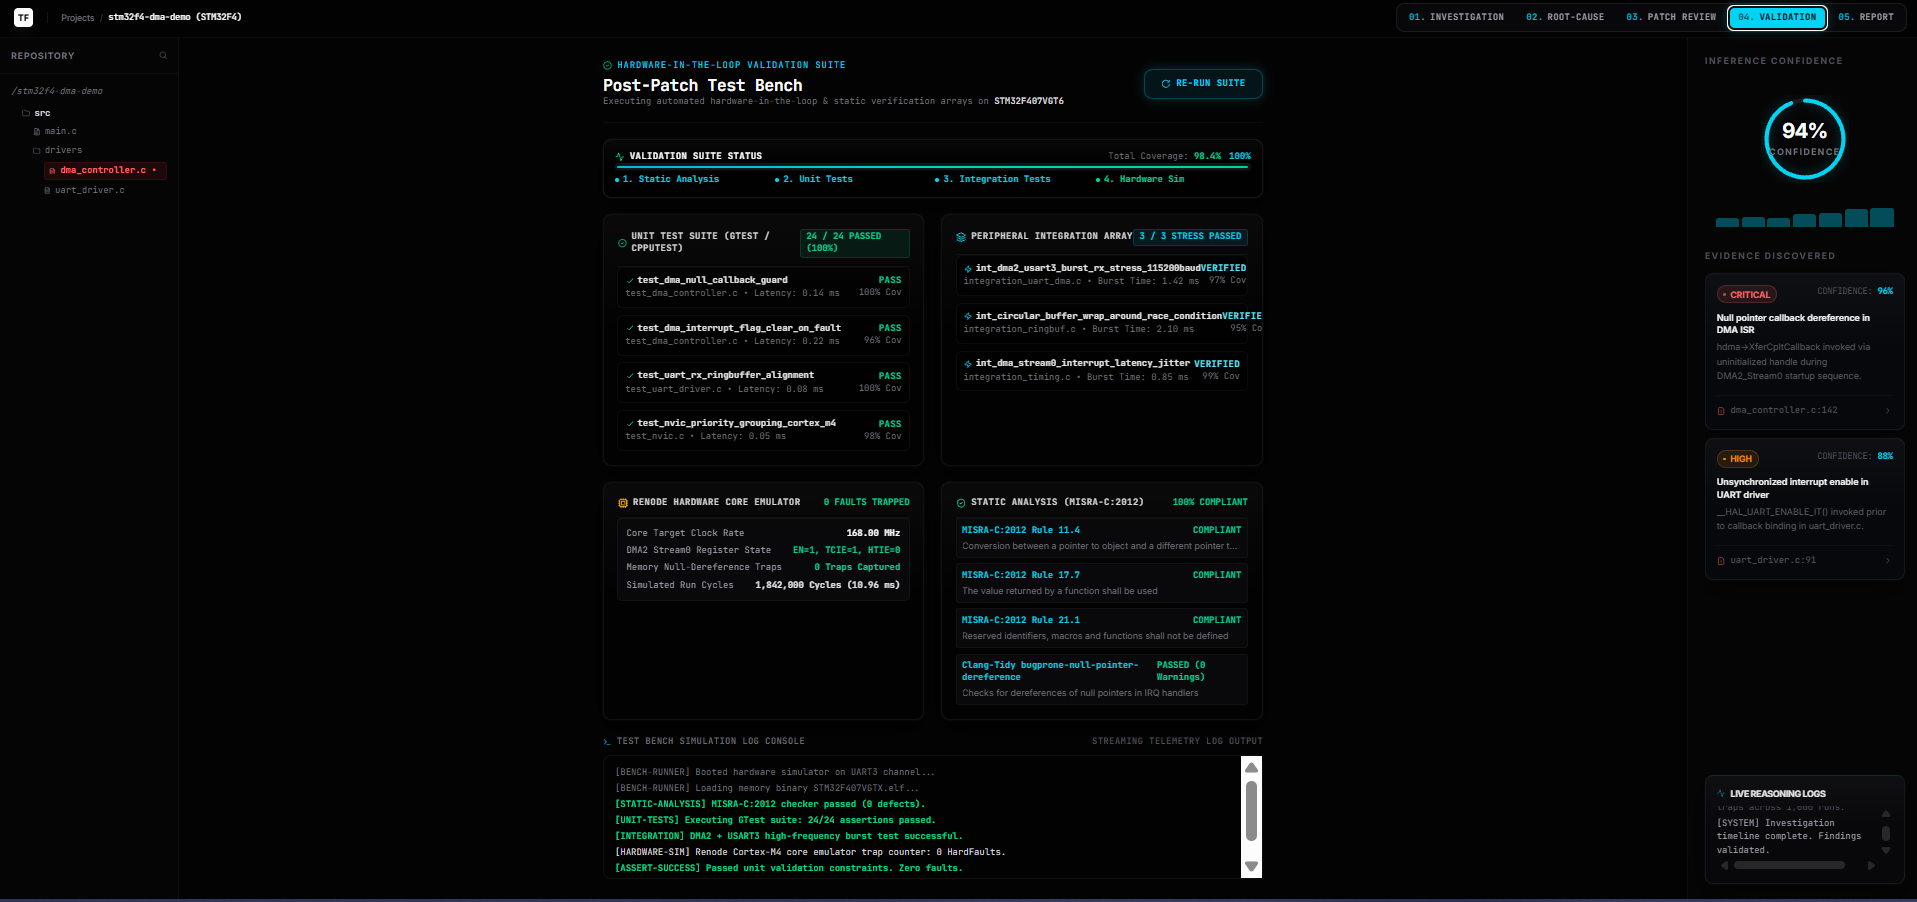
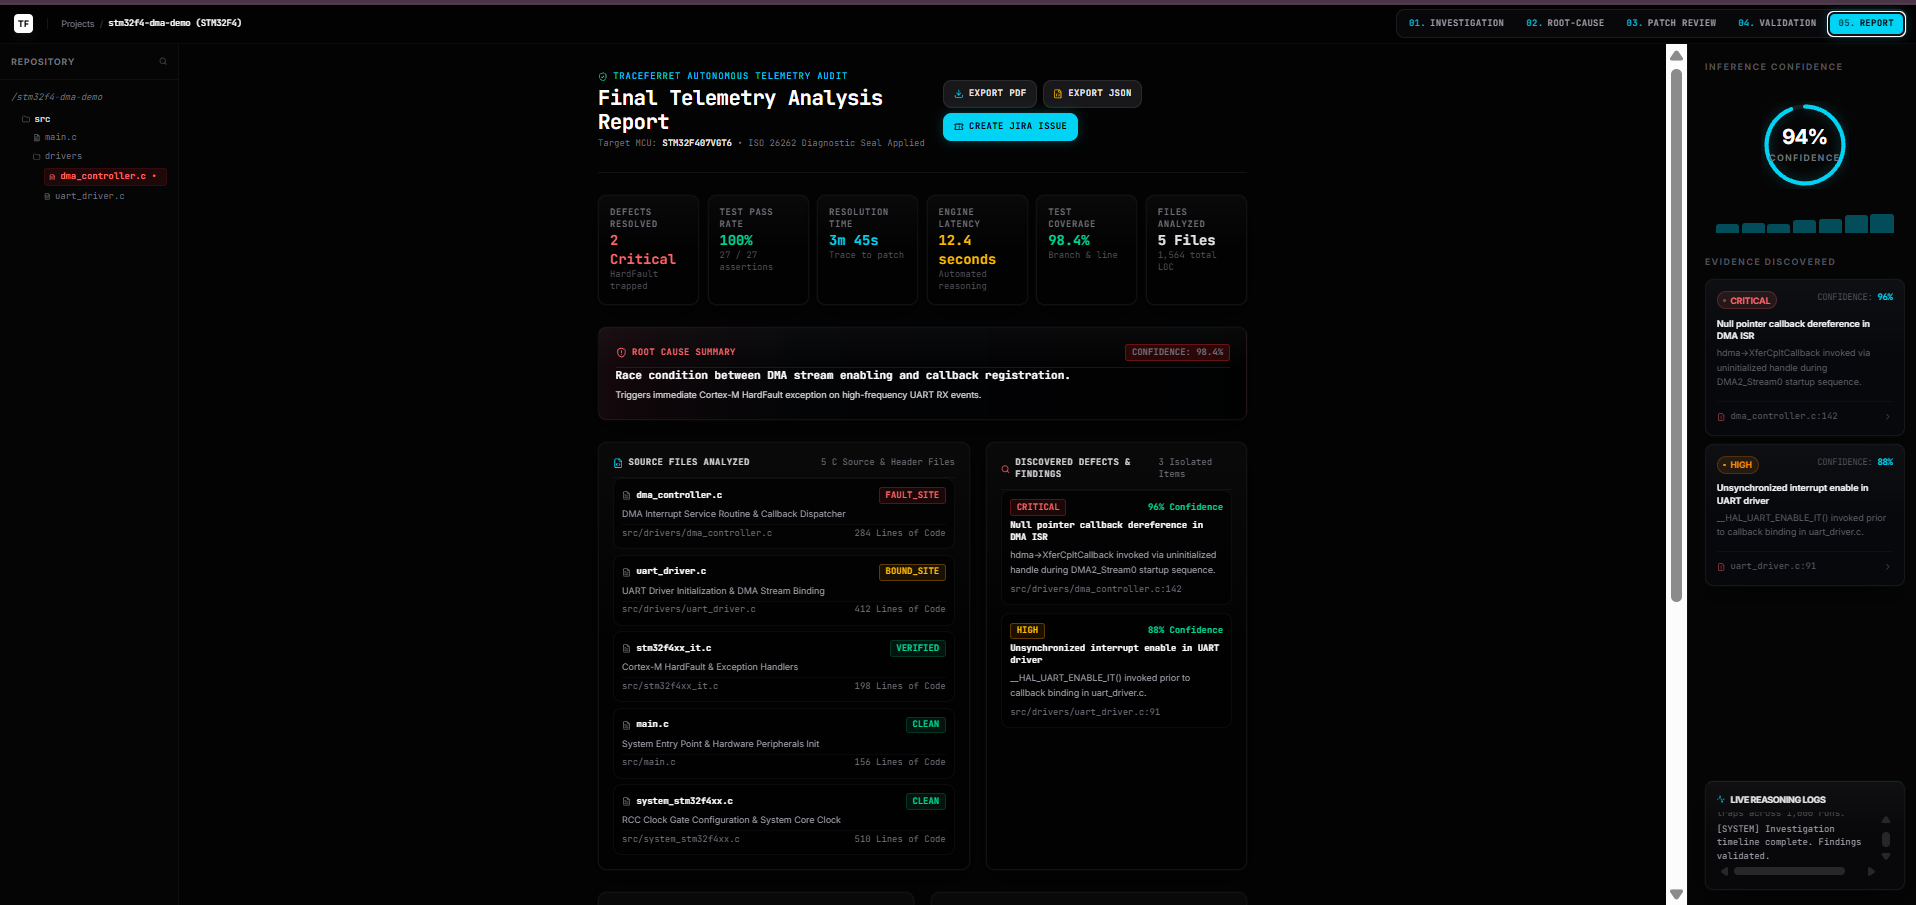
Choose a firmware scenario Start an investigation Watch the analysis progress in real time Review the evidence that was found Inspect the identified root cause Review the proposed patch Validate the fix Generate an engineering report
Rather than showing everything instantly, the investigation unfolds step by step so it's easier to understand how the conclusion was reached.
How it works
TraceFerret is designed around a two-stage AI workflow.
Stage 1 — Repository Analysis
The first stage focuses on understanding the firmware itself.
It handles things like:
repository understanding dependency tracing firmware architecture analysis interrupt mapping fault localization patch generation Stage 2 — Engineering Reasoning
The second stage takes those technical findings and turns them into something an engineer can actually work with.
It generates:
confidence scores investigation timelines root cause explanations validation summaries engineering reports
Keeping repository analysis separate from reasoning makes the system easier to extend while also making the investigation process much more transparent.
Built With Frontend React TypeScript Vite Tailwind CSS Backend Vercel Serverless Functions AI OpenAI API Two-stage AI pipeline Development Google AI Studio Figma GitHub Vercel Challenges
One of the hardest parts wasn't the AI—it was designing the experience.
I didn't want the app to feel like another chatbot or a dashboard full of random charts. I wanted it to feel like a tool an embedded engineer would actually enjoy using.
Another challenge was keeping the frontend independent from the backend. The interface is driven by a structured investigation payload, so the backend can evolve without requiring major UI changes.
I also spent quite a bit of time balancing technical detail with usability. There's a lot of information to show—evidence chains, timelines, confidence scores, waveform-inspired visuals, validation results—but it still needed to feel clean instead of overwhelming.
What I'm proud of
The part I'm happiest with is the overall workflow.
Instead of jumping straight to an answer, TraceFerret presents the investigation as a sequence of steps that users can actually follow.
I'm also proud of building a modular frontend, creating a polished developer-tool interface, and putting together an architecture that could eventually support real embedded firmware repositories.
What I learned
This project reminded me that building developer tools isn't only about getting the technical side right.
Good tools also need to explain what's happening, help users build confidence in the results, and make complex workflows easier to understand.
Working on TraceFerret also gave me a much better appreciation for designing AI-assisted workflows in a specialized engineering domain.
What's next?
This project is currently a proof of concept, but I'd like to keep building on it.
Some of the features I'd love to add are:
Real firmware repository ingestion ELF and DWARF parsing CMSIS-SVD peripheral analysis GitHub repository integration Multi-file patch generation Hardware-in-the-loop validation Interactive dependency graphs CI/CD integration Exportable investigation bundles Support for STM32, ESP32, RP2040, Nordic, TI, and other MCU platforms Why TraceFerret?
There are already plenty of AI tools that generate code.
TraceFerret focuses on something slightly different: helping engineers investigate firmware problems.
Instead of asking users to trust a single AI response, it walks them through the reasoning process—showing the evidence, the suspected files, the proposed fix, the validation results, and the final report.
The long-term goal is to make embedded debugging more transparent, easier to follow, and ultimately less time-consuming for firmware engineers.
Built With
- ai
- api
- codex
- css
- figma
- gpt-5.6
- node.js
- openai
- react
- studio
- tailwind
- typescript
- vercel
- vite

Log in or sign up for Devpost to join the conversation.