-
-
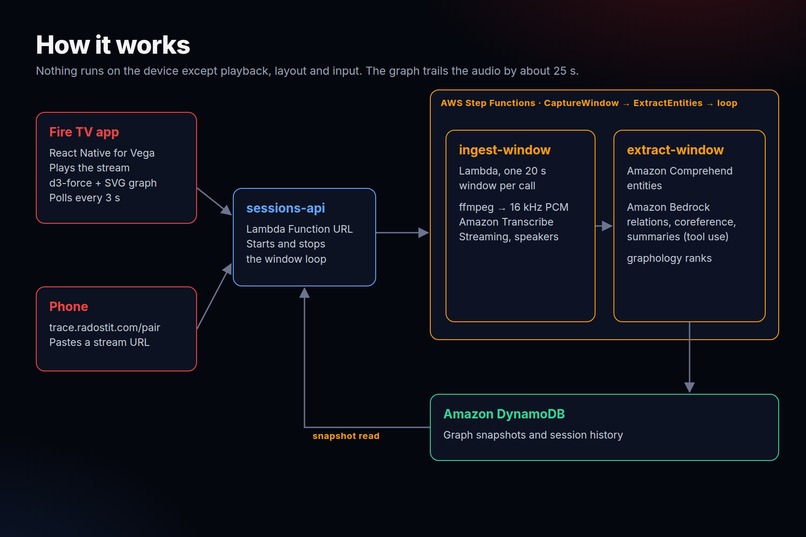
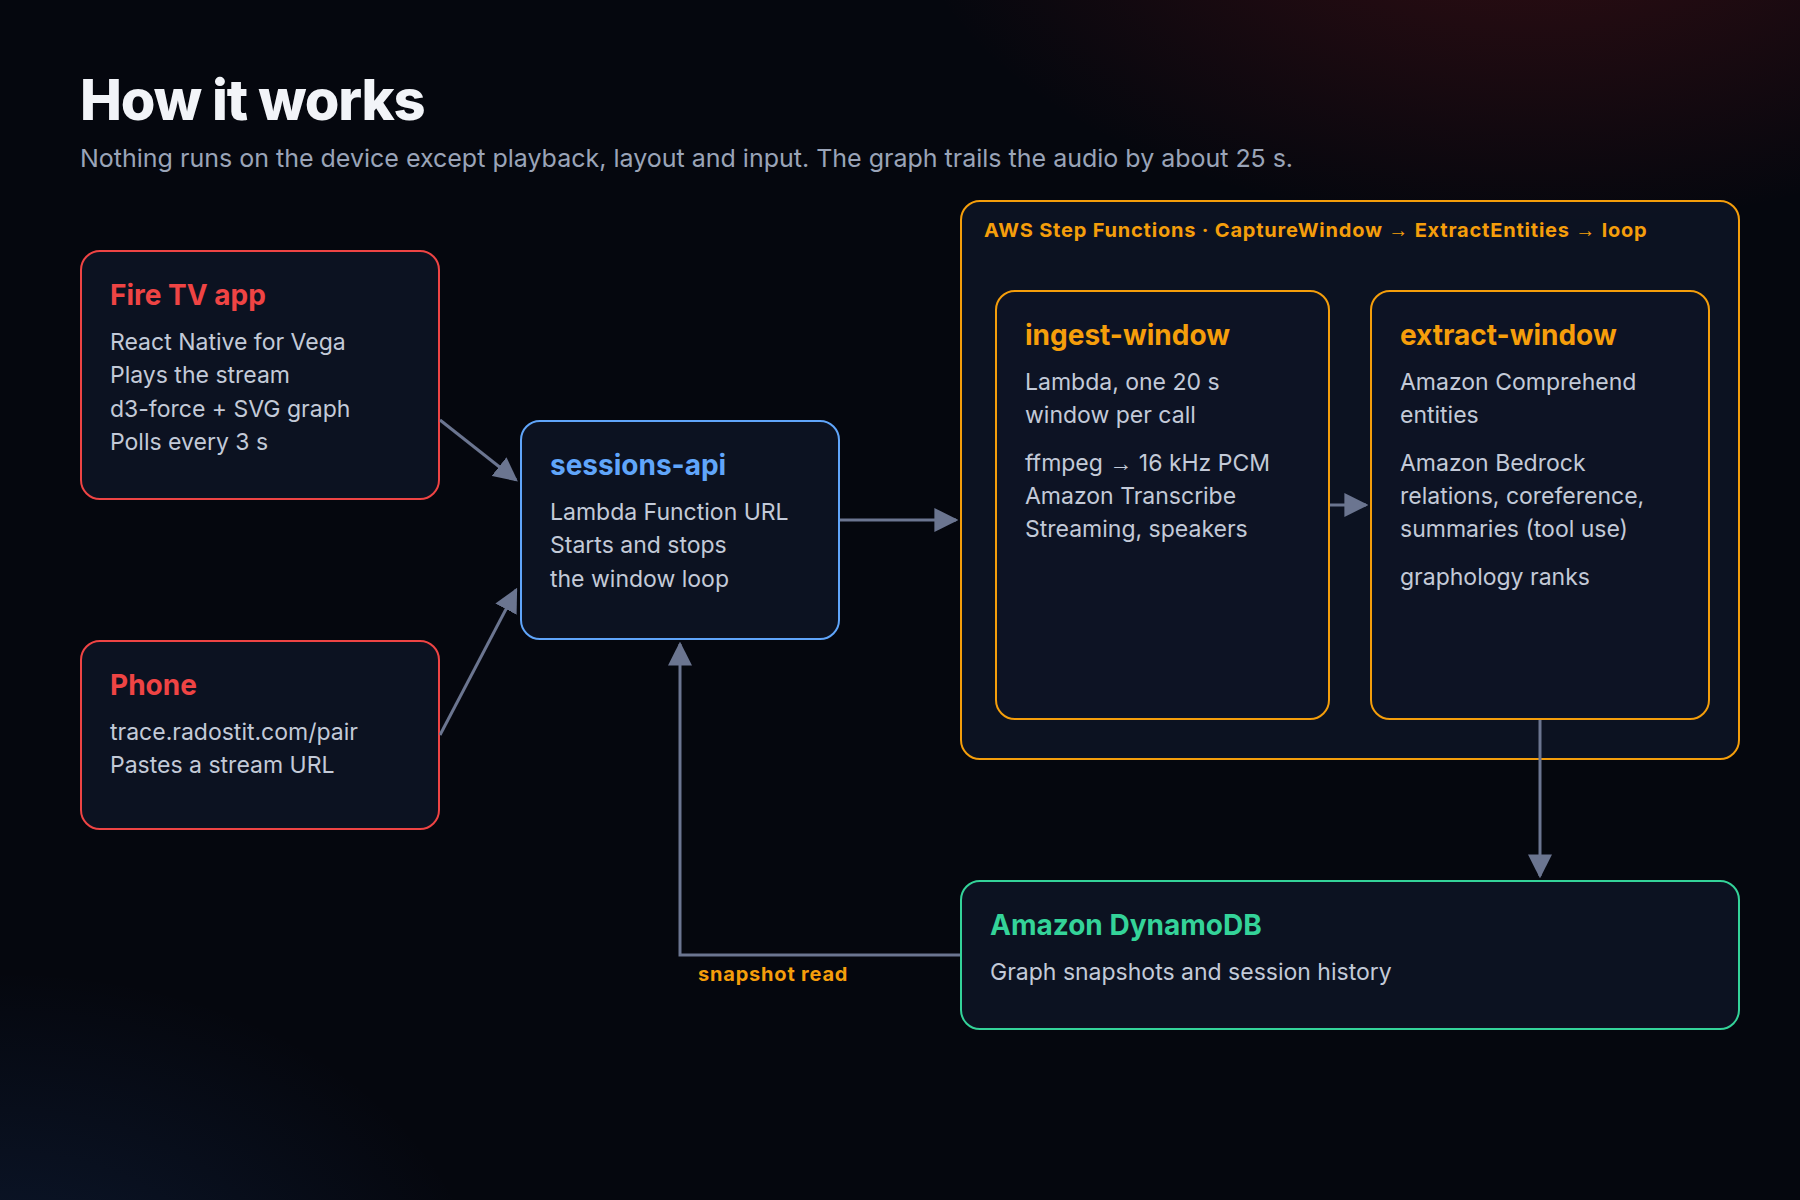
Step Functions loops through Transcribe Streaming, Comprehend and Bedrock, graphs in DynamoDB. TV plays, lays out graph and handles input
-
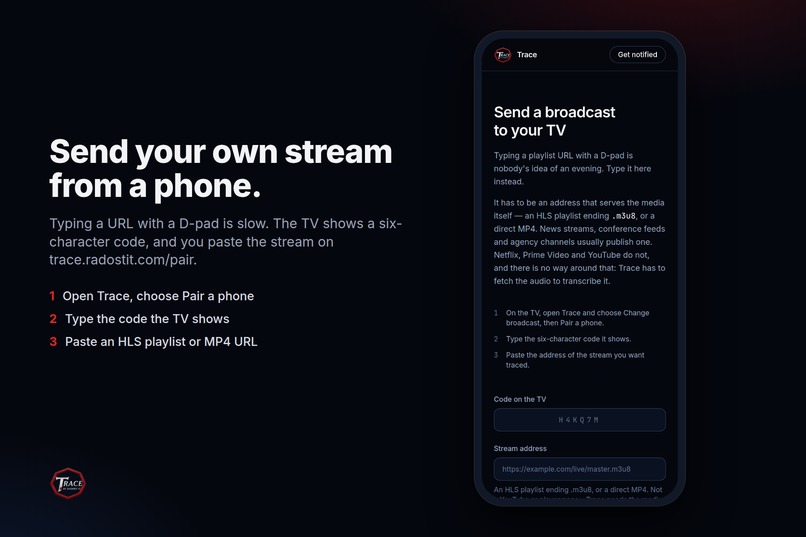
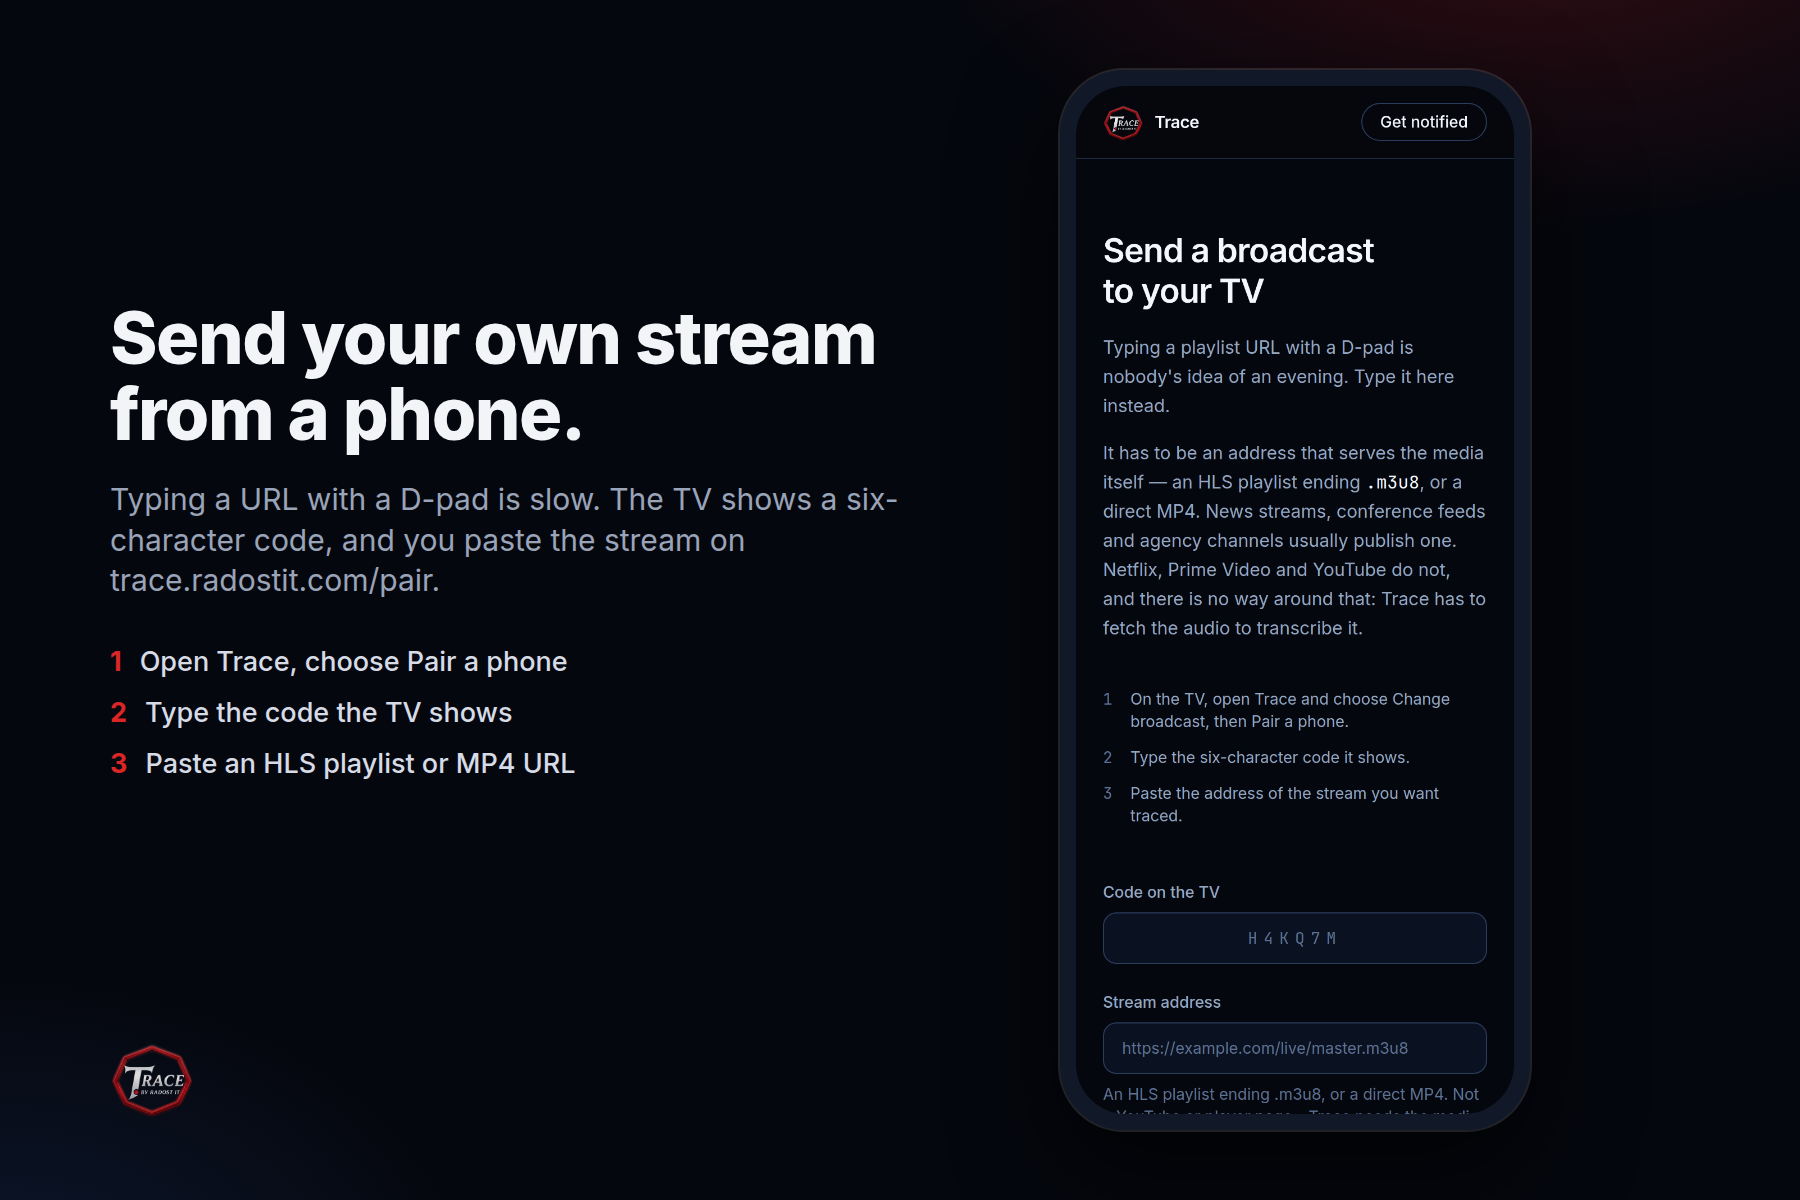
Send your own stream from a phone. The TV shows a six-character code, and you paste an HLS or MP4 URL at trace.radostit.com/pair.
-
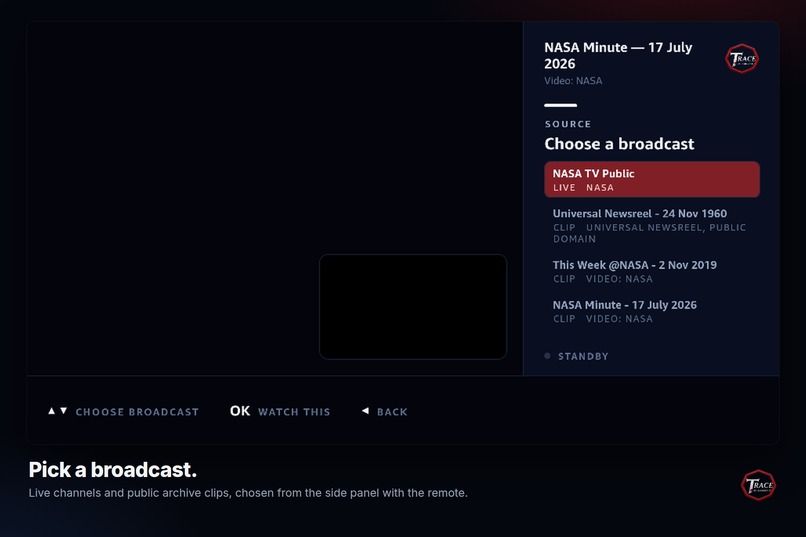
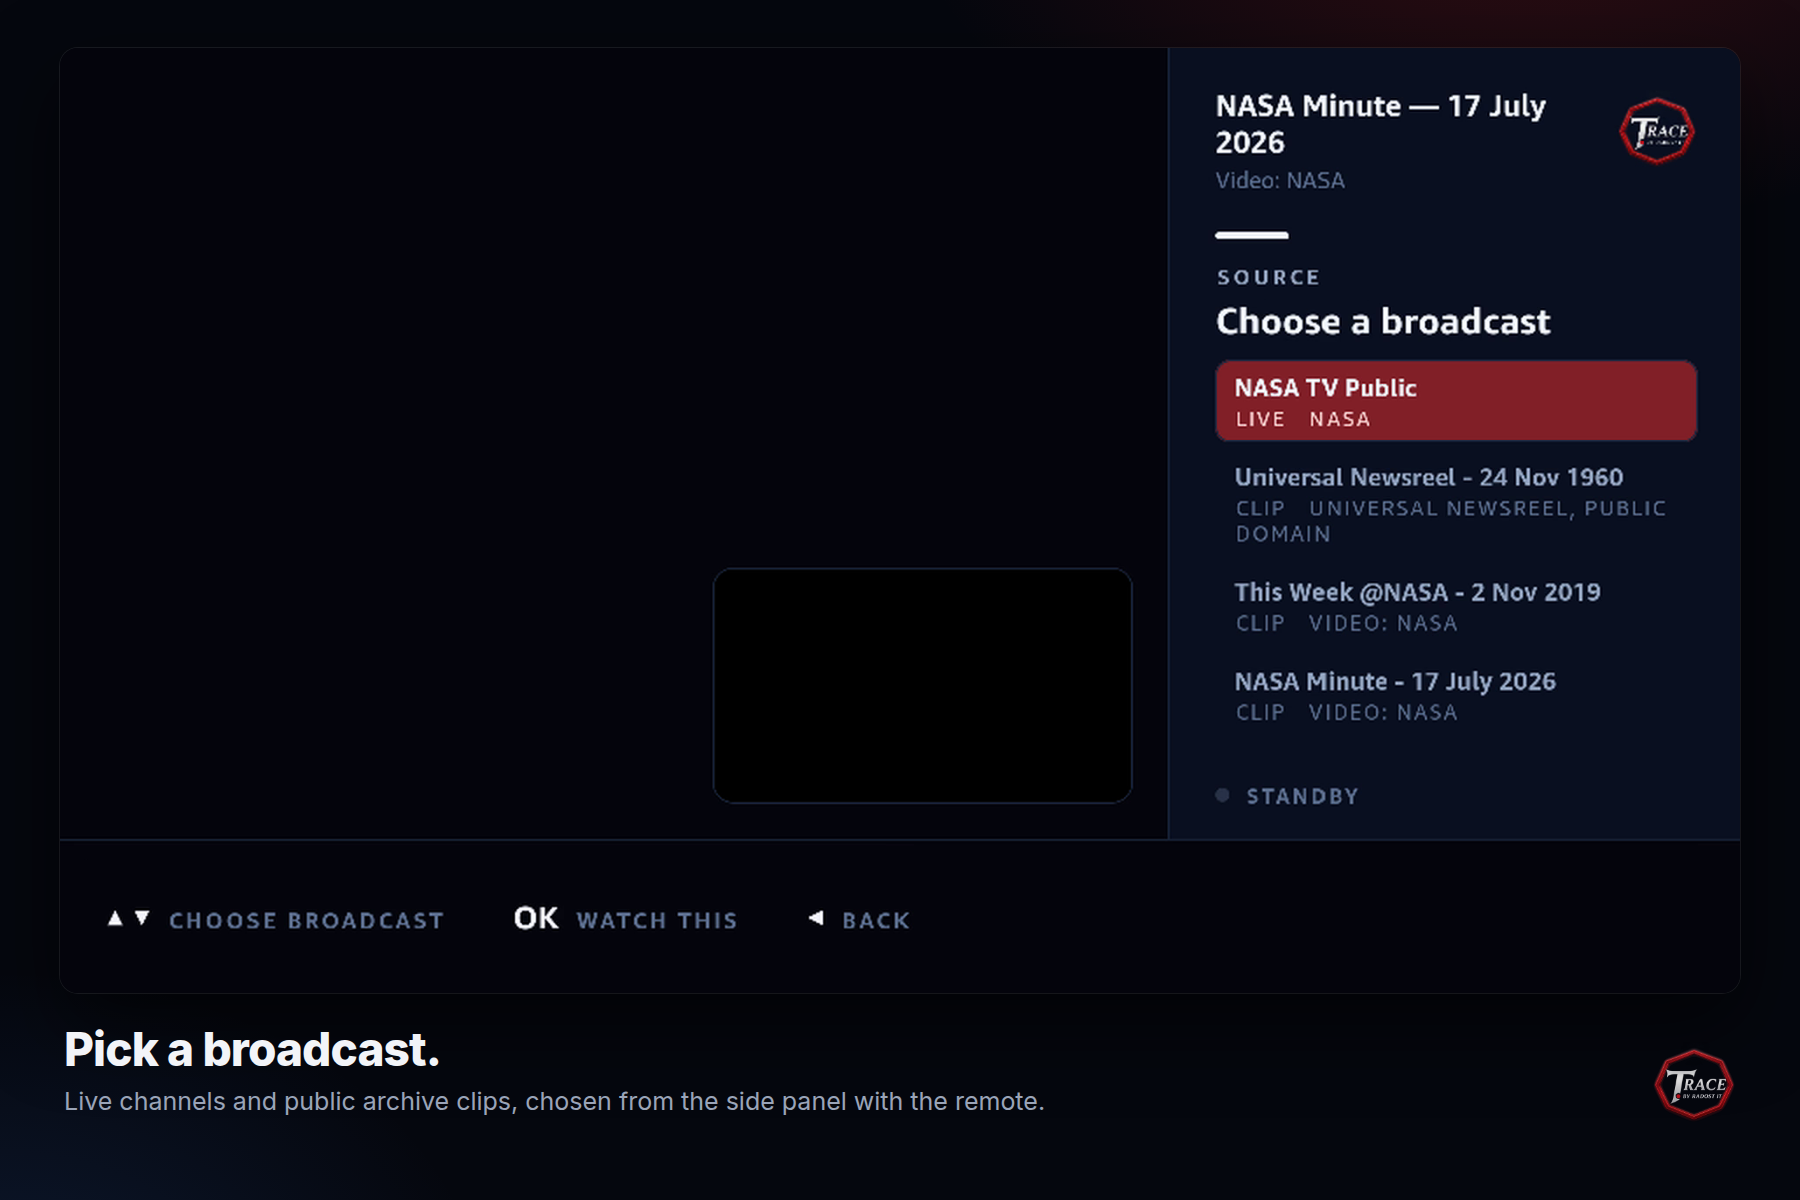
Pick a broadcast from the side panel with the remote. It lists live channels and public archive clips.
-
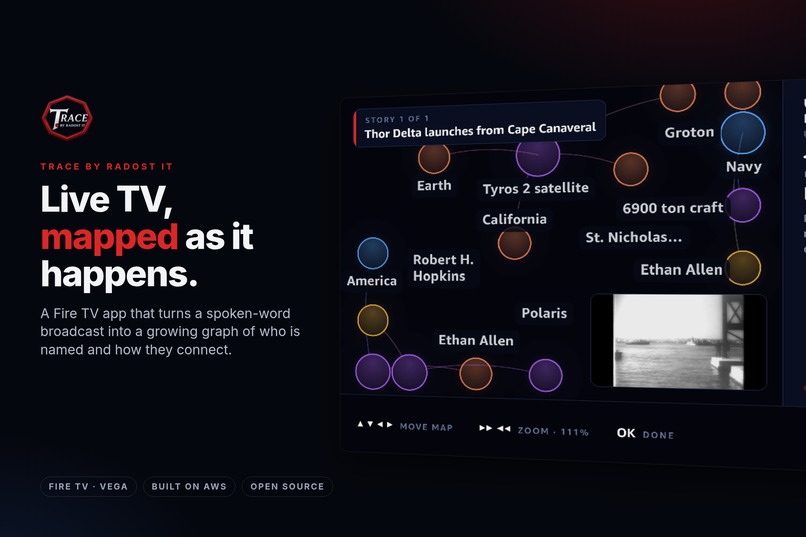
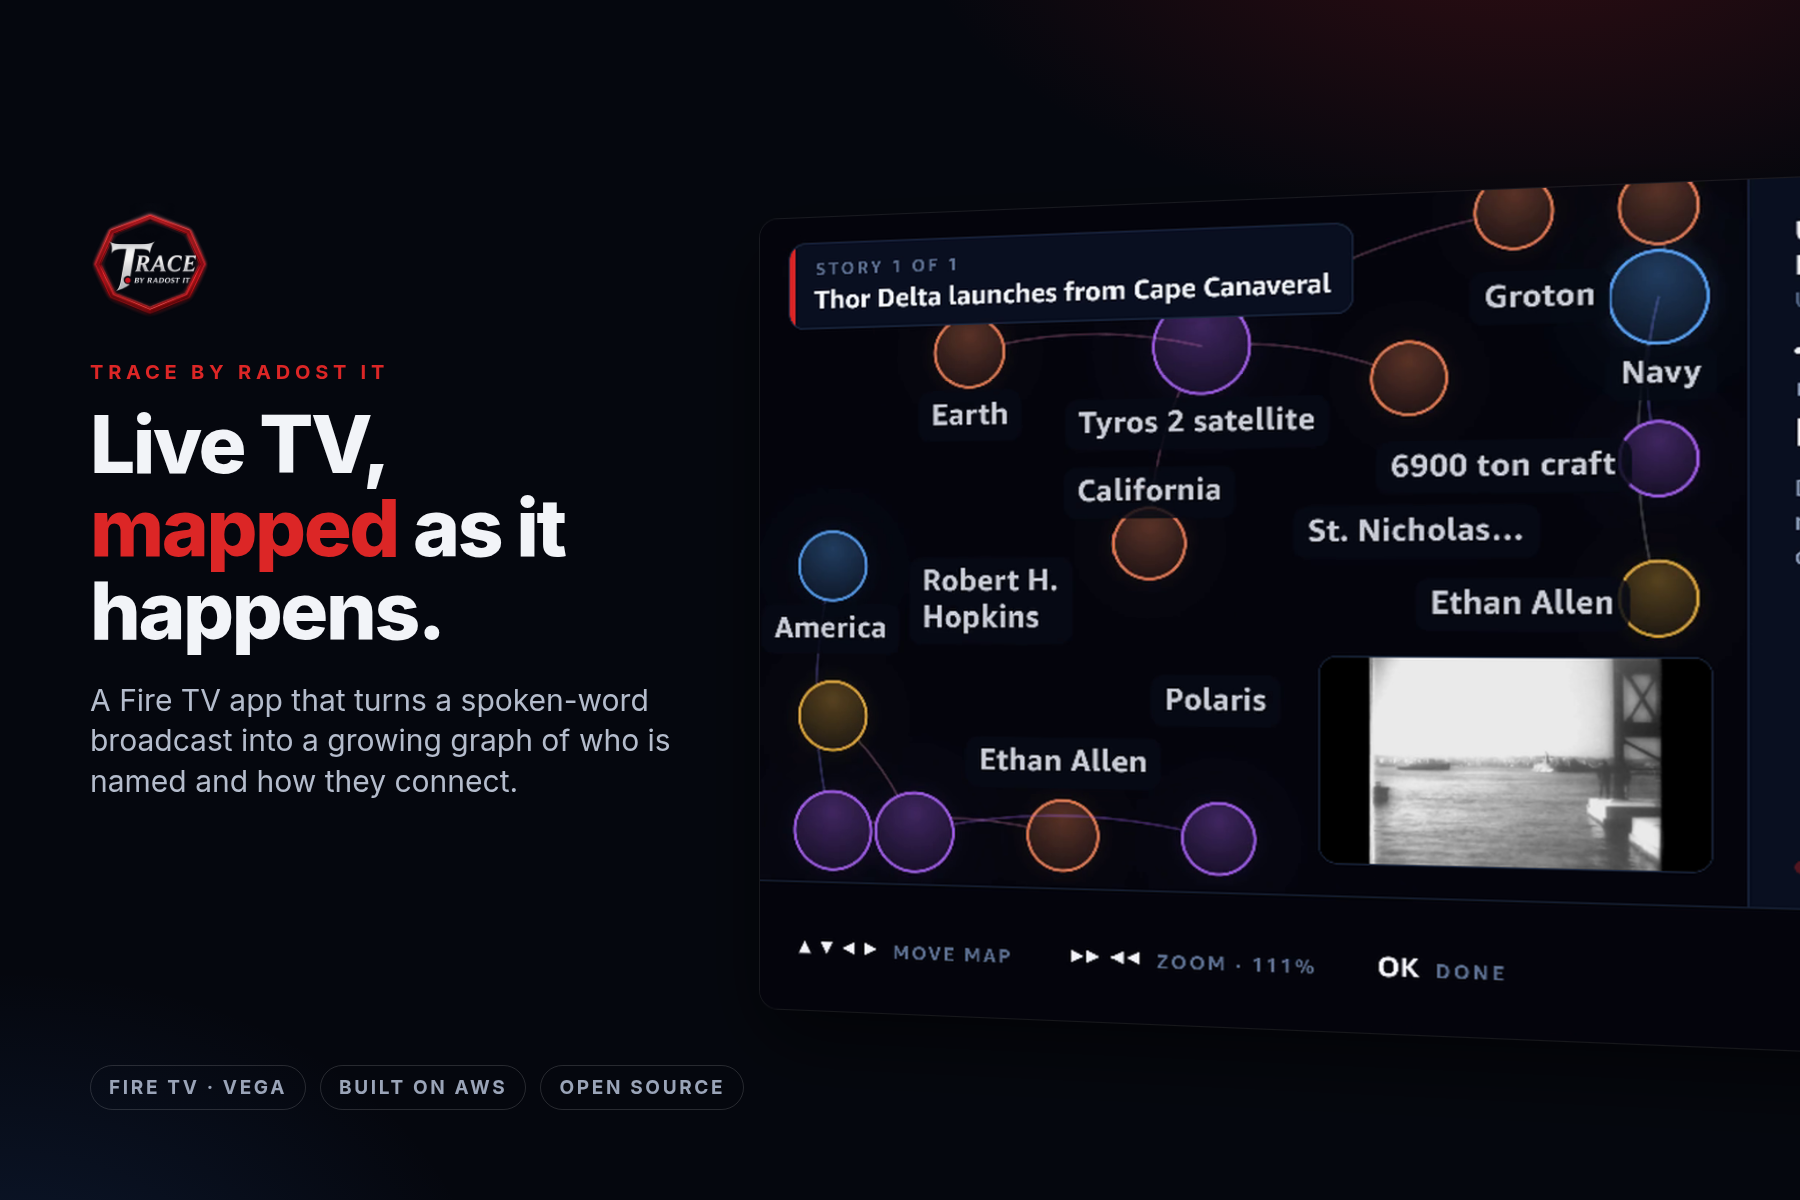
Trace: a Fire TV app that turns a spoken-word broadcast into a live graph of who is named and how they connect.
-
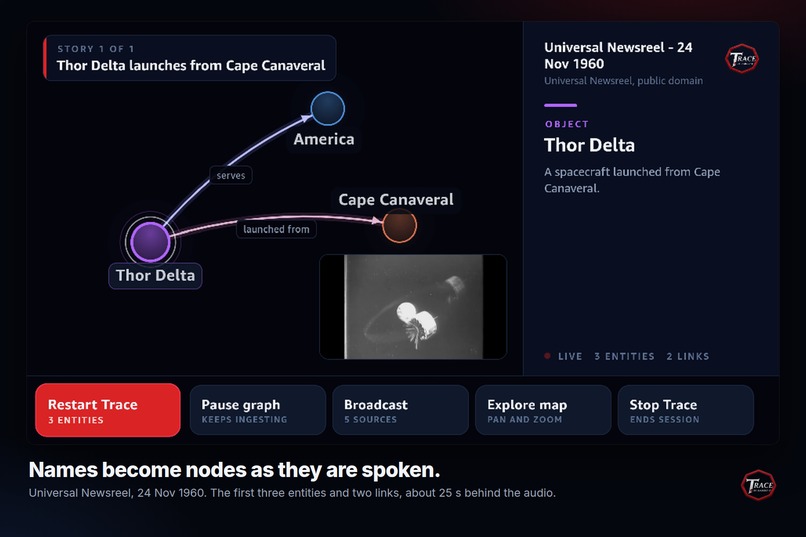
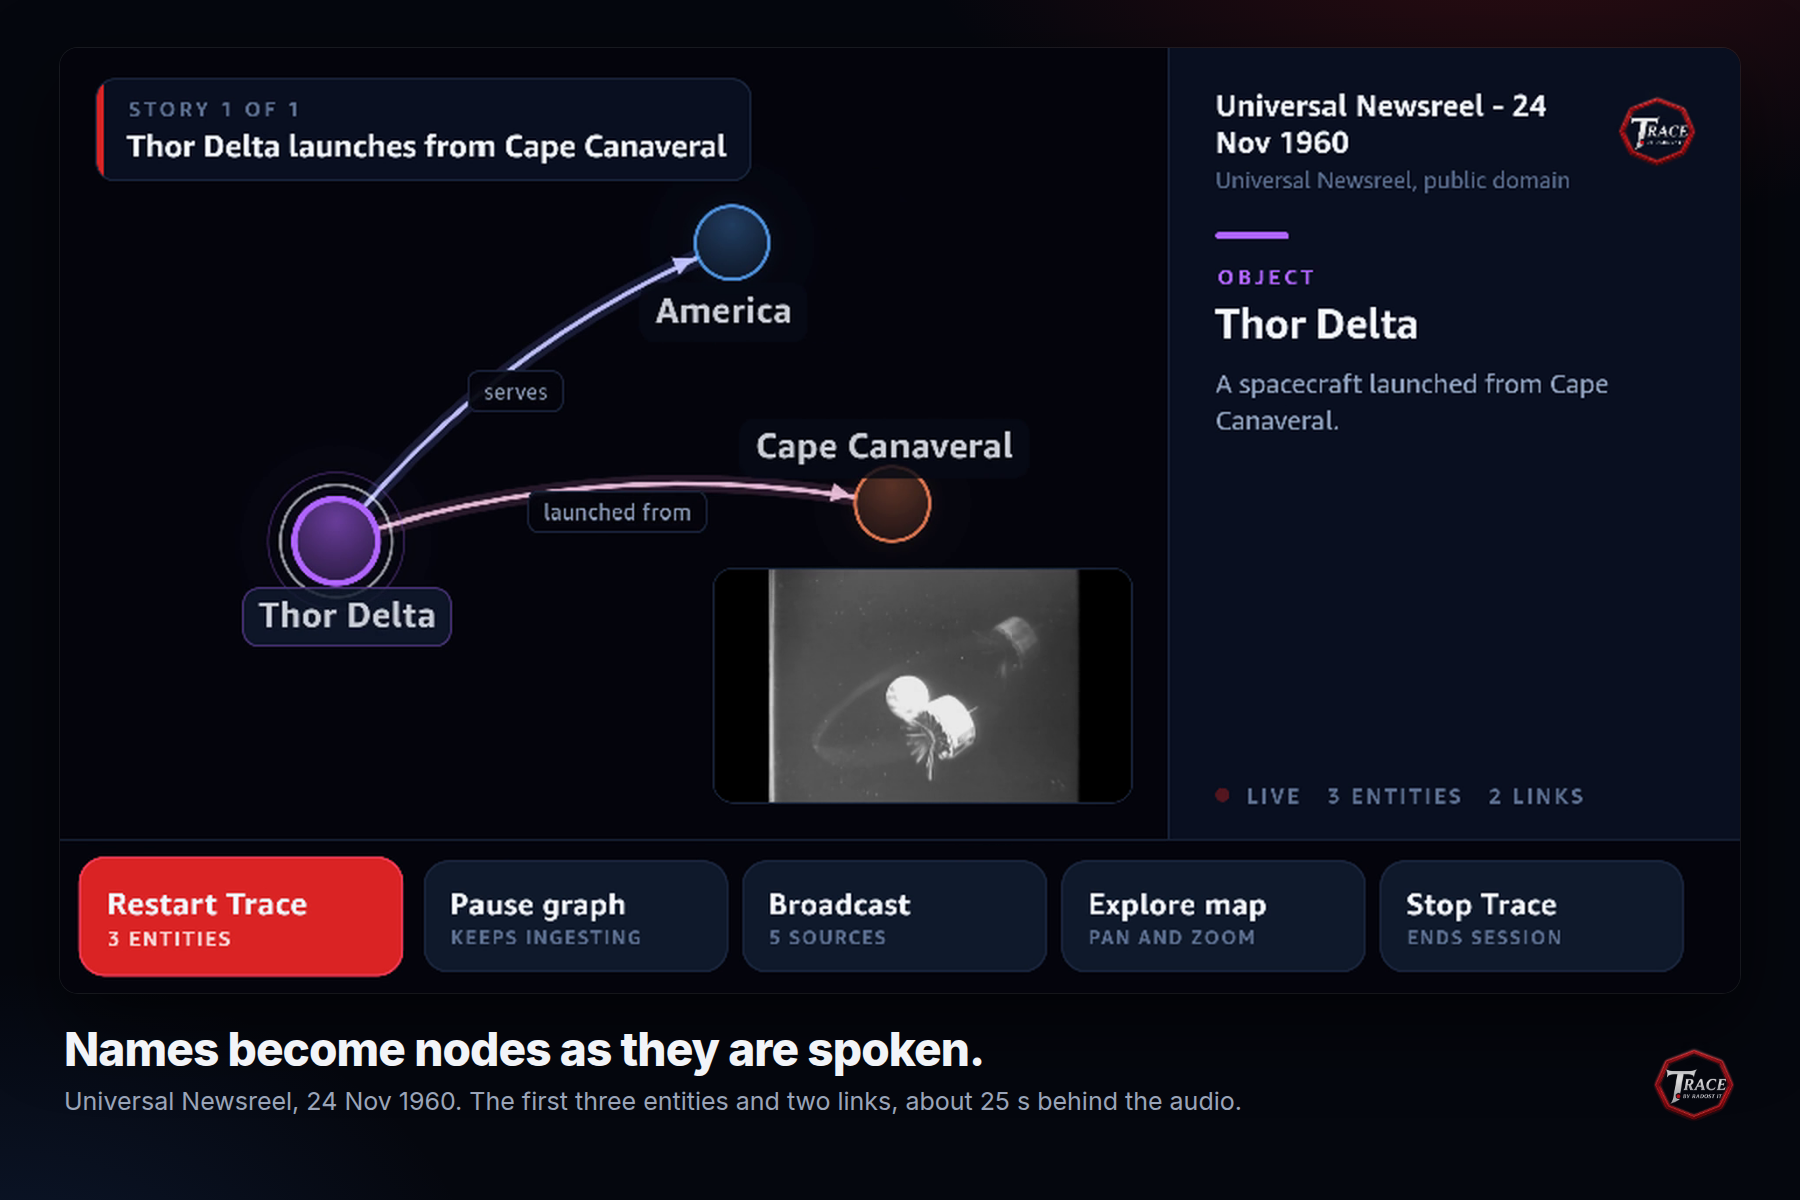
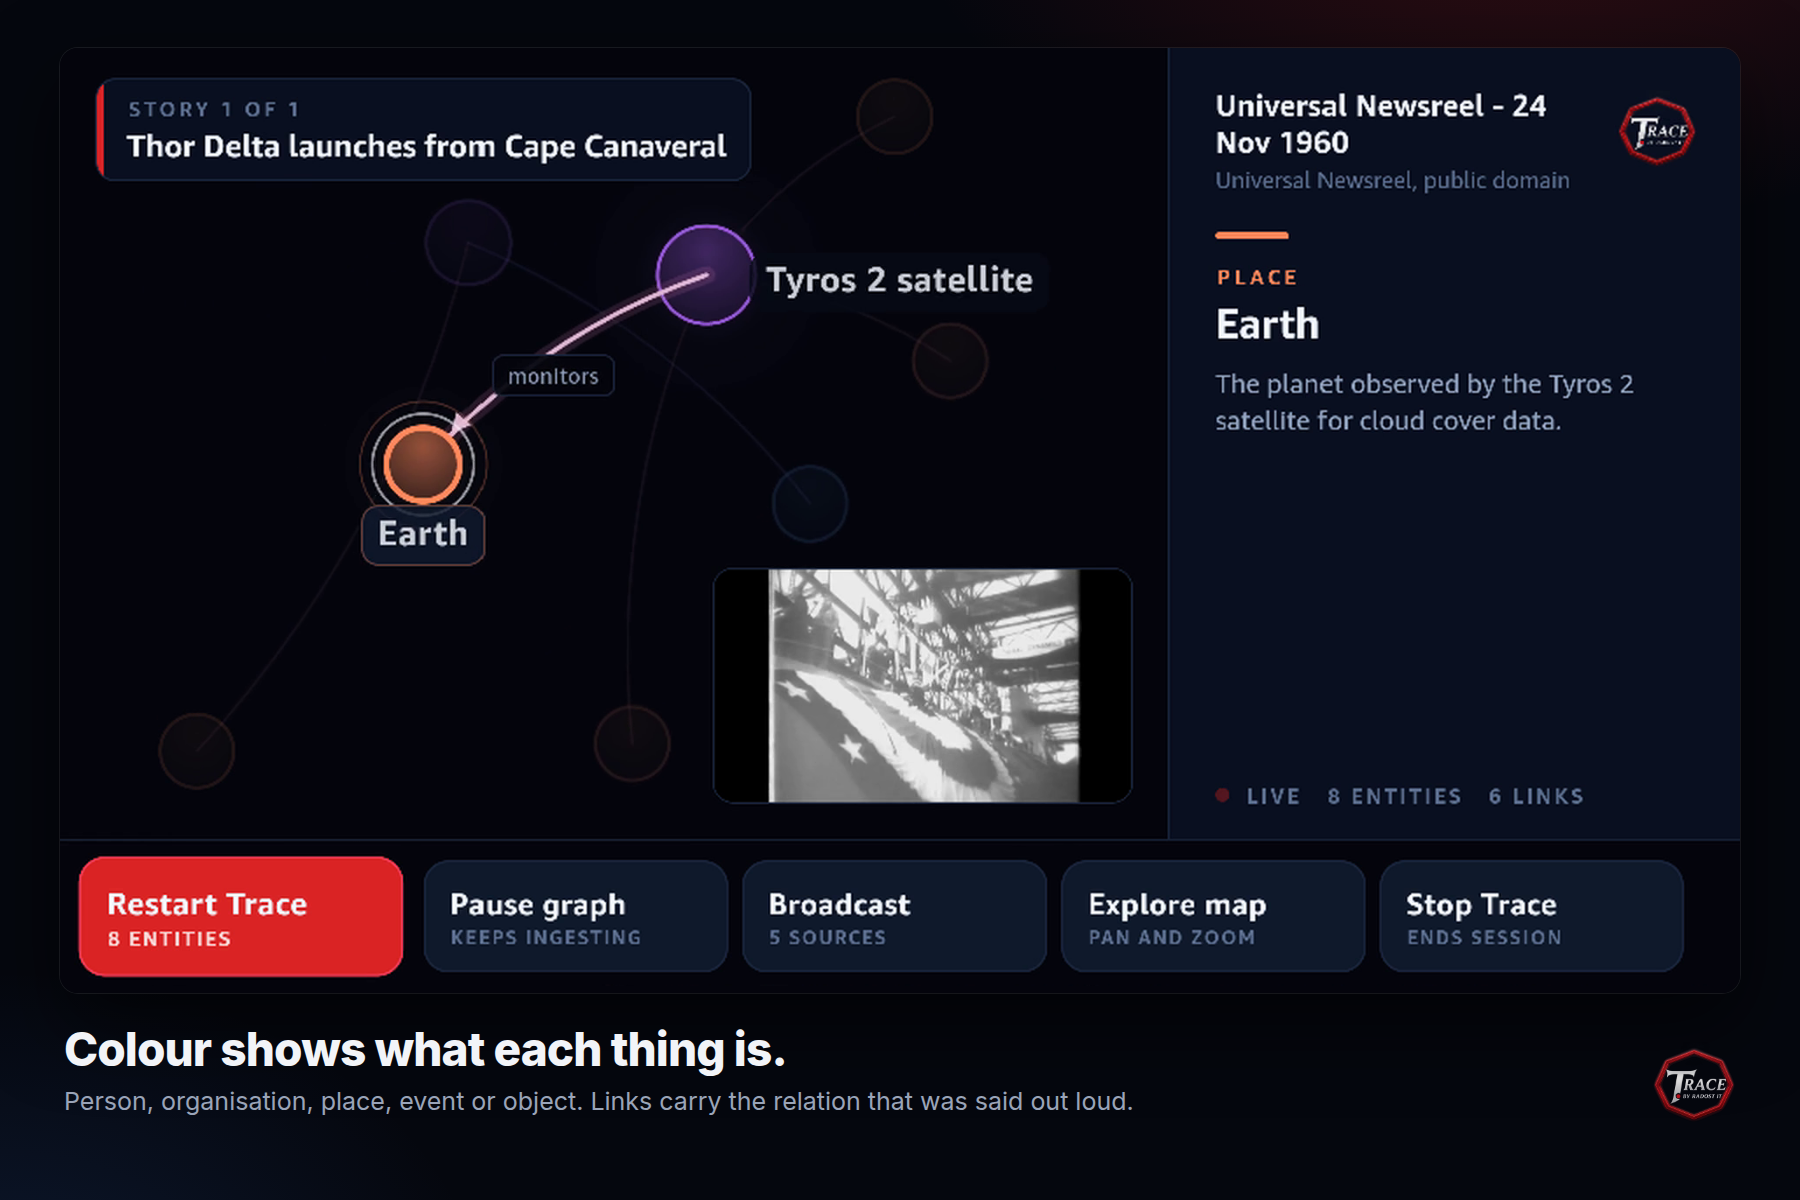
Names become nodes as they are spoken. Universal Newsreel, 24 Nov 1960: three entities and two links.
-
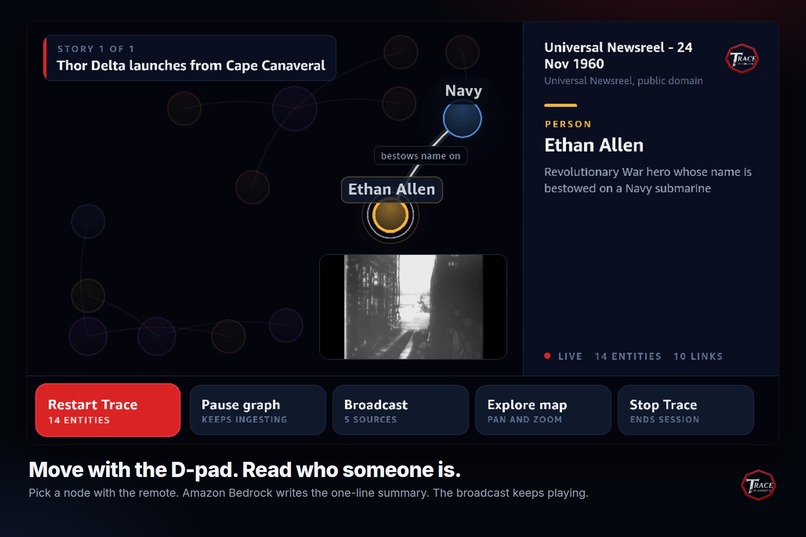
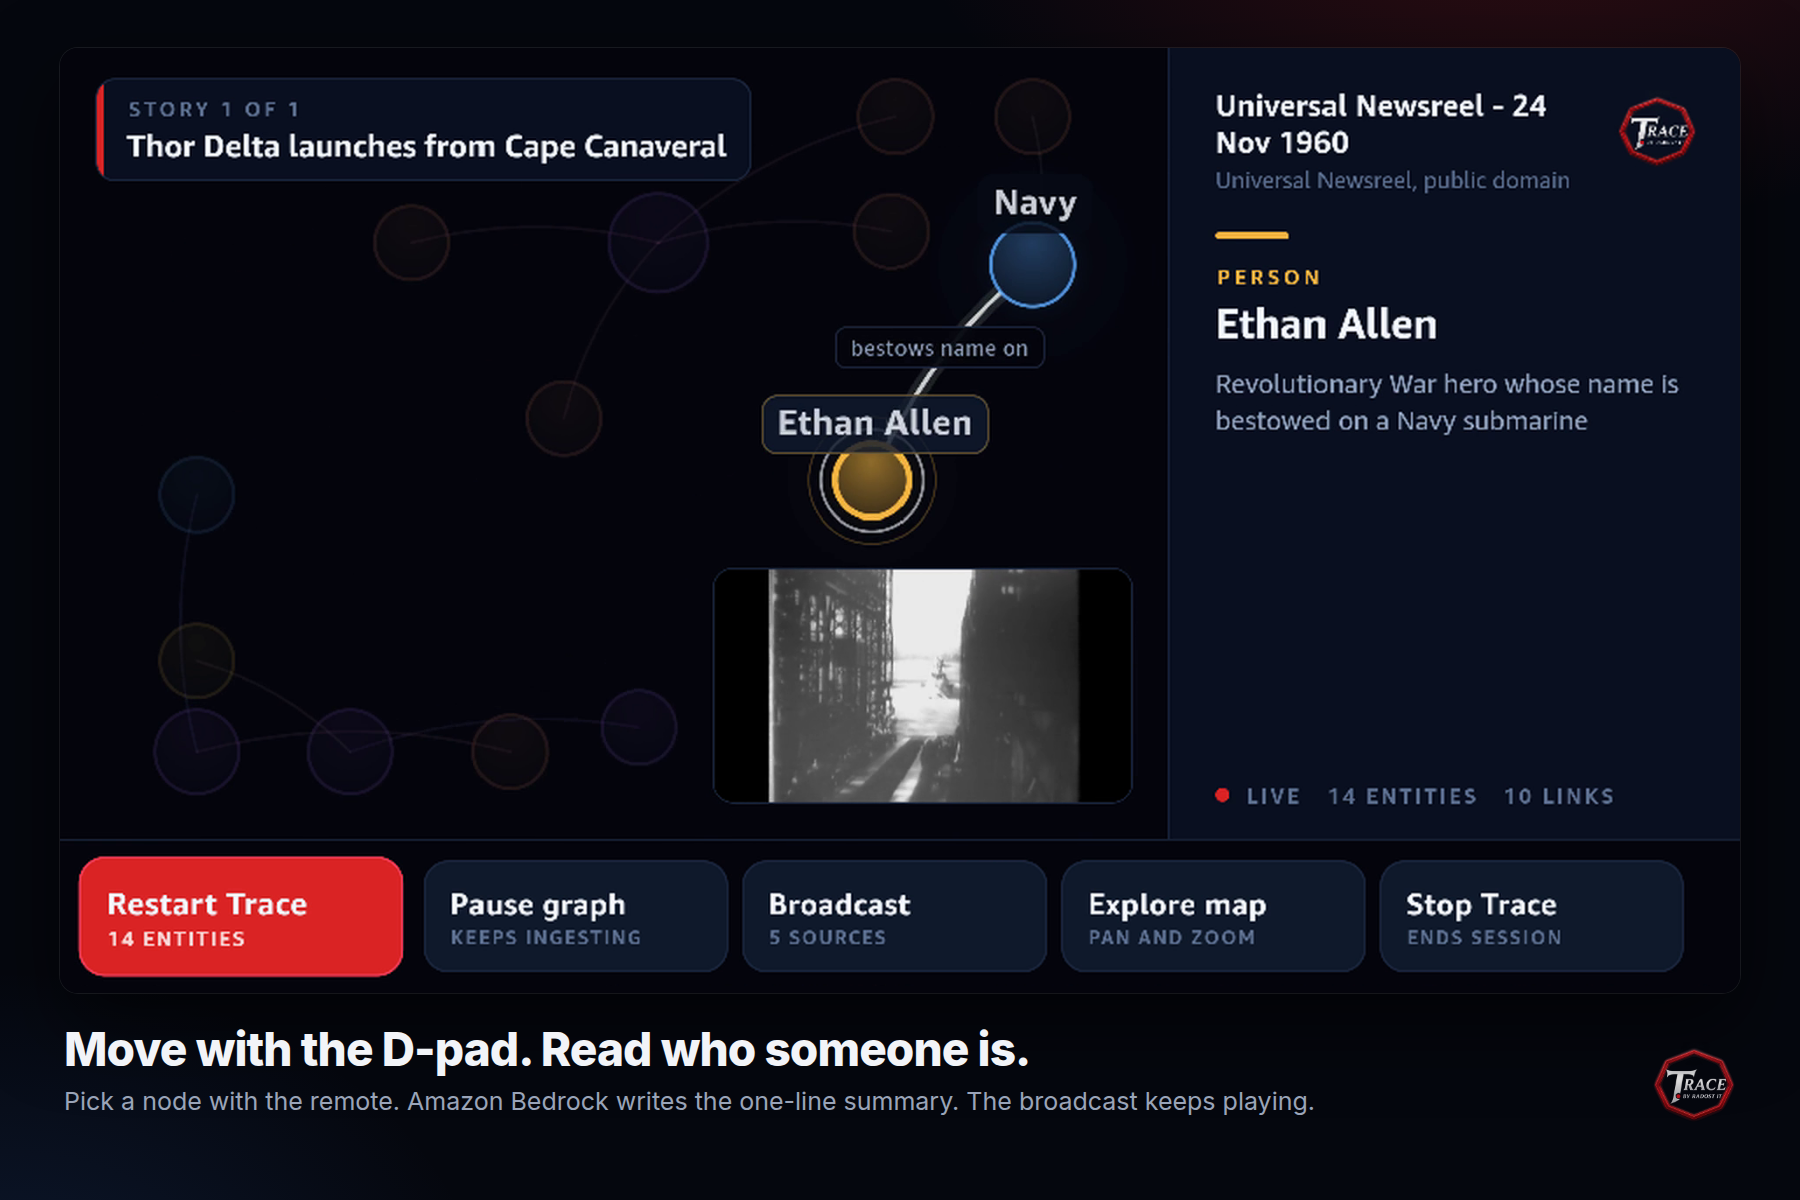
Pick a node with the D-pad. Amazon Bedrock writes a one-line summary while the broadcast keeps playing.
-
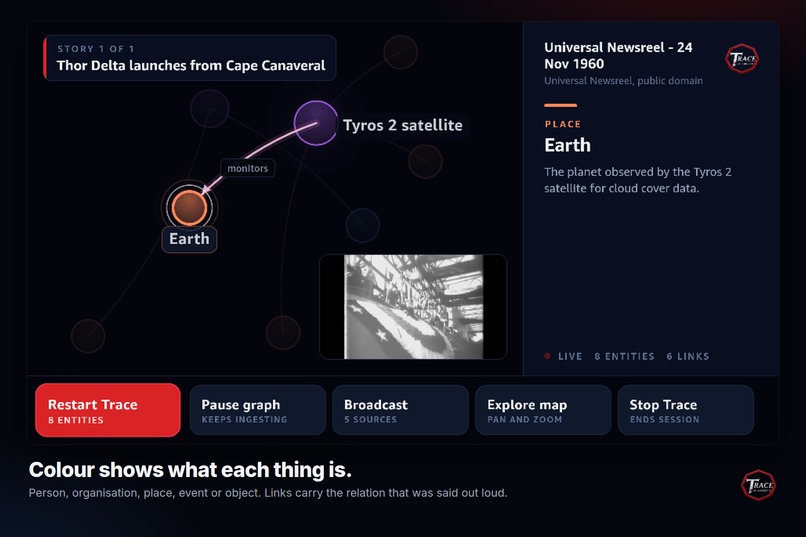
Colour shows the entity type: person, organisation, place, event or object. Each link carries the relation that was said out loud.
-
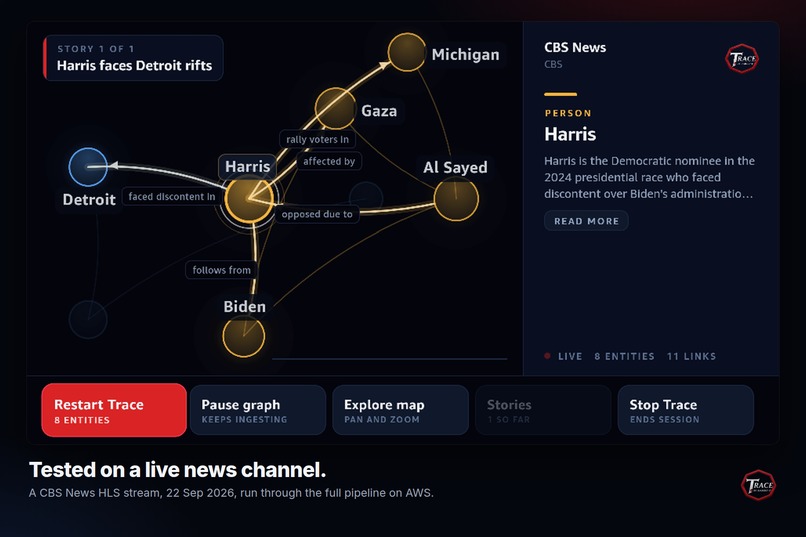
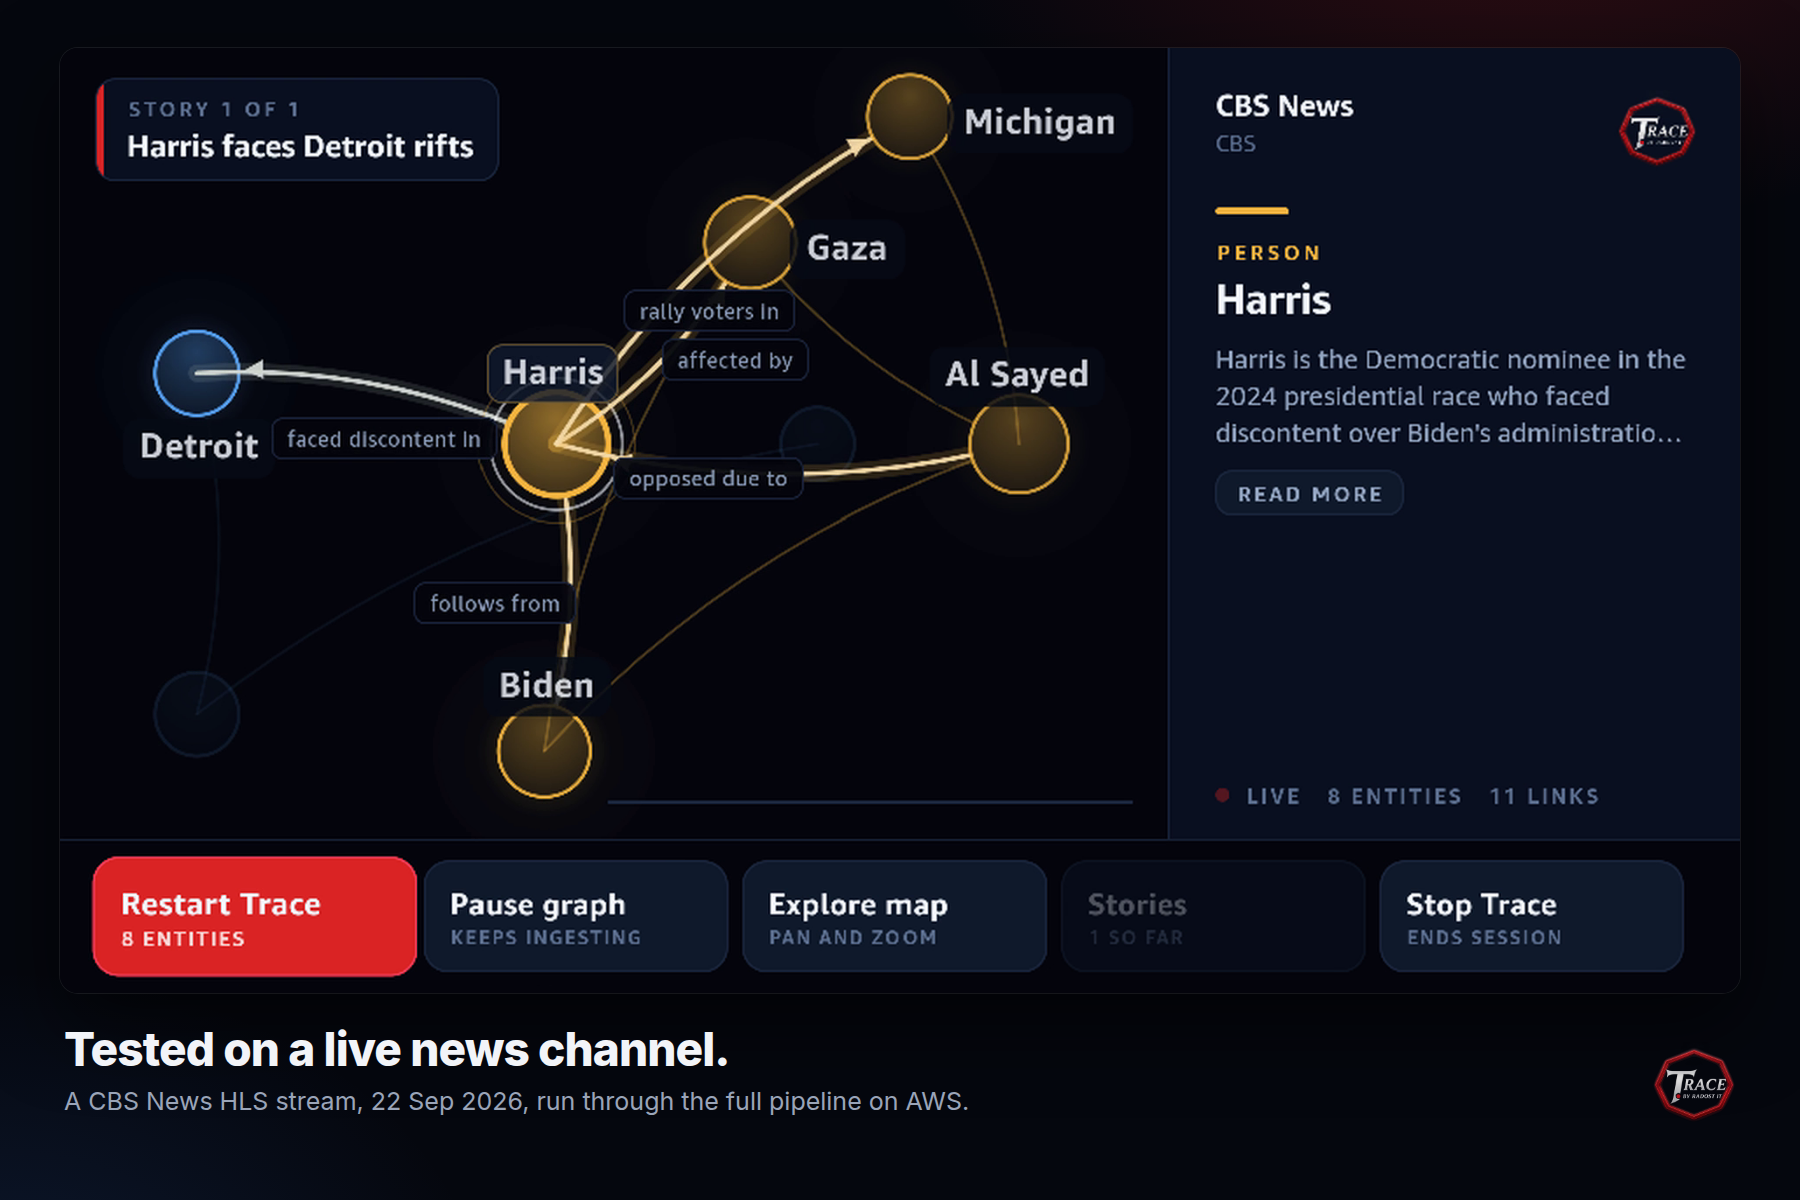
Tested on a live channel: a CBS News HLS stream on 22 Sep 2026, run through the full pipeline on AWS.
-
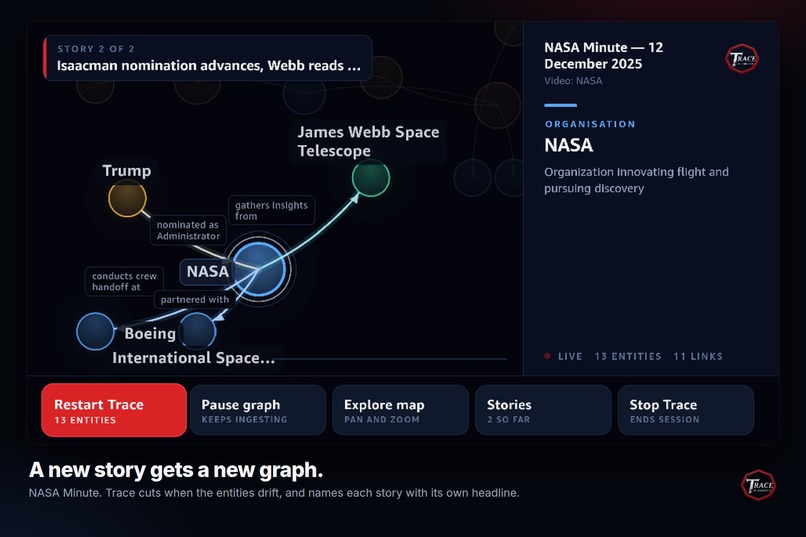
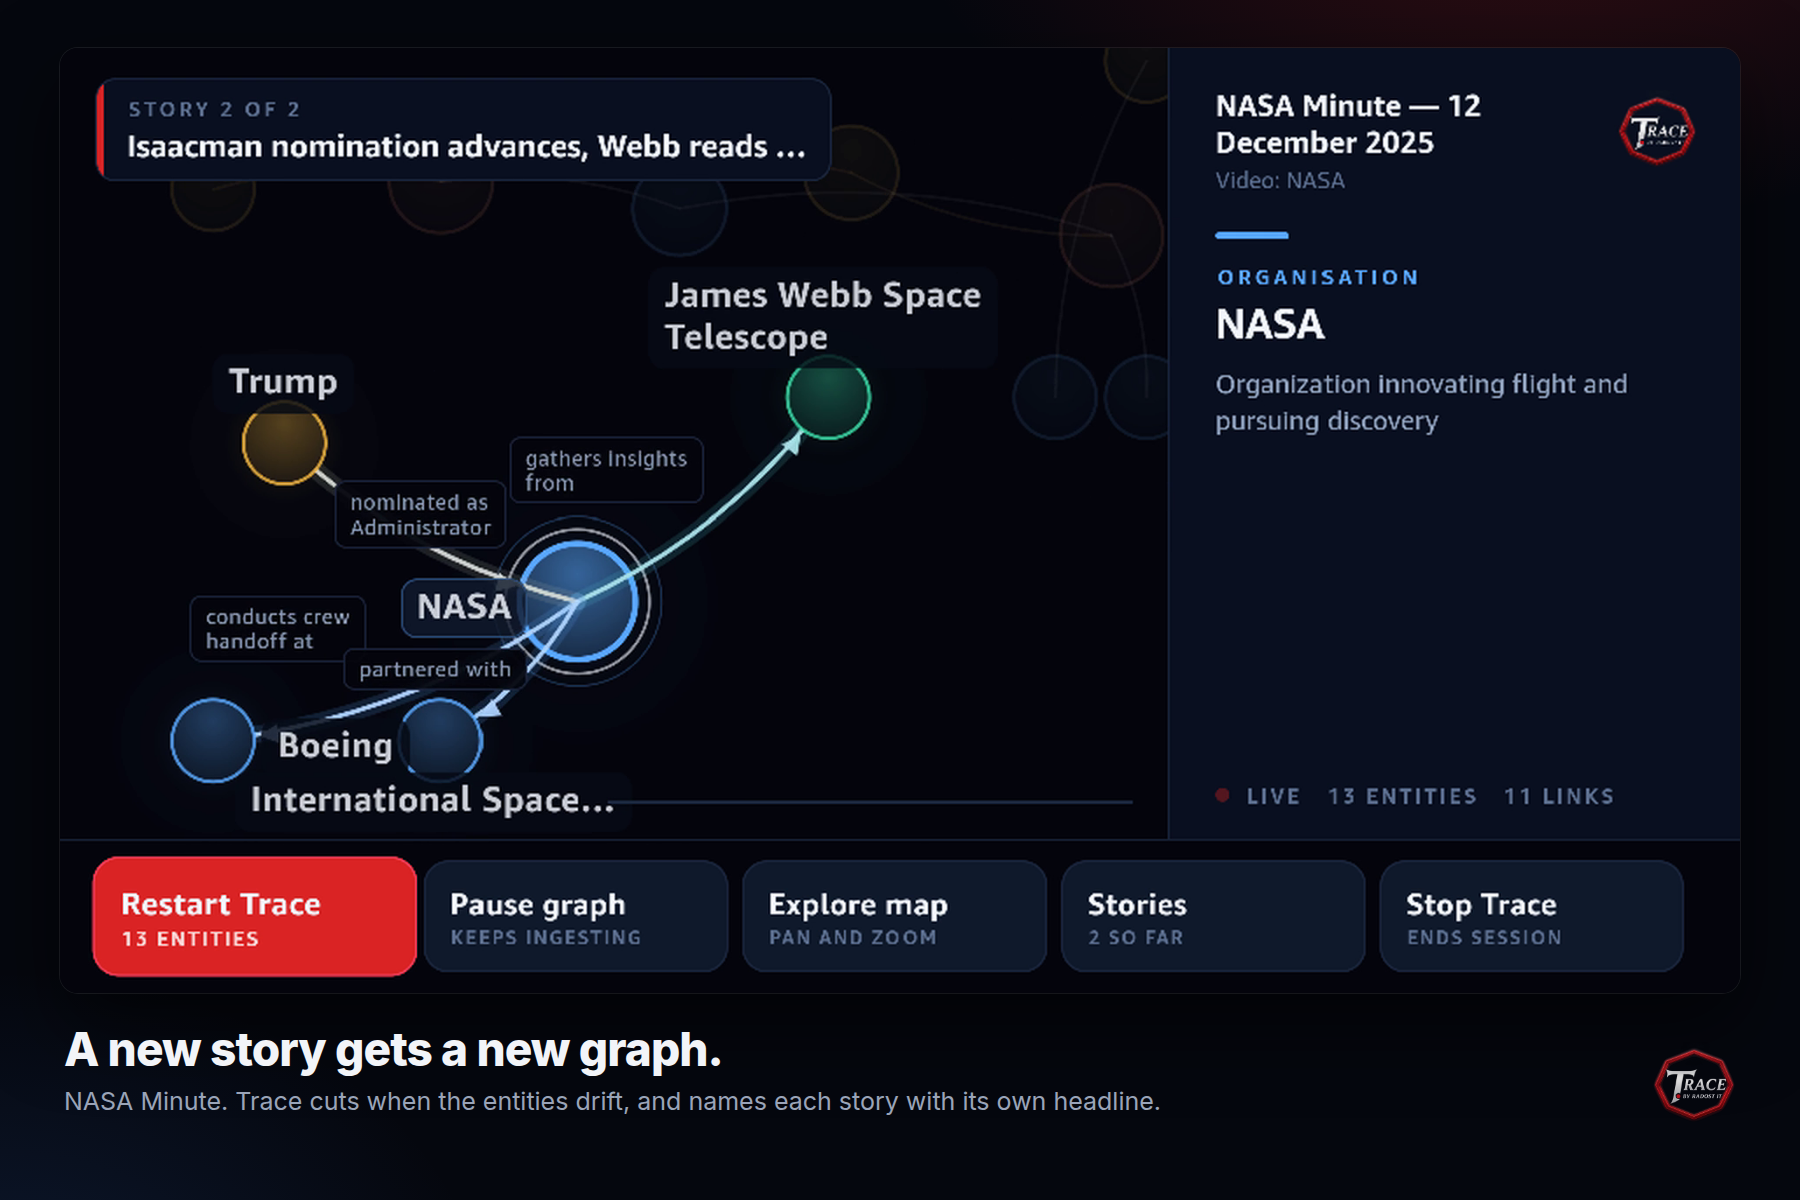
NASA Minute. When the entities drift, Trace starts a new story with its own graph and headline.
-
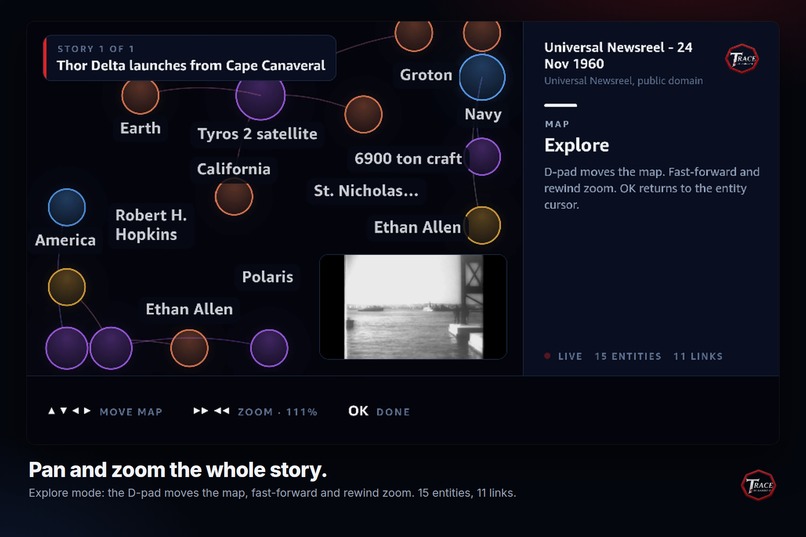
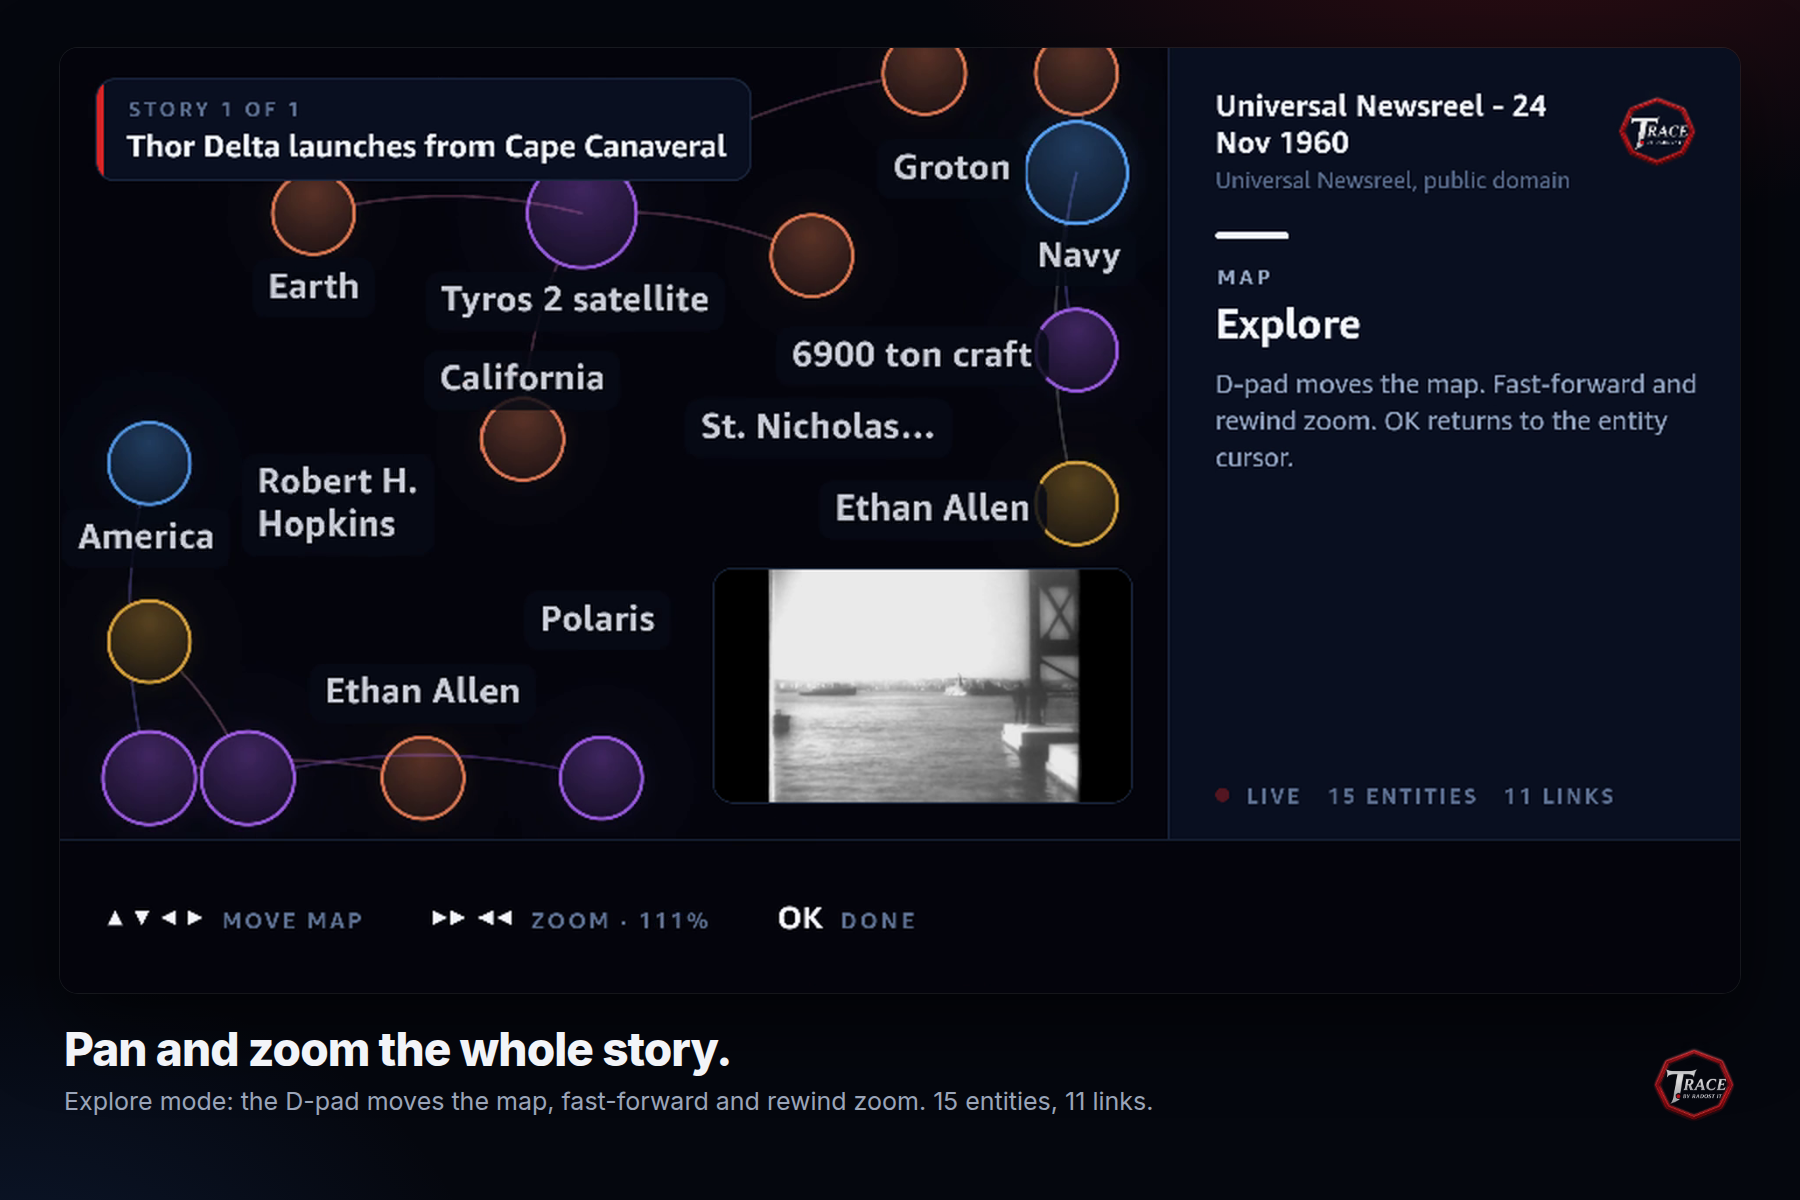
Explore mode: the D-pad pans the whole story map, and fast-forward and rewind zoom. 15 entities, 11 links.
Inspiration
On the news, someone gets named - a deputy minister, a company, a town you half know - and the anchor moves on as if you already knew who they were. You look it up on your phone, and by the time you look back the programme is on a different story. We wanted the TV itself to show who these people are and how they connect.
What it does
Trace is a Fire TV app, built with React Native for Vega on Vega OS, that plays a spoken-word broadcast and, as it plays, draws a graph of what is being talked about. Names become nodes as they are spoken. Links appear as the broadcast connects them. Bigger nodes are more central to the story, and colour shows what kind of thing each one is: person, organisation, place, event or object. You move around the graph with the D-pad and read a one-line summary of anyone on screen, without pausing.
When the programme moves to a new story, Trace starts a new graph with its own headline.
Nothing in the pipeline is specific to news. The built-in list holds public archive and NASA clips, and the same pipeline ran against a live news channel. You can also send Trace your own stream: the TV shows a six-character code, and you paste a stream URL on your phone.
Trace needs the media itself. Netflix, Prime Video and YouTube give out no media URL, so they are out of reach. Drama, sport and music are out by choice: drama would put fictional people in a graph that is described as real, and the other two are not mostly speech.
How we built it
A TypeScript monorepo. zod checks every boundary.
- services/ingest runs on AWS Lambda. Each call handles one 20-second window: ffmpeg turns the audio into 16 kHz mono PCM, and Amazon Transcribe Streaming turns it into text with speaker labels. Amazon Comprehend finds the obvious entities. Amazon Bedrock then links pronouns to names, finds the relations between entities, and writes a one-line summary for each, using forced tool use so the answer is always schema-valid JSON. graphology ranks the nodes and groups them. Snapshots are stored in DynamoDB.
- AWS Step Functions runs the windows one after another. It decides whether to extract, wait for more audio, or stop.
- apps/tv is React Native for Vega. d3-force lays out the graph on the
device and
@amazon-devices/react-native-svgdraws it. The app polls for a new snapshot every three seconds. - packages/shared holds the graph schema that every part agrees on. The
graph logic itself is the open-source package
@radost-it/trace-graph. - apps/web is a Next.js site with the phone pairing page.
Every model call goes through one LLMProvider interface, so we could develop
against a local Ollama model while Bedrock stays the default.
The whole pipeline first ran end to end in production on 2026-09-22 against a live CBS News stream and drew the story that was on air. The demo video was recorded against the deployed stack on 2026-10-06, with the stream sent to the TV from an iPhone.
Challenges we ran into
A Fire TV app cannot listen to the TV. Our first design analysed whatever was playing. That is not possible: Android's playback capture needs the other app to opt in and skips DRM content, and Vega has no capture API at all. So Trace became the player. The app plays a stream URL and the backend fetches the same URL in parallel. The graph runs about 25 seconds behind the audio: one window plus extraction.
This also set the limit of the product. Trace only works on streams that expose a URL: news channels, conference feeds, agency channels, plain HLS or MP4. The big subscription services expose nothing, so we no longer say it works on any broadcast.
No DOM, so no graph library. React Native for Vega runs on Hermes with no DOM, so every common graph renderer was out. d3-force is plain JavaScript, so it does the physics, and react-native-svg draws. SVG touch events do not fire on Vega either, so selection runs on D-pad keys.
The Vega SVG renderer does not erase what it drew. Moving text left its old letters behind, and any element removed from the SVG stayed on screen. Arrowheads piled up wherever the cursor had been, and a whole old graph stayed under the new one. Labels are now normal views above the SVG, nothing inside the SVG is ever removed, and the SVG is remounted when nodes go away.
The video player showed nothing and raised no error. Finding out why took
three days. The <Video> component ignores style and needs width and
height props, and it needs seven system services declared in the manifest.
Without them it fails with an error that blames the video file.
Too much for a TV screen. A graph that reads well on a laptop is unreadable from the sofa. We cap the number of visible nodes, let old ones fade, and drop anything a viewer cannot read: an entity with no links, or a link with no label.
A two-hour bulletin is not one graph. Run a whole news programme into one graph and the weather presenter ends up next to a foreign minister. Trace now notices when the programme moves on: when two windows in a row name entities the current graph has never seen, that is a new story, with its own graph and headline. An advert break, with no entities at all, does not count either way.
ffmpeg in a Lambda could not look up a hostname. It worked on a laptop and
drew nothing in production. The log said Failed to resolve hostname. The
static ffmpeg build cannot use the system's DNS lookup, while Node in the same
function can. Now Node downloads the media and ffmpeg reads the file.
Lambda stopped our call chain. Each Lambda call used to invoke the next one. Lambda's recursive loop detection stopped that chain after about five minutes of broadcast. Instead of switching the guard off, we moved the loop into Step Functions. While doing that we found a bug of ours: a window with no audio restarted at once, so a stalled stream could spin. Now no Lambda invokes another, stopping a session stops the execution, and waiting for audio costs nothing.
Bedrock's forced tool use sometimes returns prose. Bedrock's toolChoice
is meant to make the model call the tool. On a window with nothing in it, such
as an ad break, the model sometimes answers in prose instead. We treat that as
an empty window, so the session loses one window of graph and carries on.
Accomplishments that we're proud of
It worked on a live news channel. On 2026-09-22 a four-minute session on CBS News produced a graph of what was on air: Nolan Wells, Mississippi, the grand jury that returned no true bill, and the correspondent reporting from Atlanta, each with a one-line summary from what had just been said.
It split the broadcast into stories on its own. In the same run it started a second graph at 189 seconds and named both stories: Trump revokes press passes, then No charges in Nolan Wells death.
It costs about $0.88 per broadcast hour. That is AWS list price for the whole pipeline, and Transcribe is 68% of it. A channel is transcribed once for everyone watching it, so one more viewer costs almost nothing.
Model output is always checked. Every model call is forced tool use against a zod schema. An answer that does not match is rejected and never reaches the graph.
The graph core is a package anyone can use. @radost-it/trace-graph is
public, MIT, on npm, has 31 tests on Node's built-in runner, and depends only
on graphology and zod. The same code runs in a Lambda and on the TV.
What we learned
Find the platform limits before you design. The two that reshaped Trace - a Fire TV app cannot listen to the TV, and Vega has no DOM - were both knowable on day one.
Test the deployed stack, not only your laptop. ffmpeg with the same binary, arguments and URL worked locally and failed in Lambda because it had no DNS. We found it because we ran the real deployment four weeks before the deadline.
An async Lambda call chain hides errors. Ours failed every call for four minutes, and the only sign was a counter that stayed at zero.
What's next for Trace by Radost IT
Move the graph renderer into @radost-it/trace-graph, so anyone building on
Vega or plain React Native can draw a graph without a DOM. Then parliamentary
and conference coverage, where the cast is large and the relations are the
story.
We have worked out how to pay for it, but none of it is built. Because one more viewer of a channel costs almost nothing, there are three plans:
- Free: the built-in channels, the live graph and three saved graphs.
- Plus, $4.99 a month: unlimited saved graphs, export, and 150 web-grounded lookups a month for "tell me more" about an entity.
- Pro, $12.99 a month: everything in Plus, 500 lookups, and 5 hours a month of your own private streams, which cannot be shared and so are paid per hour.
On the TV, payments would go through Amazon In-App Purchasing.
Built With
- amazon-bedrock
- amazon-comprehend
- amazon-transcribe
- aws-cdk
- aws-lambda
- aws-step-functions
- d3-force
- dynamodb
- ffmpeg
- fire-tv
- graphology
- hermes
- hls
- louvain
- next.js
- node.js
- ollama
- react-native
- react-native-svg
- typescript
- vega-os
- zod

Log in or sign up for Devpost to join the conversation.