-
-
Real-Time Driver Coach: Live simulation with corner-by-corner insights.
-

Pre-Event Prediction: ML model forecasting 2026 race pace.
-
Post-Event Analysis: Automated narrative report generation.

Inspiration
Modern motorsport is drowning in data. Teams collect gigabytes of telemetry every session, but raw data doesn't win races—insights do. We noticed a gap in the current tooling: engineers often have to switch between different disjointed tools for strategy, live timing, and post-race debriefs.
We wanted to build a single, unified "Command Center" that supports the entire lifecycle of a race event. Our inspiration came from the desire to democratize professional race engineering—taking complex signals like G-force and throttle position and turning them into plain English advice like "Brake later in Turn 1."
What it does
The Toyota GR Racing Suite is a 3-in-1 analytics platform designed to Engineer Victory:
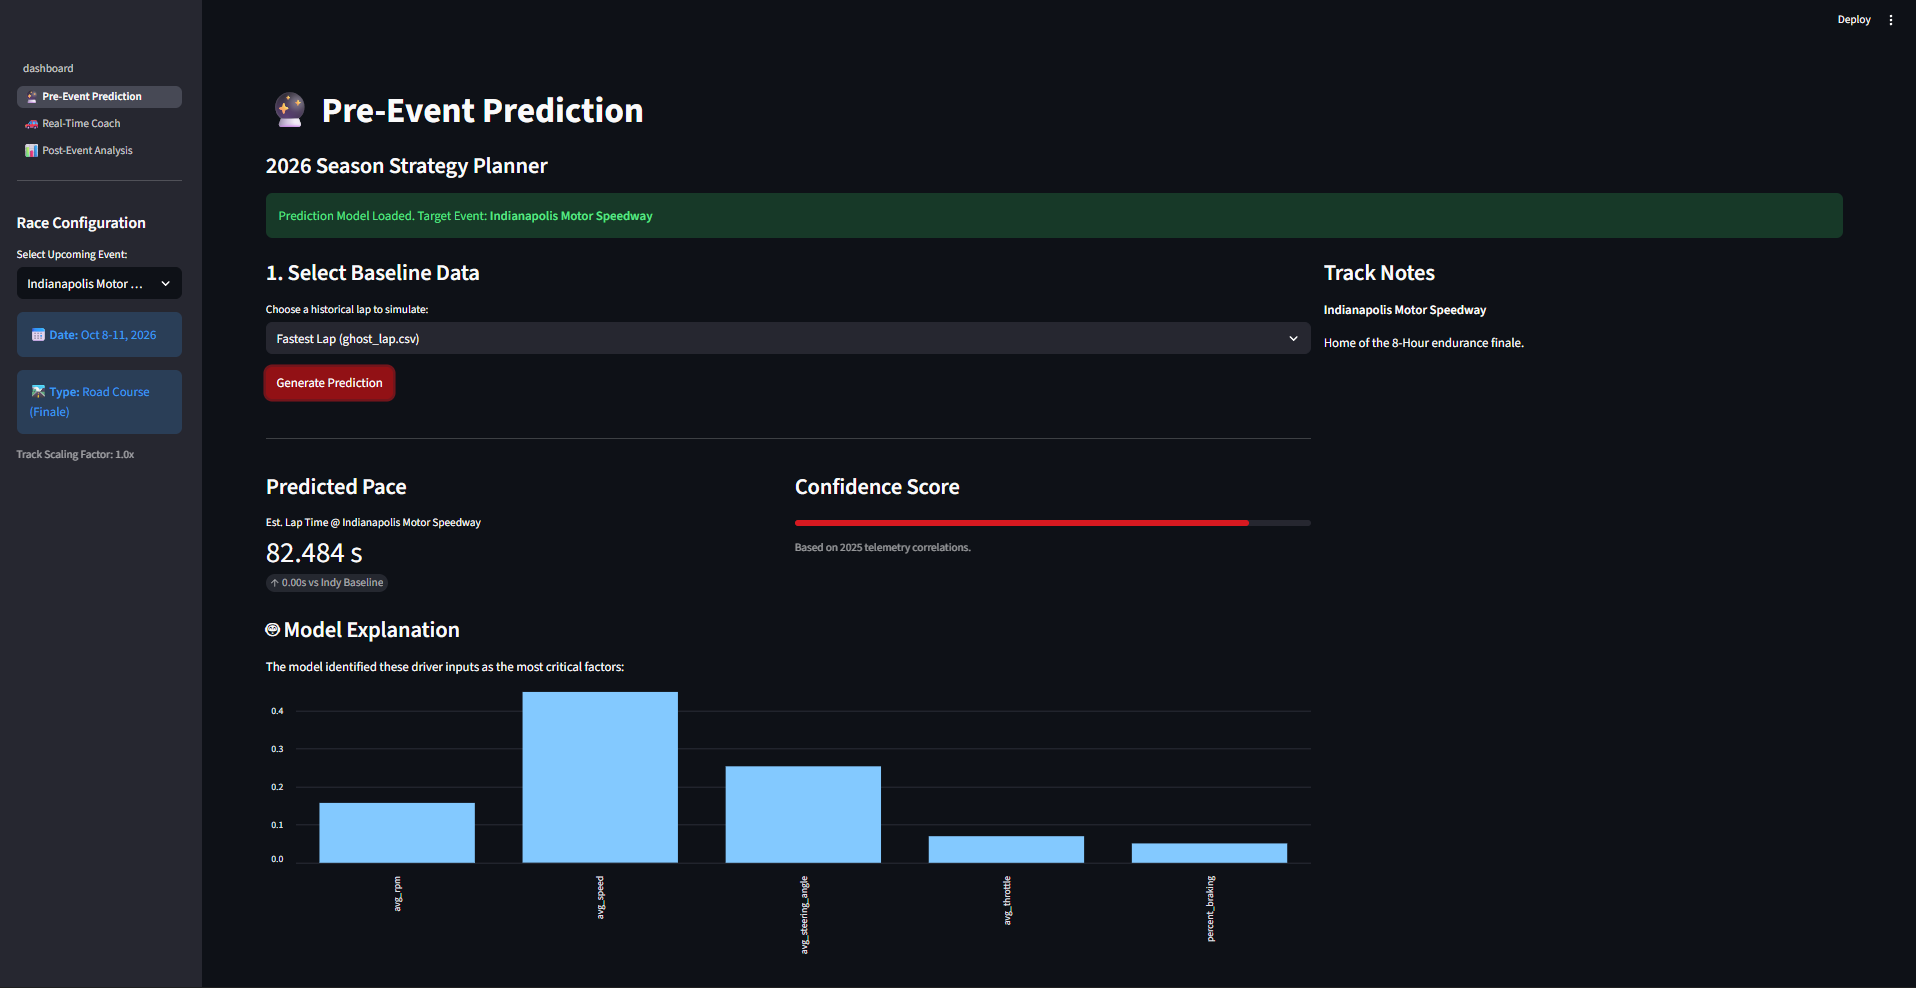
1. 🔮 Pre-Event Prediction
Before the race starts, we use a Machine Learning model (Random Forest) trained on historical data to forecast a driver's potential race pace. Crucially, it explains why it made that prediction using a Feature Importance chart.
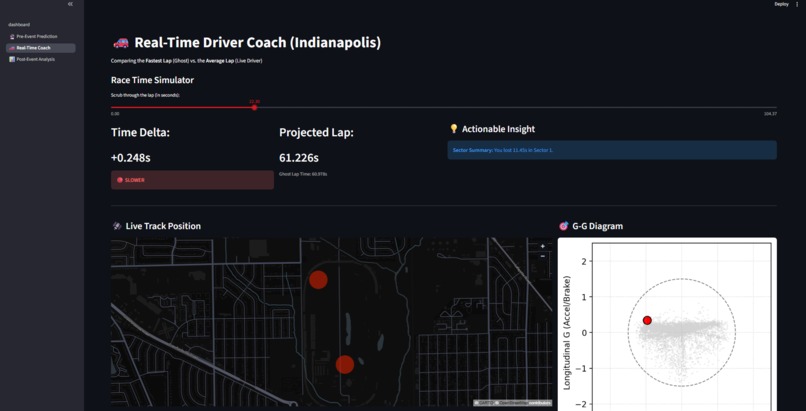
2. 🚗 Real-Time Driver Coach
During the race, this dashboard acts as a digital race engineer. It compares a live driver against a "Ghost" (fastest) lap in real-time. It features:
- Live GPS Map: Visualization of car positions on the Indianapolis Motor Speedway.
- Corner-by-Corner Analysis: It calculates time deltas for specific track sectors.
- Actionable Insights: A smart notification system that gives instant feedback (e.g., "Losing 0.3s in Sector 2: Ghost is full throttle, you are lifting").
- G-G Friction Circle: A professional-grade visualization of tire usage and grip limits.
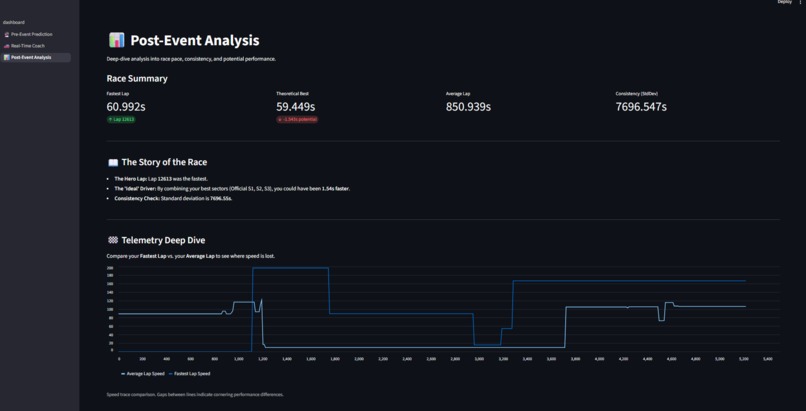
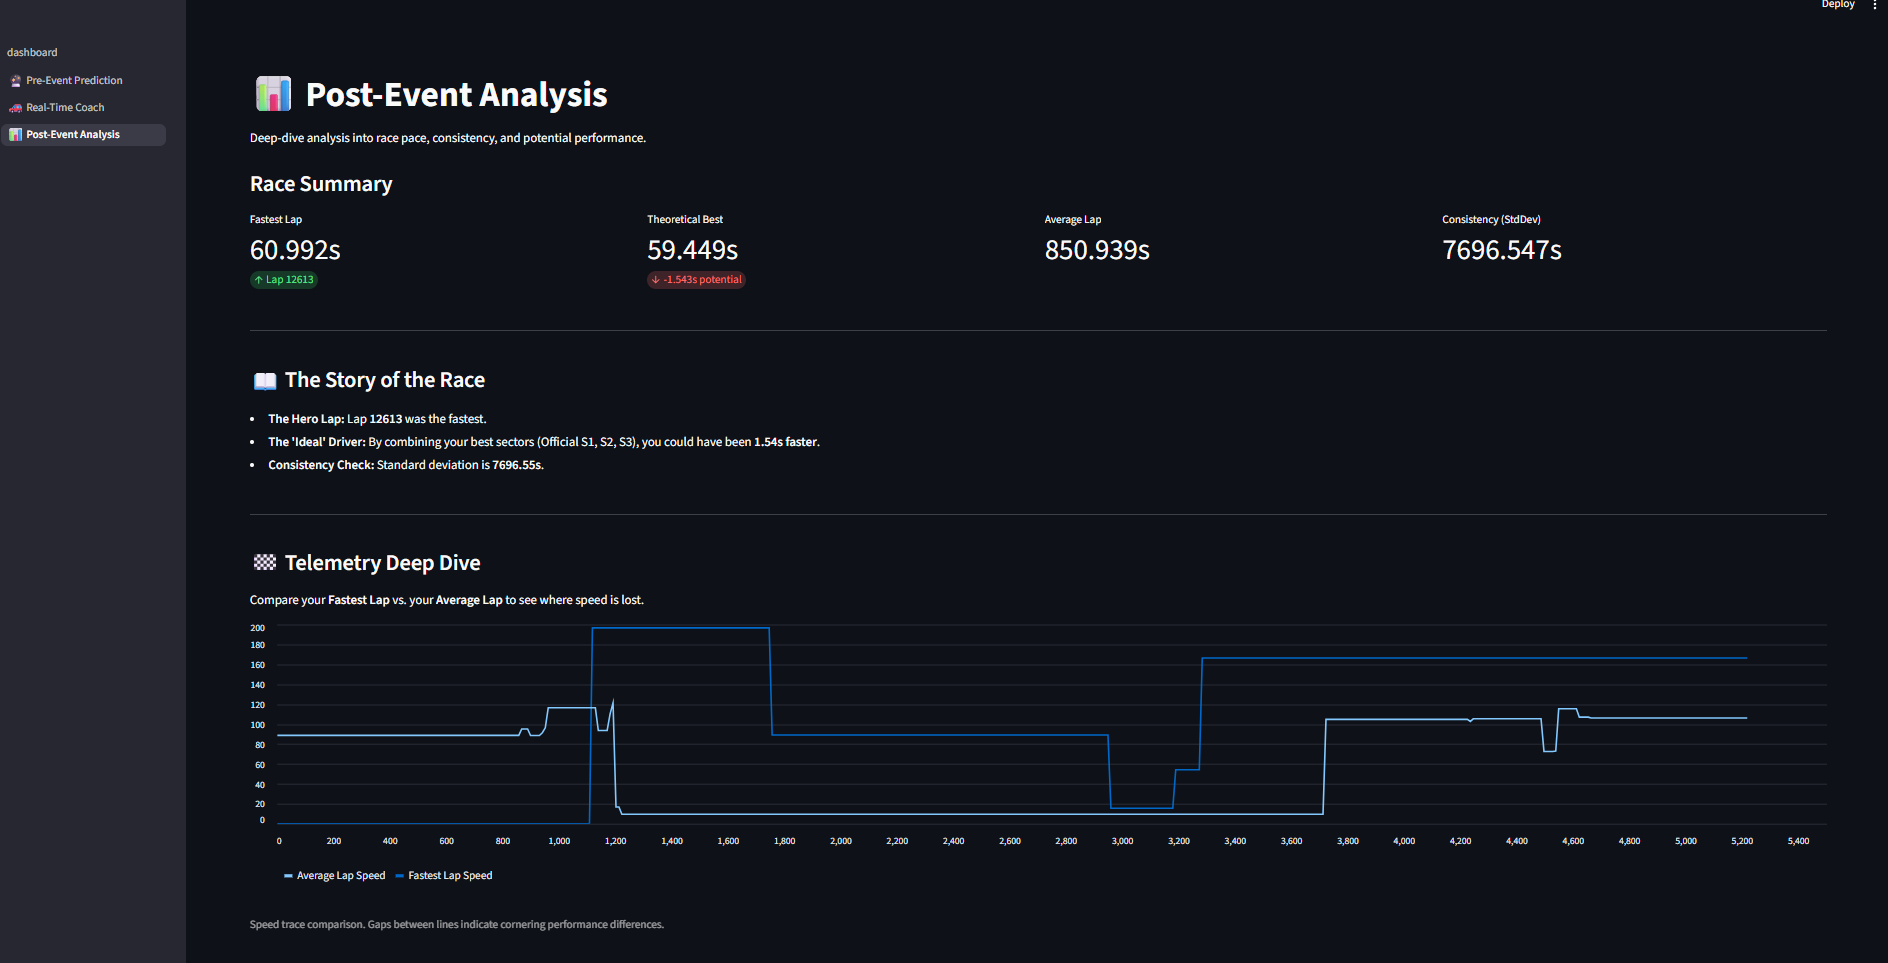
3. 📊 Post-Event Analysis
After the flag drops, the app generates a narrative "Race Story." It identifies the Hero Lap, the Problem Lap, and calculates the "Theoretical Best Lap" by combining the driver's best sectors to show their true potential.
How we built it
We built the suite using Python as our core engine, leveraging the power of the open-source data science stack:
- Streamlit: For the high-performance, interactive web dashboard.
- Pandas & NumPy: For heavy data manipulation. We had to pivot millions of rows of "long-format" telemetry data into usable time-series dataframes.
- Scikit-learn: We trained a
RandomForestRegressorto predict lap times based on inputs like throttle aggression, braking pressure, and cornering speeds. - Matplotlib: Used to render the complex G-G Friction Circle diagram.
- Data Integration: We integrated official Al Kamel Systems track maps to define engineering-grade timing sectors (converting inches to meters) for the Indianapolis Motor Speedway.
The Math Behind the Magic
We didn't just plot points; we used math to derive insights.
Calculating the Live Delta To give real-time feedback, we calculate the time difference (delta) at every timestamp \( t \) between the live driver and the ghost:
$$ \Delta t = T_{live}(d) - T_{ghost}(d) $$
Where \( d \) represents the distance traveled on the track.
The Theoretical Best Lap For the post-race analysis, we calculate the potential optimal lap time by summing the minimum times achieved in each individual sector \( S \) across all laps \( i \):
$$ T_{theoretical} = \sum_{k=1}^{3} \min(S_{k, i}) $$
This allows us to show the driver exactly how much time they "left on the table."
Friction Circle Analysis To visualize the grip limit on our G-G Diagram, we analyze the combined G-forces:
$$ G_{lat}^2 + G_{long}^2 \le G_{max}^2 $$
Challenges we ran into
- Data Synchronization: Comparing two cars (Live vs. Ghost) is difficult because they are at different places at different times. We had to build a robust resampling engine to align both telemetry streams to a common time index so we could calculate accurate deltas.
- Sparse Data: The raw telemetry data had gaps and different sampling rates for GPS vs. Engine sensors. We implemented forward-filling and interpolation techniques to create smooth, continuous data for the ML model.
- Defining Sectors: Without a predefined track map API, we had to reverse-engineer the track sectors. We analyzed the lap distance data and cross-referenced it with official track documents to program accurate sector "bins" for our analysis.
Accomplishments that we're proud of
- The "Actionable Insight" Engine: We moved beyond simple charts. Our app literally speaks to the driver, translating complex delta times into specific driving advice.
- The G-G Diagram: Implementing a real-time Friction Circle is a feature usually reserved for expensive, pro-level software. Seeing the "grip dot" move live in a web browser was a huge win.
- Theoretical Best Calculation: We successfully implemented logic to slice every lap into sectors, find the best ones, and recombine them to show the driver their "perfect lap" potential.
What we learned
We gained a deep appreciation for the complexity of race strategy. We learned that "fastest" doesn't always mean "best"—consistency is key. Technically, we mastered advanced Pandas pivoting techniques, time-series resampling, and how to deploy Machine Learning models within a real-time interactive application.
What's next for Toyota GR Racing Suite
- Multi-Track Support: We built the architecture to handle the 2026 schedule (like the new Arlington GP). Scaling this to load dynamic track maps is the next step.
- Live Telemetry Ingestion: Currently, we simulate a live stream from CSVs. The next version will connect to a WebSocket API to ingest real-time data from the car's ECU.
- Tire Degradation Modeling: We want to upgrade our ML model to predict not just lap time, but tire life, helping engineers make the perfect pit stop call.


Log in or sign up for Devpost to join the conversation.