

Inspiration
We were inspired by the thrill of motorsports and the growing availability of race data. The goal was to create an interactive platform that allows teams, drivers, and fans to quickly visualize performance metrics, track trends, and gain actionable insights from race results.
What it does
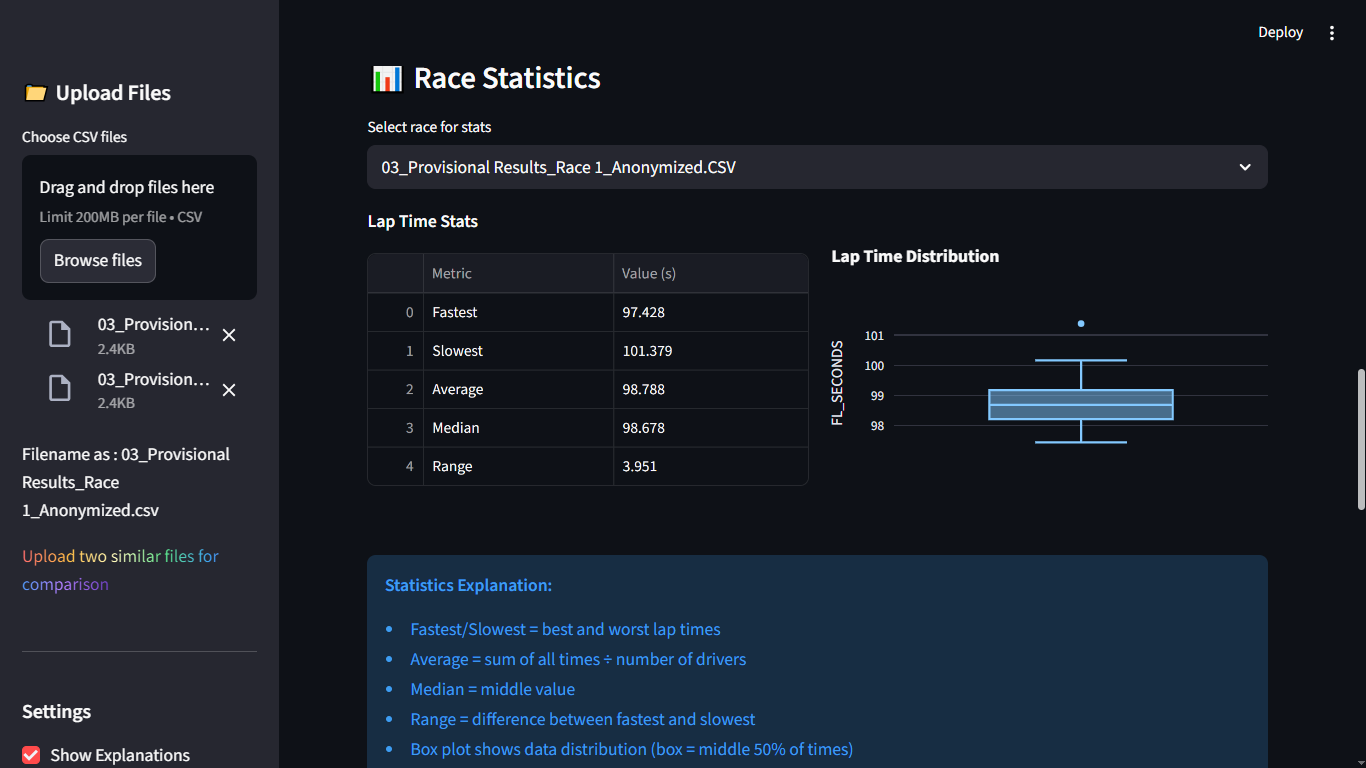
The Toyota GR Cup Analysis dashboard lets users:
- Upload multiple race CSV files and automatically clean and process the data.
- Visualize winners, podiums, lap times, gaps, and driver trends.
- Compare multiple drivers across races with interactive charts.
- Generate downloadable summary reports and combined CSV datasets.
- Provide clear explanations for every chart and metric.
How we built it
We built the project using:
- Streamlit for the interactive UI.
- Pandas & NumPy for data cleaning, transformation, and calculations.
- Plotly Express & Graph Objects for dynamic visualizations.
- CSS styling for a clean, Toyota-themed dashboard look.
The app automatically detects CSV formats, converts lap times to seconds, and prepares data for visual analytics.
Challenges we ran into
- Handling different CSV formats and separators (
;or,). - Converting various lap time formats into consistent numerical values.
- Ensuring charts and tables remained clear and readable for a wide range of race data.
- Maintaining responsive layouts for different screen sizes in Streamlit.
Accomplishments that we're proud of
- Built a fully interactive, multi-tab dashboard for analyzing races and drivers.
- Implemented automatic data cleaning, lap time conversion, and gap calculations.
- Created a polished UI with Toyota GR branding and explanatory tooltips for every chart.
- Enabled export of summary reports and combined race data for further analysis.
What we learned
- How to integrate Streamlit and Plotly for dynamic, interactive dashboards.
- Best practices for cleaning and preparing racing datasets.
- Techniques to convert time-based metrics into usable numerical data for analysis.
- How to present complex performance insights in a simple, user-friendly interface.
What's next for Toyota GR Cup Analysis
- Add predictive analytics to forecast race outcomes based on historical performance.
- Integrate live timing data for real-time dashboards during races.
- Include more advanced statistics, such as sector analysis or tire performance.
- Expand to support other racing series and multi-class competitions.

Log in or sign up for Devpost to join the conversation.