-
-

The moment I realised I was going to be the proud father to a Racing Simulator!!
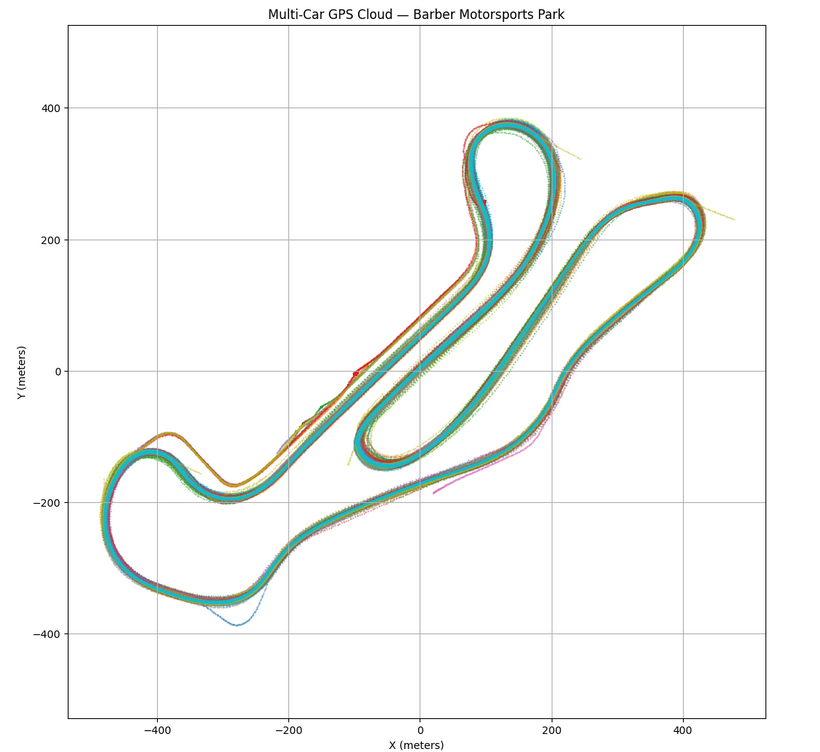
Inspirat# 🚗 GR Cup Telemetry Explorer
A GPU-accelerated motorsport analytics & visualisation suite built from raw Toyota GR Cup datasets.
What Inspired the Project
I’ve always been drawn to motorsport because it blends engineering, data, and decision-making under pressure. The moment I saw the GR Cup telemetry datasets, I realised they were a perfect real-world testbed for high-precision data engineering, simulation, and UI design.
My goal became simple:
turn raw telemetry into insight — not just charts.
I wanted to build something that could help a driver “see” their performance:
braking, acceleration, racing line deviation, steering behaviour, and sector-level differences — all rendered visually and intuitively.
That spark grew into a complete desktop simulation and analysis tool.
What I Learned
This project pushed me deep into motorsport data, spatial reasoning, and performance engineering. A few highlights:
Data behaves nothing like theory.
GPS noise, timestamp drift, missing channels, and inconsistent sampling rates all required defensive preprocessing, smoothing, and interpolation. The mathematics behind the corrections relied on:
[ v_{t} = \frac{\Delta x}{\Delta t}, \quad a_{t} = \frac{v_{t} - v_{t-1}}{\Delta t} ]
[ \text{lateral_dev} = \lVert p_{\text{car}} - p_{\text{racingline}} \rVert ]
Learning to stabilise and validate telemetry was a project in its own right.
UI/UX matters as much as math.
Turning numbers into movement required careful visual design:
animated deviation bars, coloured braking arcs, acceleration fans, HUD overlays, trails, and dynamic colour/size customisation.
GPU rendering beats browser rendering.
Moving from web-based rendering to a desktop GPU pipeline gave me smooth playback at 60 FPS even with ~30 cars and multiple overlay layers.
How I Built It
The app is structured around three major components:
1. Data Engineering Pipeline
Built using Python + NumPy + notebook verification:
- Parsing raw CSV telemetry
- Timestamp alignment
- GPS smoothing + direction vector reconstruction
- Racing line generation via density mapping & spline fitting
- Sector calculation
- Deviation metrics
- Car-specific metadata
- Export to simulation format (NumPy + JSON)
This let me convert raw data into clean, consistent physical behaviour.
2. Real-Time Desktop Simulation Engine
Running on the GPU with DearPyGUI + custom rendering shaders:
- Positions updated every frame from corrected GPS
- Orientation calculated via velocity vectors
- Racing line + density-based track outline
- Five unique visualisation layers:
- Lateral deviation bars
- Braking arcs (front & rear)
- Acceleration fans
- Steering angle arrows
- Motion trails (with acceleration colour gradients)
- Lateral deviation bars
The simulation processes the race in real time from raw telemetry.
3. Driver-Focused Customisation Suite
To make it genuinely useful for analysis, I added:
- Full colour customisation per visual layer
- Sliders for sizes (bars, arcs, trails, fonts, line widths)
- Multi-car HUD panels
- Car selection via dropdown or clicking the track
- Drag-and-drop CSV loading
- Auto pipeline: file → preprocess → simulate
- Smooth animated transitions in the UI
This turned the simulation into a fully configurable analytics tool.
Challenges I Faced
1. A wrong turn on lap-distance simulation
I initially spent two weeks building a simulation based on lap distance rather than GPS. It failed due to cumulative precision issues and slight inconsistencies between cars.
Switching to a GPS-based spatial simulation unlocked everything.
2. Thread-safety nightmares
DearPyGUI doesn’t allow UI updates from background threads.
I had to refactor the data pipeline to avoid random freezes and implement safe main-thread callbacks.
3. Inconsistent telemetry across cars
Some telemetry rows had missing fields or corrupted GPS points.
I built outlier removal, interpolation, and metadata guards to stabilise the pipeline.
4. Time pressure
Building a full simulation engine, data processor, visualisation suite, and UX polish within a week required constant tactical decisions, feature triage, and long debugging sessions.
Languages & Technologies Used
- Python (core logic, preprocessing, simulation control)
- NumPy / Pandas (data engineering & math)
- DearPyGUI (GPU-accelerated UI + rendering)
- Advanced Maths & Vector Calculations (trajectory, deviation, acceleration)
- JSON, CSV, custom binary formats
- Jupyter Notebooks (validation, exploration)
- OpenGL-style rendering pipelines via DearPyGUI internal GPU APIs
Final Thoughts
This project exceeded my original expectations.
It became a proper racing-insight platform — something that helps drivers see their data, not just read it.
Whether or not it wins, it stands as one of the most complex and rewarding builds I’ve ever completed, and the foundation for a much larger suite of driver-analysis tools.
ion
What it does
How we built it
Challenges we ran into
Accomplishments that we're proud of
What we learned
What's next for Toyota Gazoo Racing Project
Built With
- c++
- claude
- dearpygui
- javascript
- jupyter
- python

Log in or sign up for Devpost to join the conversation.