-
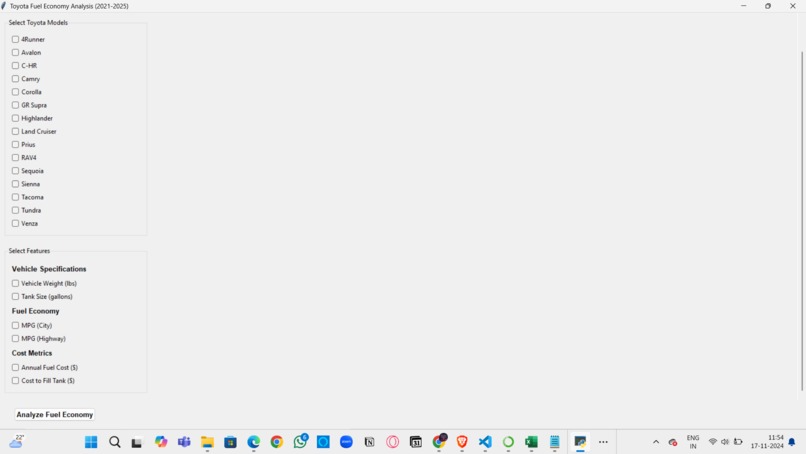
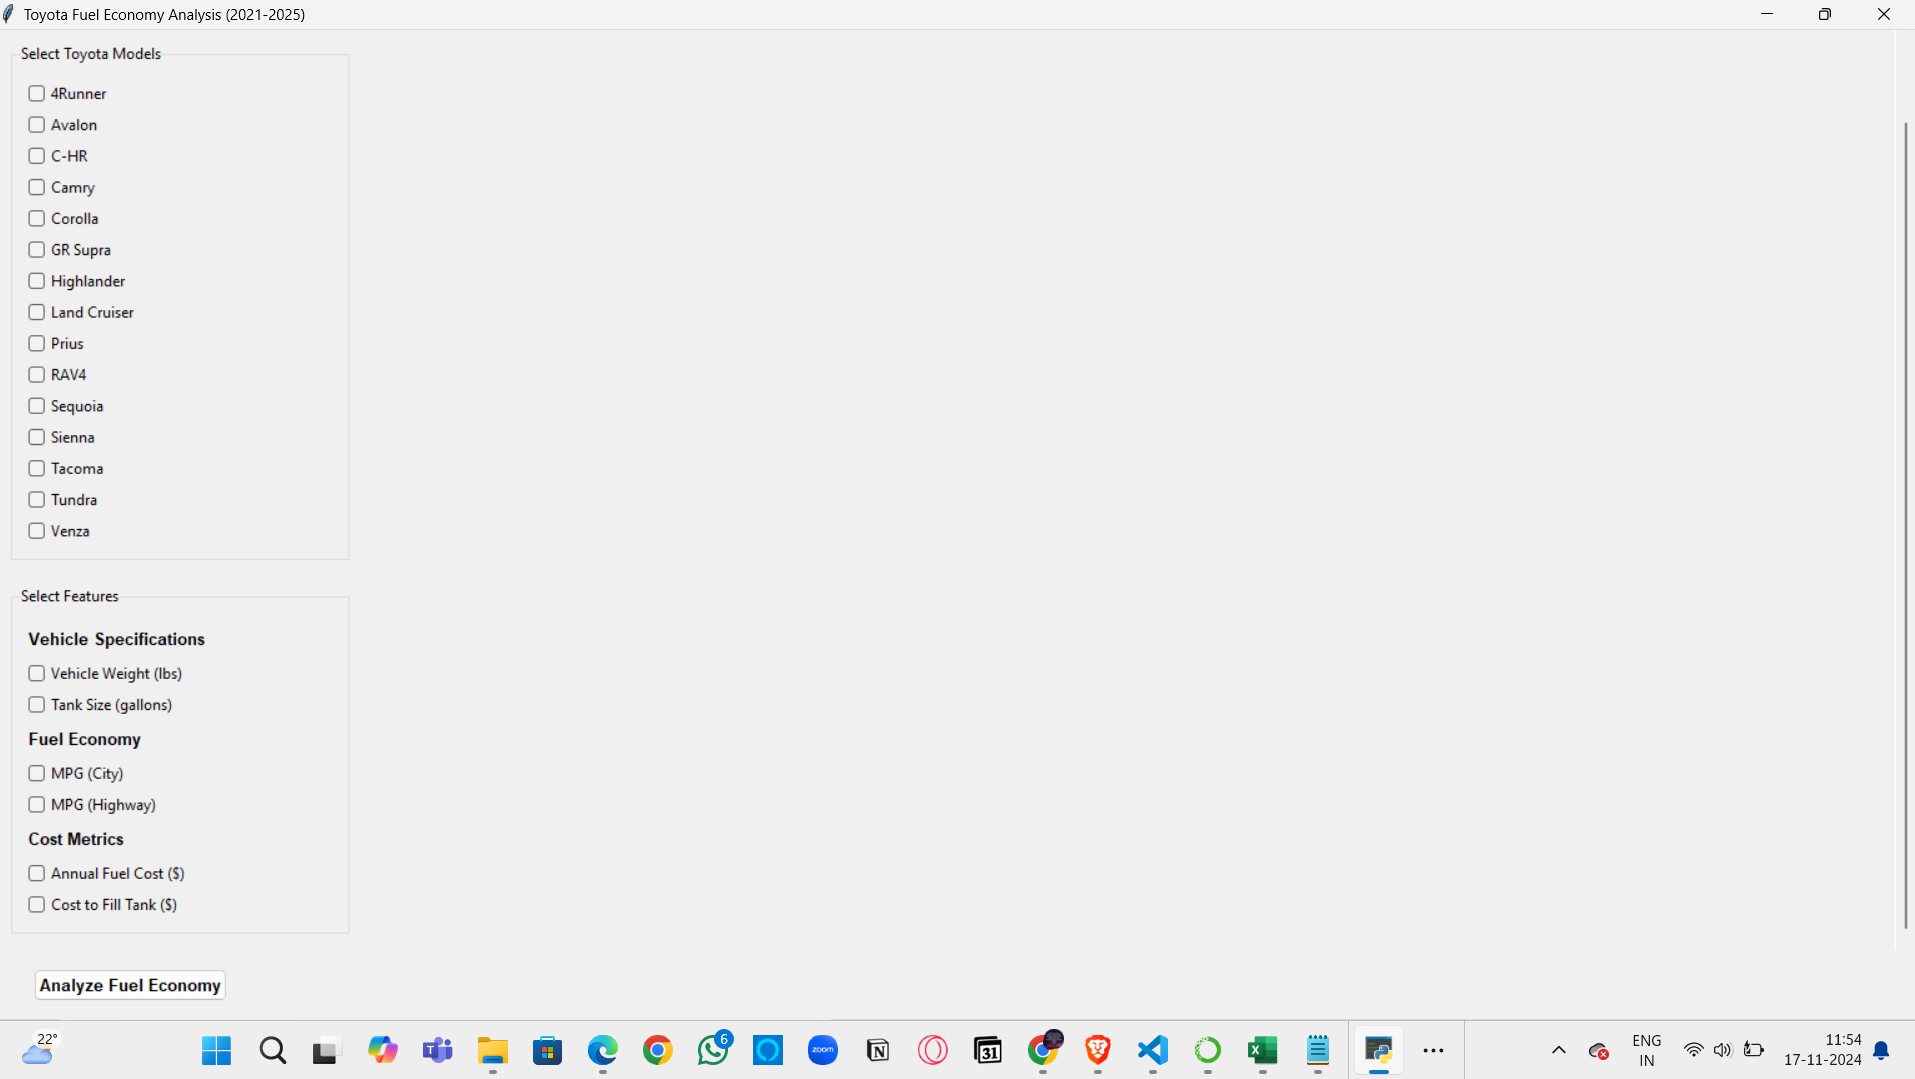
the output page when we run the code
-
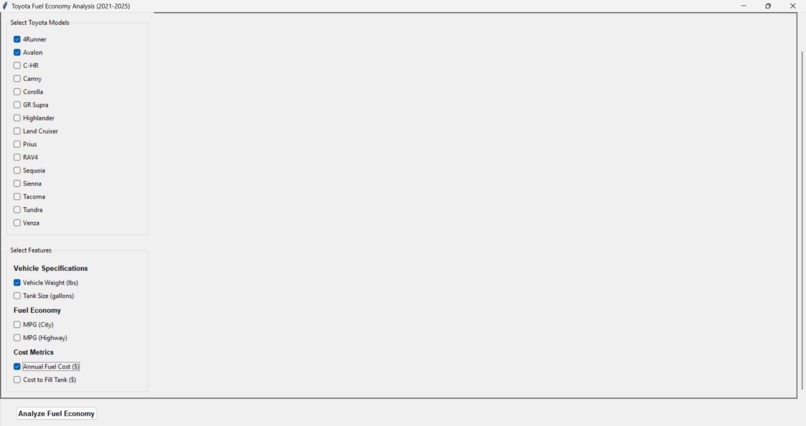
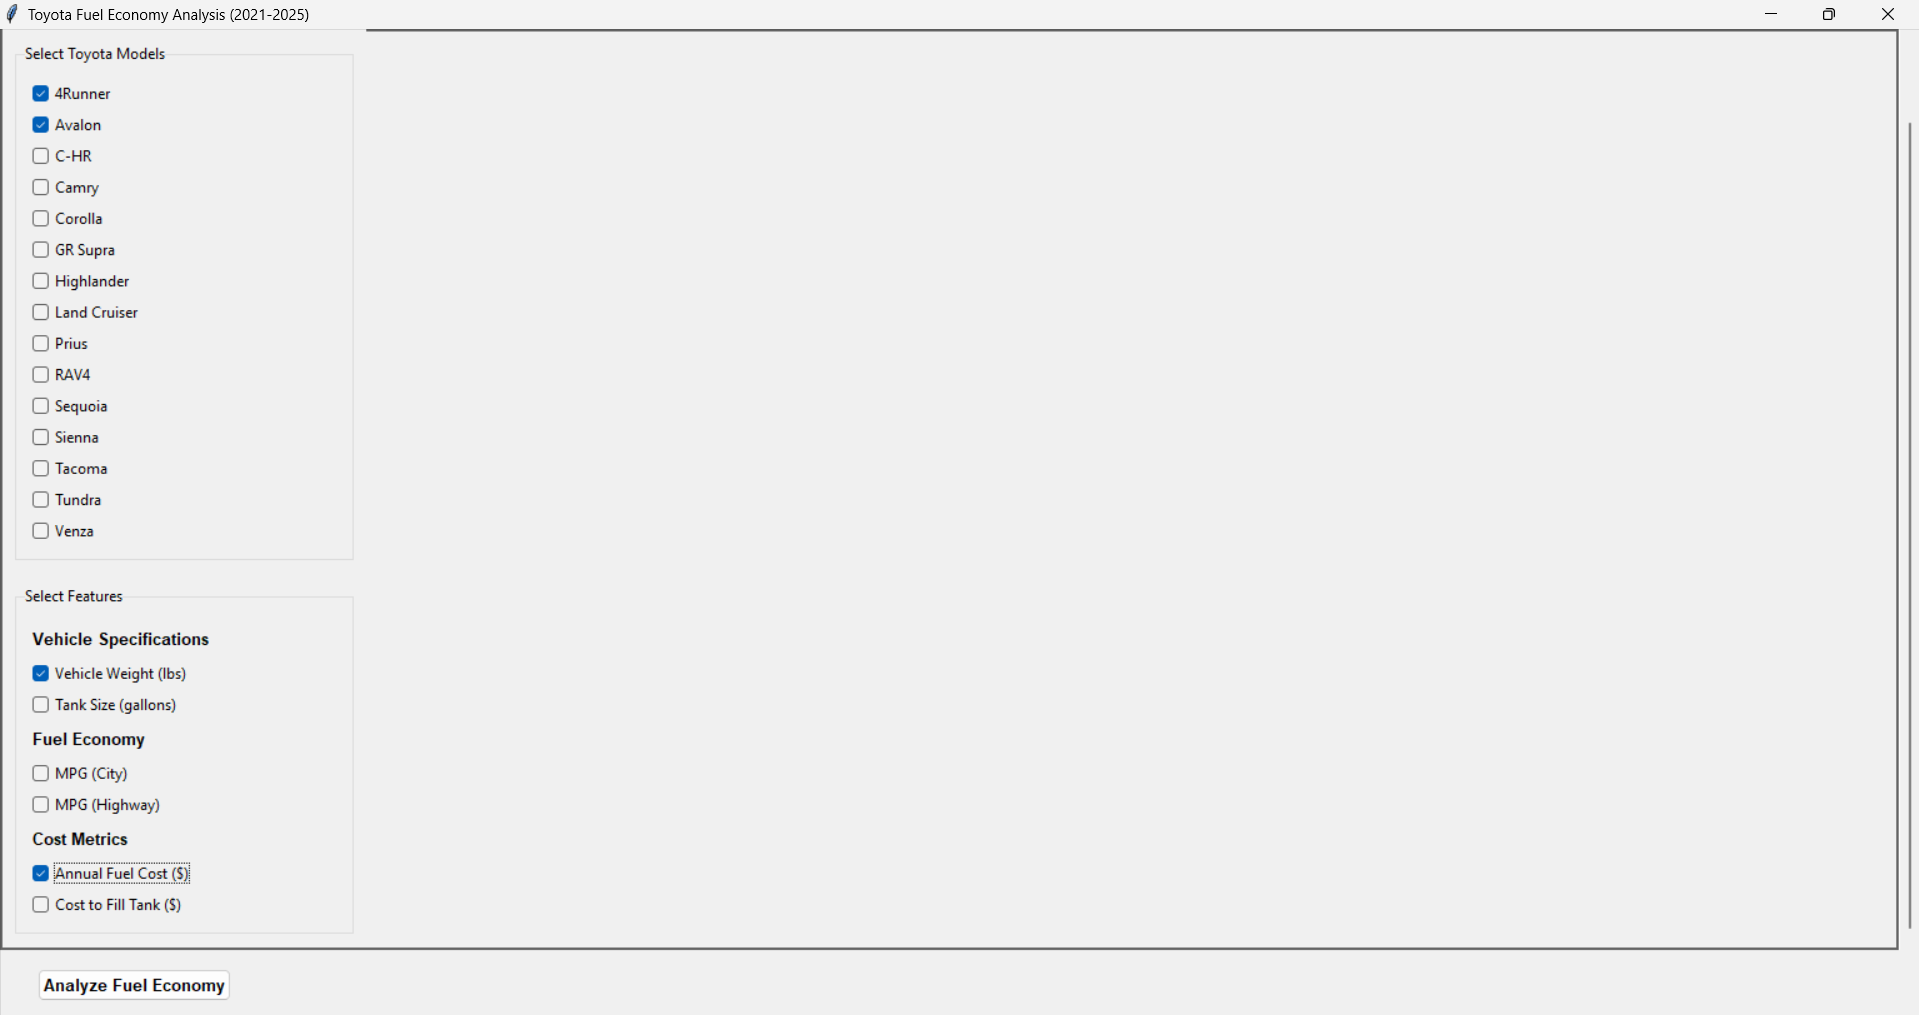
then we choose the options
-
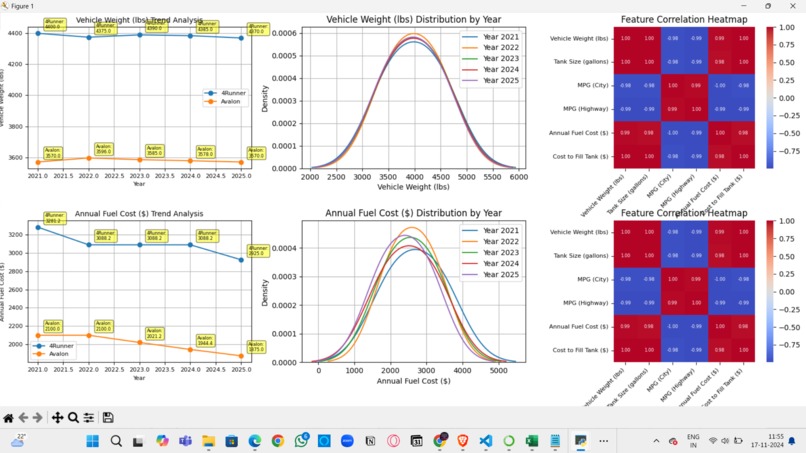
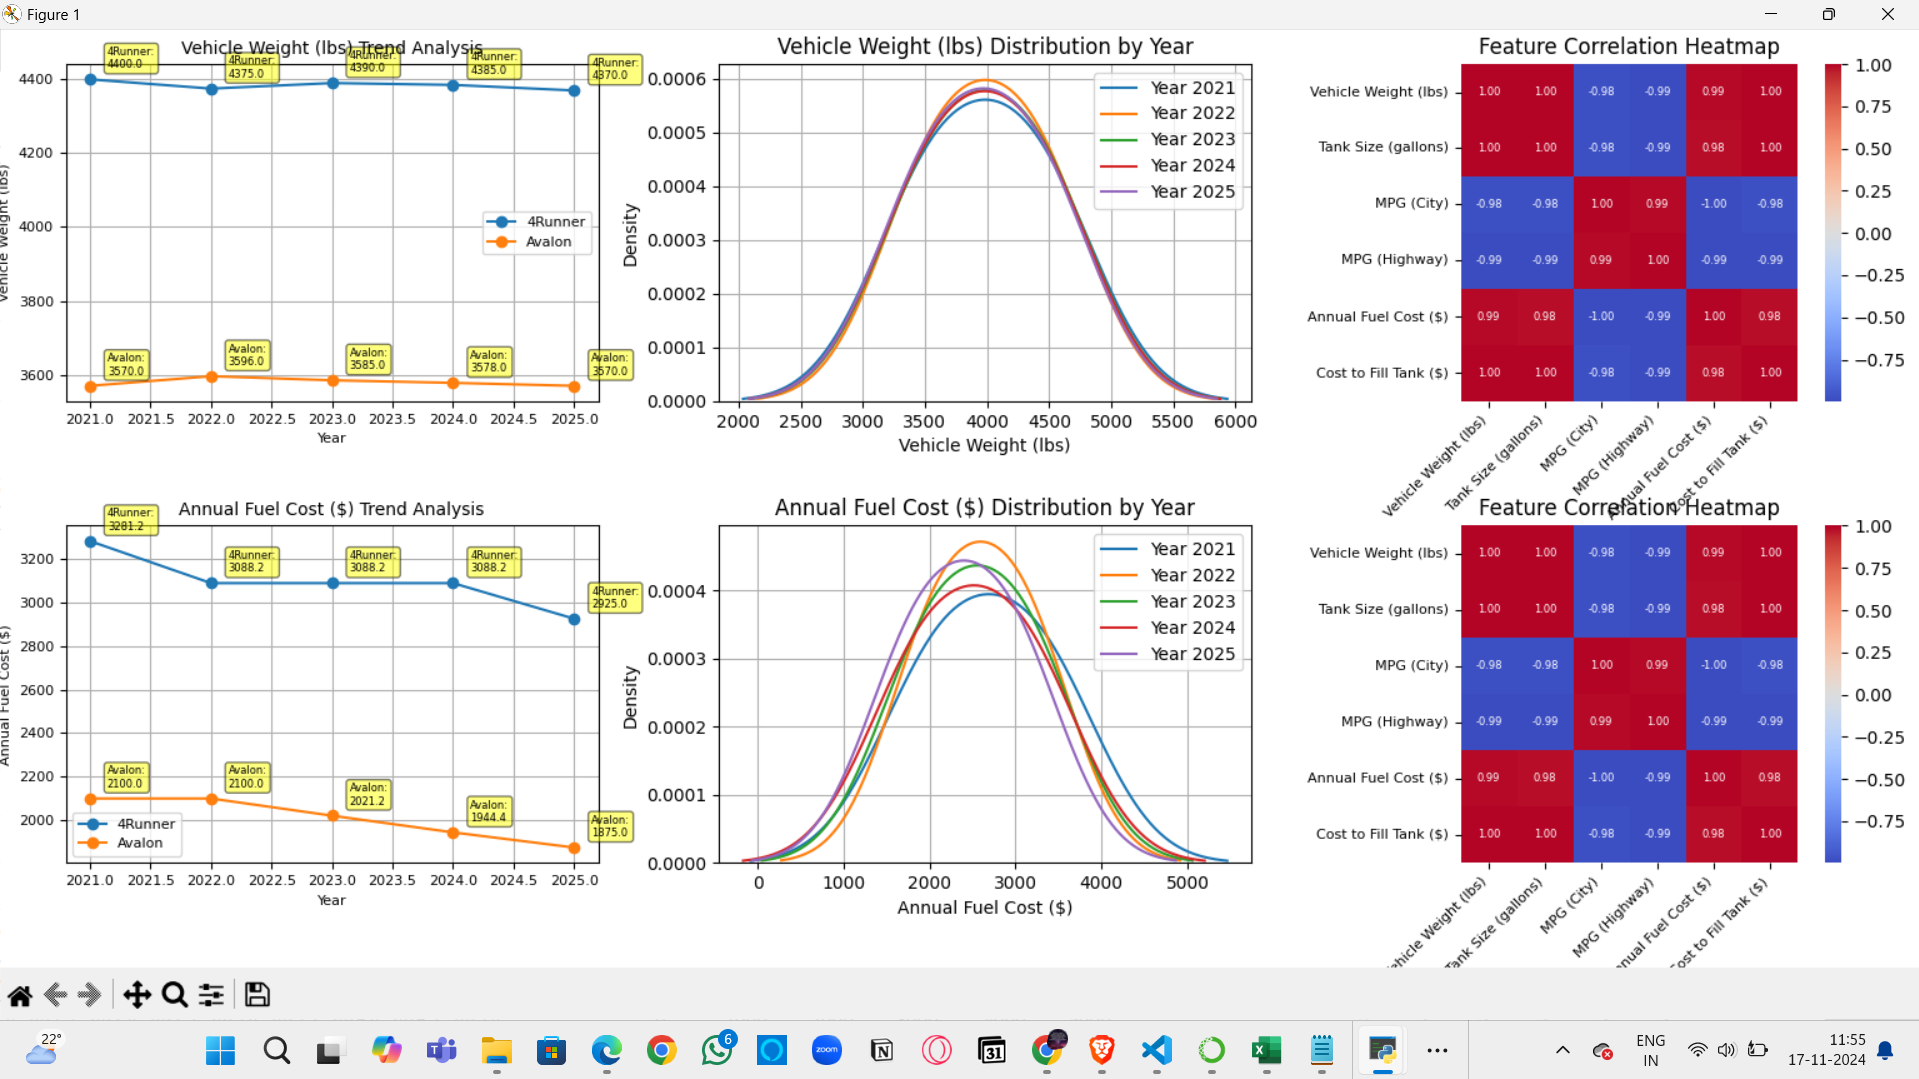
diffrent types of visual statistics are shown with which we can analyze
-
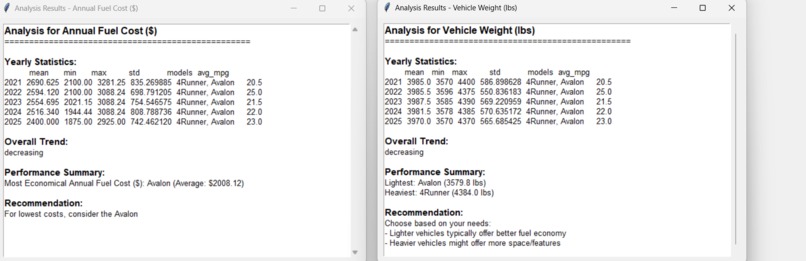
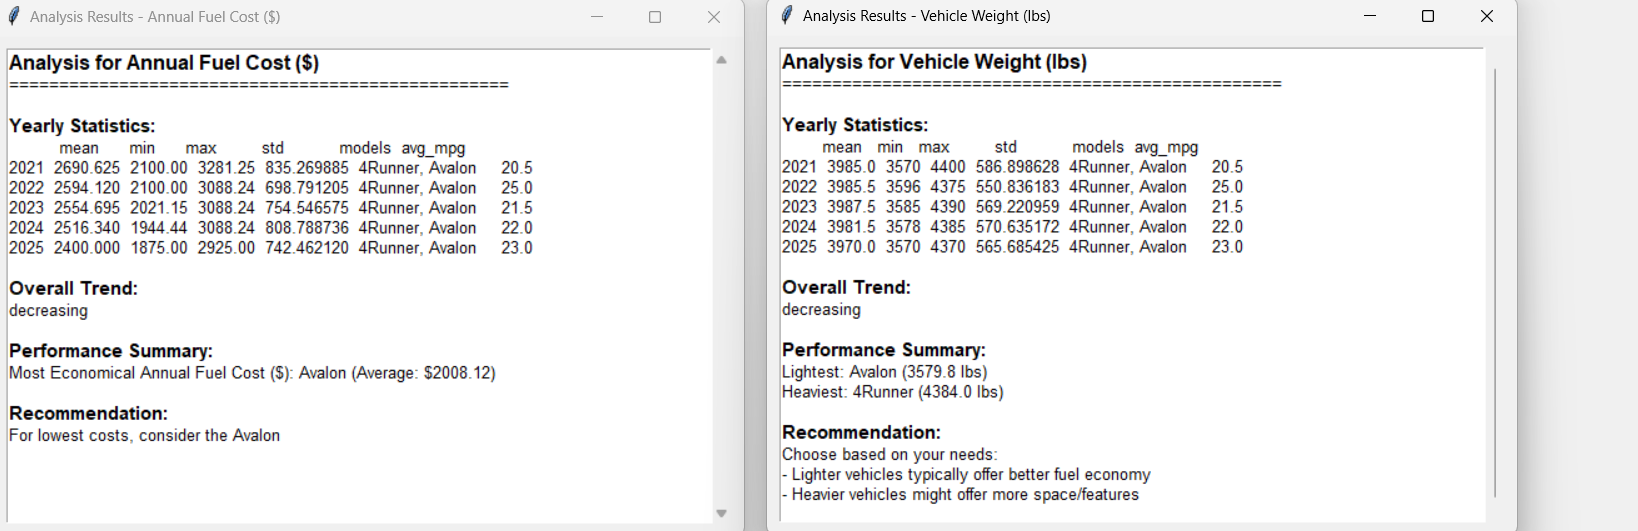
recommendation window open after closing visualization window, explaining why you should select this car based on the features selected.
-
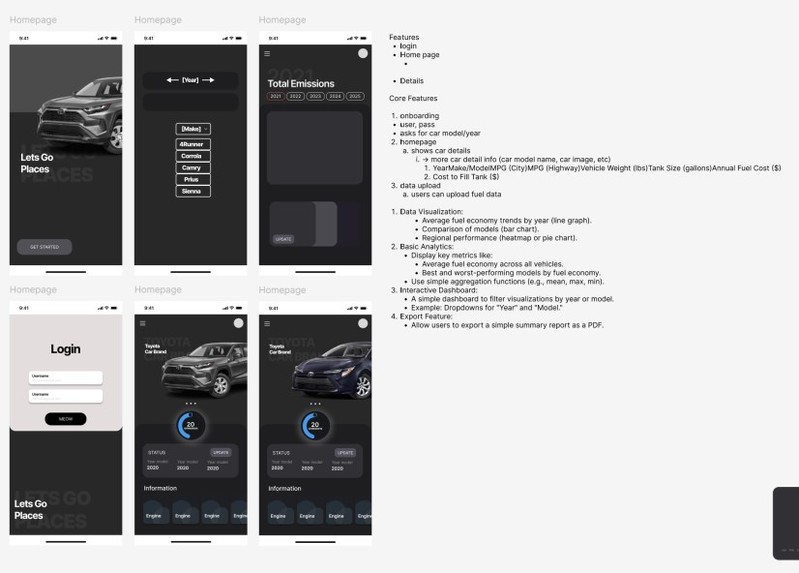
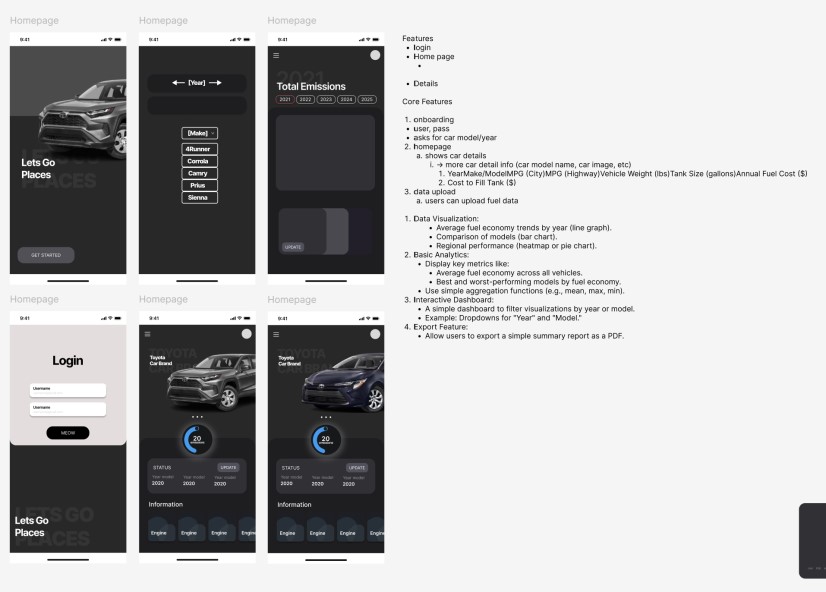
prototype of frontend made using figma
We were inspired by the increasing focus on fuel efficiency and environmental impact. We wanted to create a tool that would help Toyota analyze historical data, identify trends, and predict future fuel economy trends. This tool could assist in making informed decisions about vehicle design, manufacturing, and marketing strategies.
Our Toyota Fuel Economy Analyzer is a Python-based application with a user-friendly GUI. It allows users to:
- Load and visualize historical Toyota vehicle data.
- Select specific models and features for analysis.
- Analyze trends in fuel economy metrics over time.
- Predict future trends using linear regression models.
We leveraged the power of Python libraries like pandas, NumPy, Matplotlib, Seaborn, and Tkinter to build this application.
Data Acquisition and Cleaning: We sourced historical Toyota vehicle data and cleaned it to remove inconsistencies and missing values . Data Analysis and Visualization: We used pandas for data manipulation and statistical analysis. Matplotlib and Seaborn were used to create informative visualizations. Machine Learning: We employed linear regression to predict future trends in fuel economy based on historical data. User Interface: We utilized Tkinter to create an intuitive GUI that allows users to select features and models for analysis.
Data Quality: getting the data and Ensuring data consistency and handling missing values was a significant challenge. Feature Engineering: Creating meaningful features that capture the underlying trends in fuel economy required careful consideration.. GUI Development: Designing a user-friendly GUI that effectively presents the analysis results was a complex task.
Comprehensive Analysis: The tool provides a comprehensive analysis of historical fuel economy data. User-Friendly Interface :The GUI allows users to easily interact with the tool and explore different features.
Visualizations:The visualizations are clear, informative, and help users understand the data easily.
We plan to further enhance the tool by:
Expanding Feature Set: Incorporate additional features like engine specifications, transmission type, and driving conditions. Advanced Machine Learning Models: Experiment with more sophisticated machine learning models (e.g., Random Forest, XGBoost) for improved prediction accuracy. Interactive Visualizations: Implement interactive visualizations to allow users to explore data dynamically. Web-Based Application: Develop a web-based version of the tool for wider accessibility. Collaboration with Toyota Engineers: Work closely with Toyota engineers to incorporate domain-specific knowledge and refine the analysis. By continuously improving the tool, we aim to provide valuable insights to Toyota and contribute to the development of more fuel-efficient vehicles.
Built With
- gui
- machine-learning
- python
- tcl
- tk

Log in or sign up for Devpost to join the conversation.