-
-
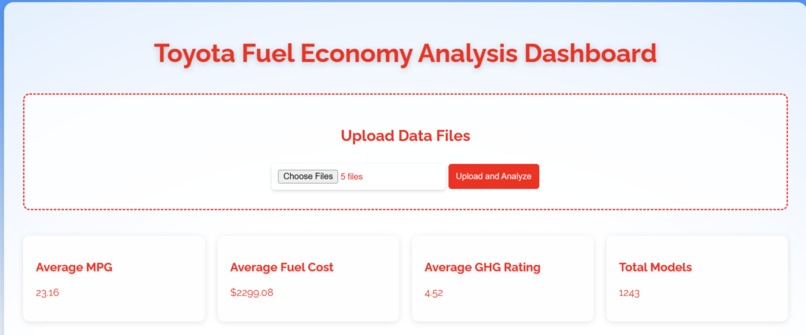
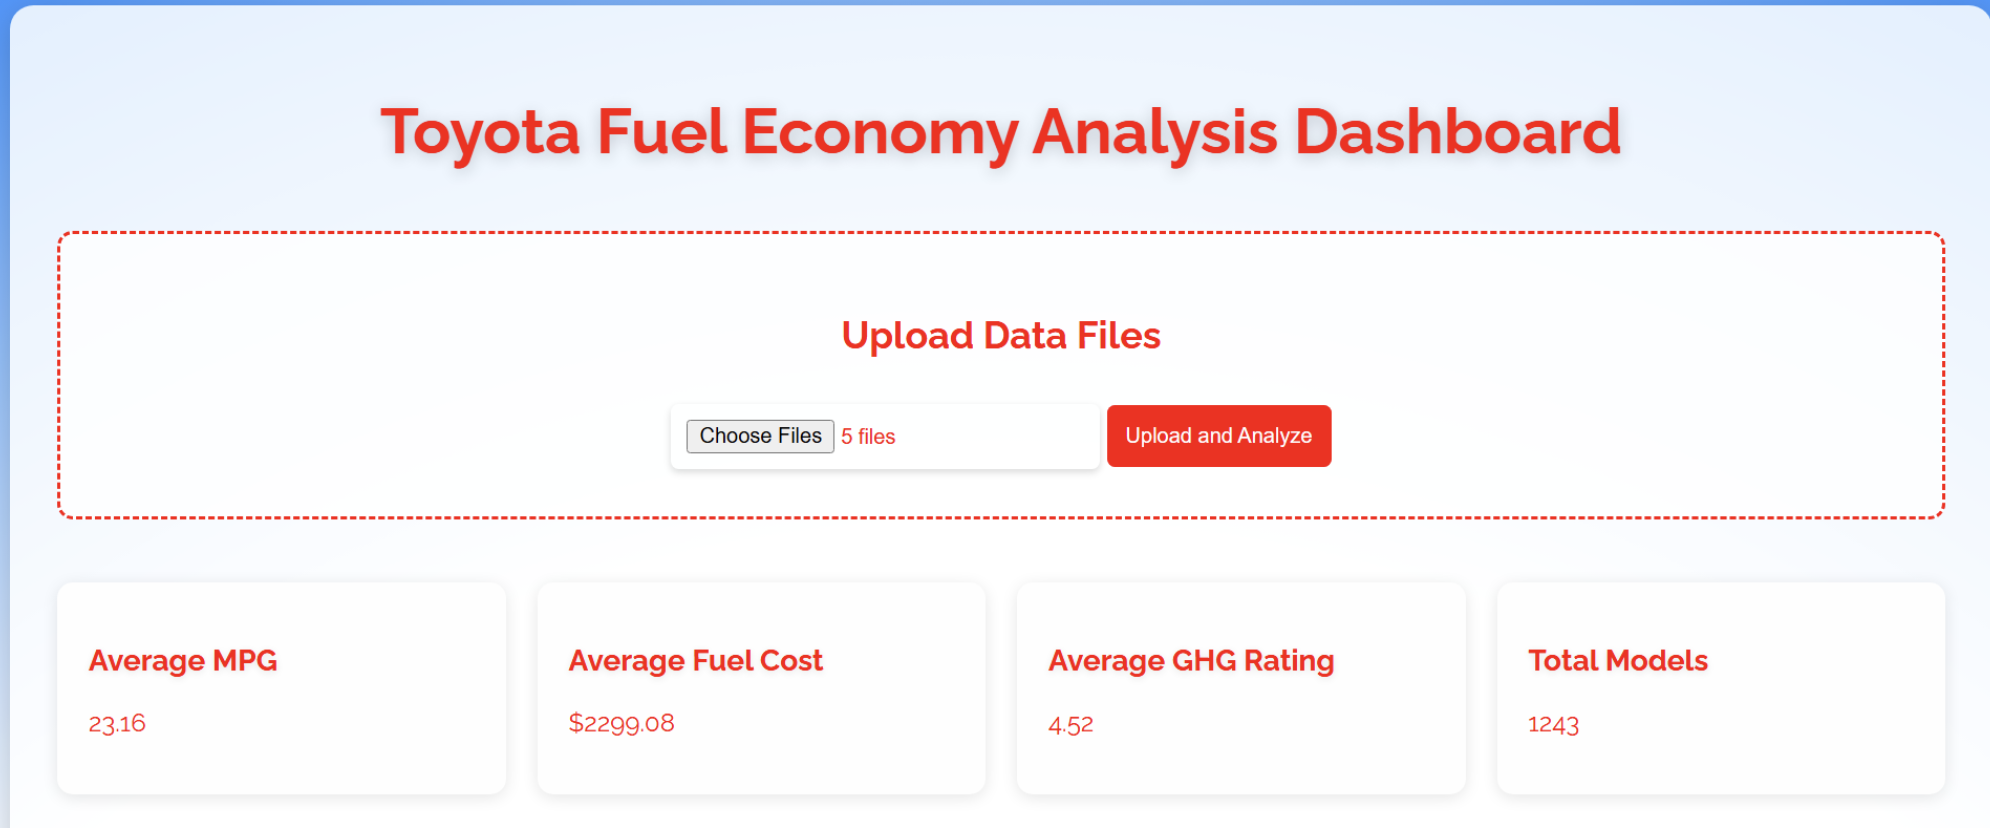
Upload excel sheets to run website
-
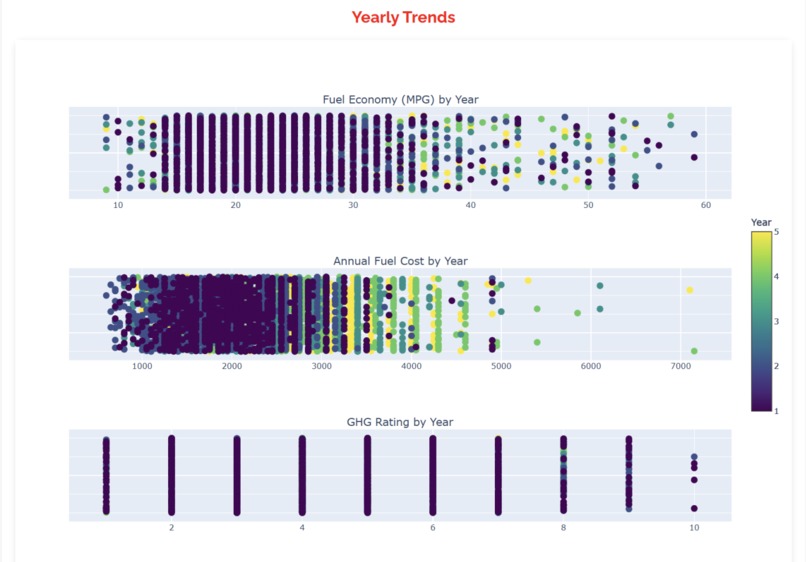
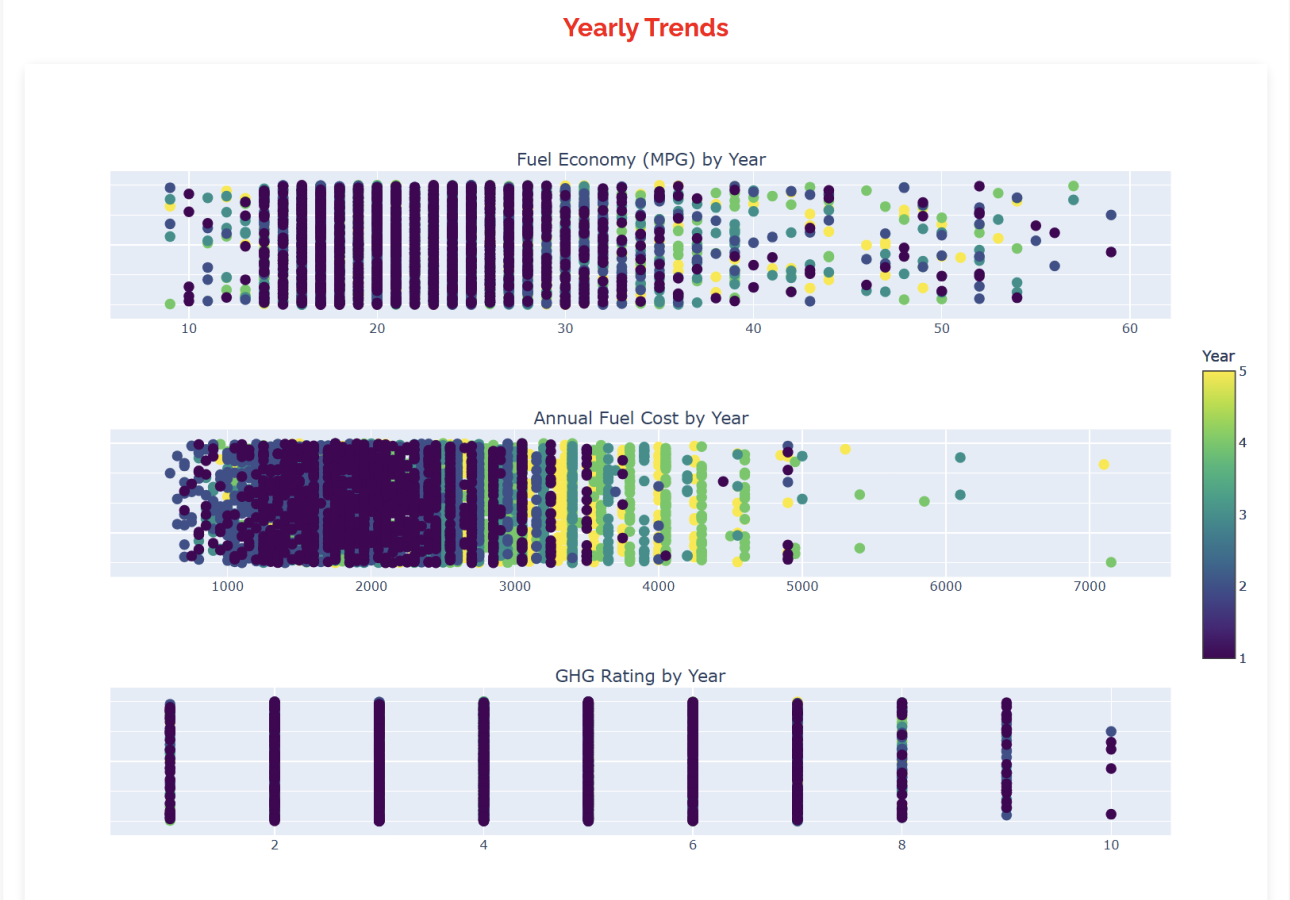
Graphs for data
-

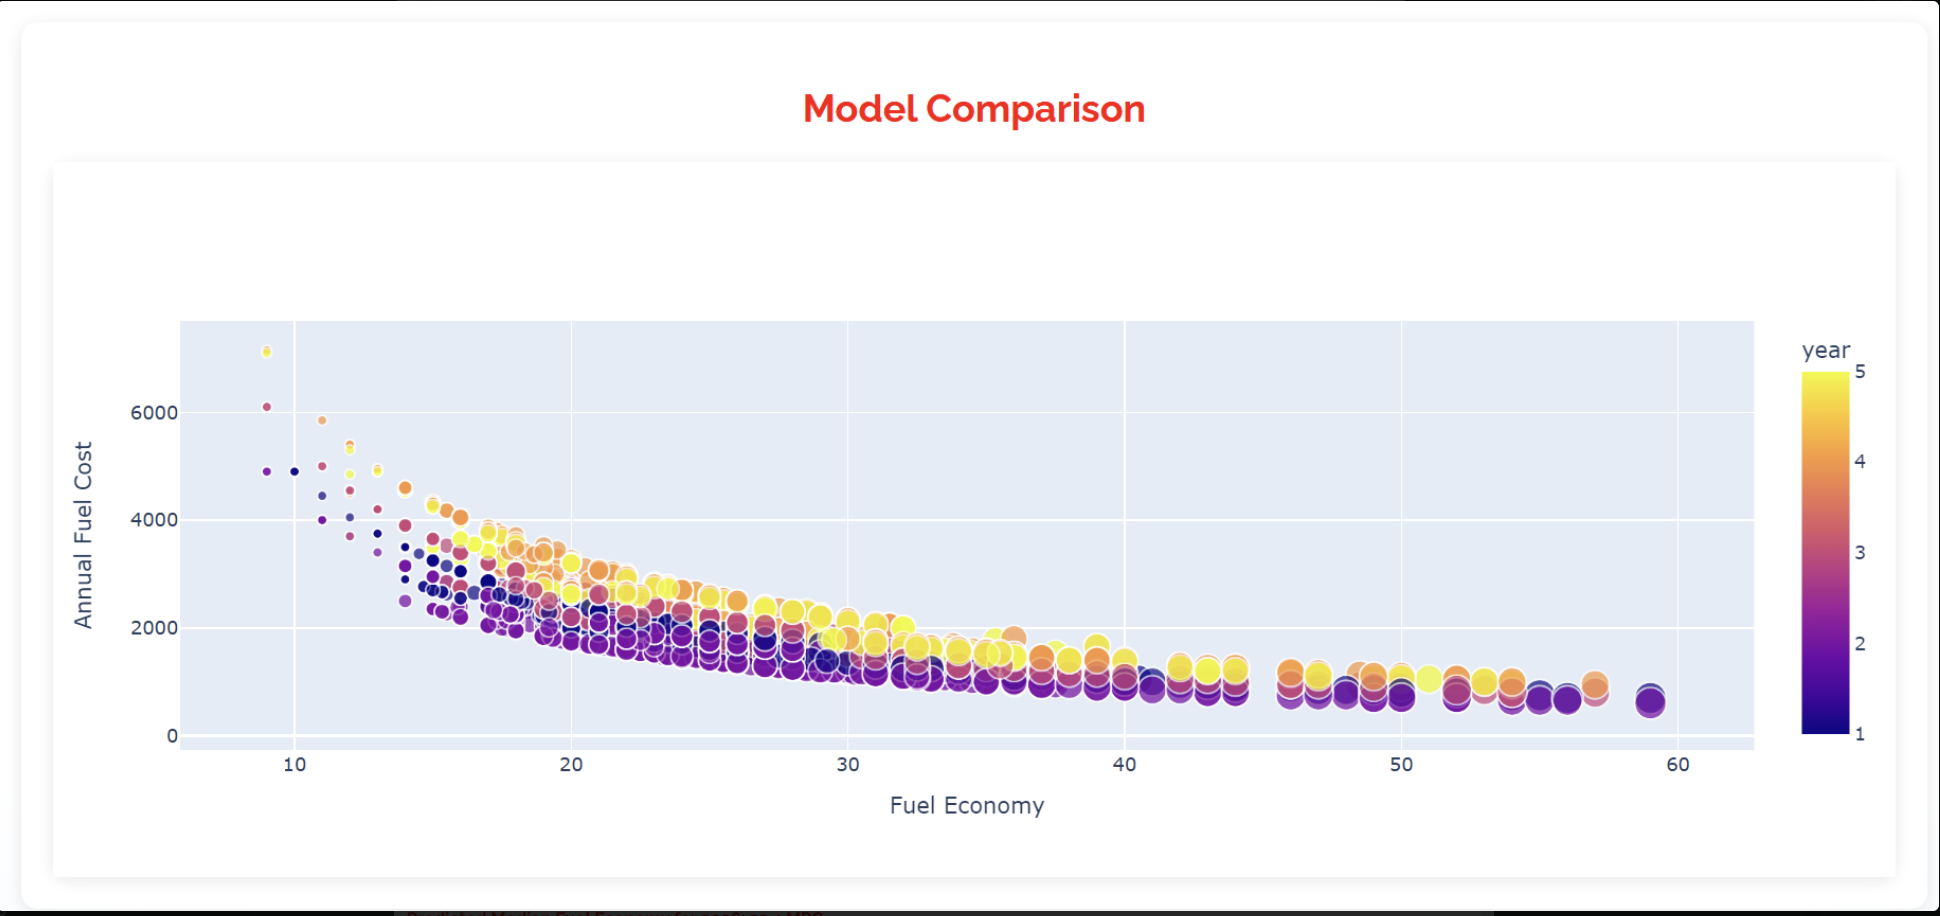
Comparison Graph
-
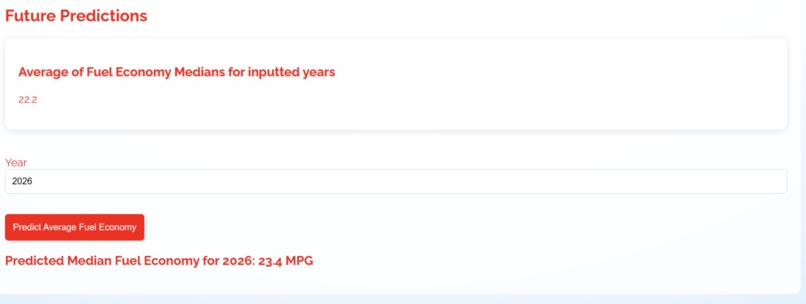
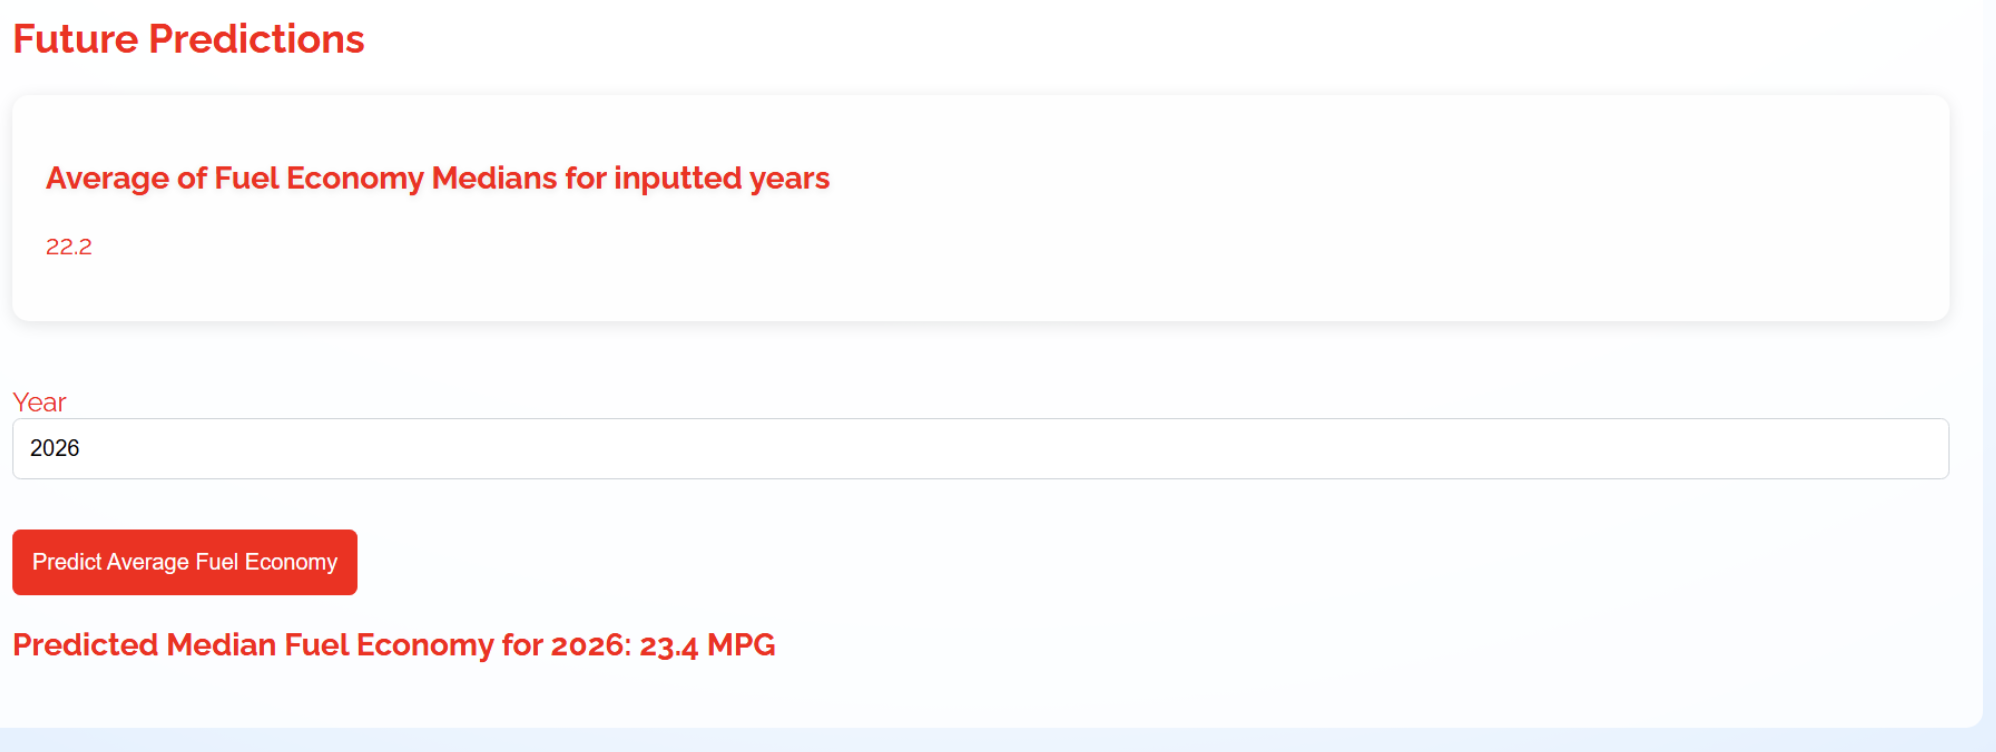
AI Future Fuel Economy Predictor
Inspiration
Our inspiration was to use this data to decrease fuel consumption for the vehicle and make it easier for businesses, especially Toyota, to improve their vehicles. We were inspired to use AI to make future predictions based on trends in data due to our passion for data analytics.
What it does
We can take at least 5 Excel sheets worth of data on fuel economy per year, and it displays the data on miles per gallon, fuel cost, greenhouse gas rating, and number of car models. The data is presented in the form of scatterplots but the average values are also explicitly stated in boxes. By hovering over points in the graph, the user can see specific values for these attributes. The website also has an AI that uses linear regression to predict the fuel economy for future years based on current data trends.
How we built it
We built the UI interface using HTML and JavaScript. We tried to make the website look appealing visually and also easy to use. The UI is red and blue in color. The backend code was developed through Python, which allowed us to develop the AI components easily and also helped with the analysis of data to create scatterplots for each year's fuel economy. The code takes in any number of Excel sheets that contain fuel economy data for a certain year, and using that data, it displays information on the screen in the form of graphs. The AI component that makes predictions for future fuel economy in a given year uses a linear regression model to analyze and train existing data, which is given in the form of Excel sheets. We deployed the website through Flask to connect the front-end and back-end components. All our code was pushed onto a GitHub repository to allow for easy collaboration.
Challenges we ran into
One major challenge we ran into was deploying Flask because when we initially tried to connect the front-end and back-end components, the server would crash. We eventually realized that this was due to an error when committing changes in the GitHub repository and how we imported the necessary packages involved for programming in Python. Since we had to use virtual environments to deploy the application, the process of development was very tedious as packages would sometimes not import correctly. Another challenge we ran into was pushing code to Git Hub because, for some reason, the website did not let us push our UI interface code alongside our back-end Python code. After researching various GitHub commands and making new repositories, we were eventually able to put all the code in one place. When it came to our backend code, we ran into the issue of the website not being able to read the Excel sheets it was given because it was looking at the wrong columns of data. After changing the code to look for specific attributes related to fuel economy on an Excel sheet, the website was able to accept Excel sheets and, in turn, use the data to form graphs. Our graphs were a bit inaccurate at first, but after improving the axis to fit the Excel data, we were able to fix this issue and display the correct info. A similar issue occurred with AI that makes future predictions, as it initially displayed values that were too high or too low, but after tweaking the code for linear regression a bit and training it on better datasets, we were able to get realistic values. Overall, we faced a lot of issues throughout the development of this website, but through perseverance and confidence, we were able to overcome all of them. ## Accomplishments that we're proud of We are proud to have learned officially how to do full-stack development and how to incorporate AI components through Python. Overnight, we were essentially able to learn how to use Python for data analytics and HTML/JavaScript to develop UI interfaces. We are glad that we were able to persevere through the various challenges we faced when programming and that we learned how to collaborate effectively on Git Hub. Essentially, our group was able to learn more about the necessary technologies needed for development in the modern era, which we hadn't experienced before.
What we learned
This entire project was a huge learning experience for all of our group members. We previously only had experience in Java, C++, and some HTML, but through this project, we learned how to do full-stack development and code in both the front end and back end. We learned how to use HTML and JavaScript to make interesting UI interfaces, and we learned how to use Python to analyze data and essentially code AI that can make predictions based on this trend. We also learned how to manage GitHub repositories well and deploy websites on Flask. Our group was very proud of our progress, and overnight we became better programmers as a whole.
What's Next for Team Registration
Creating a mobile app, adding more filters and flexibility, making it customizable for each user, and adding more features.


Log in or sign up for Devpost to join the conversation.