-
-
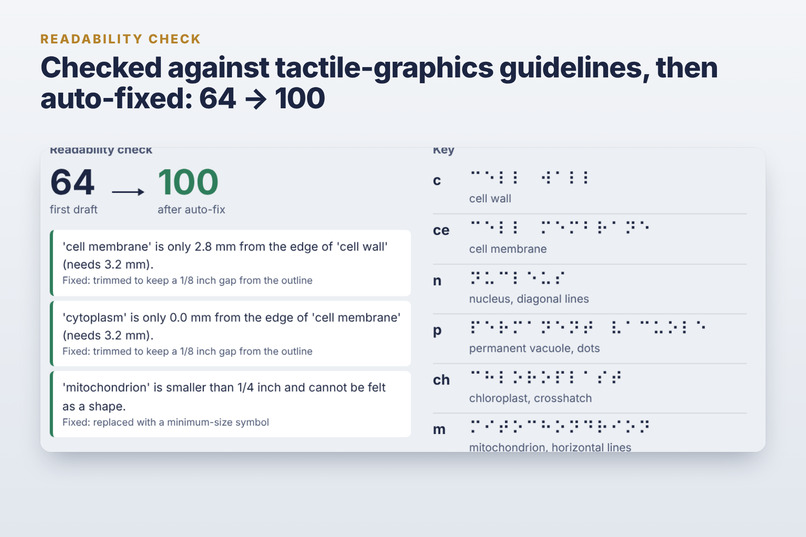
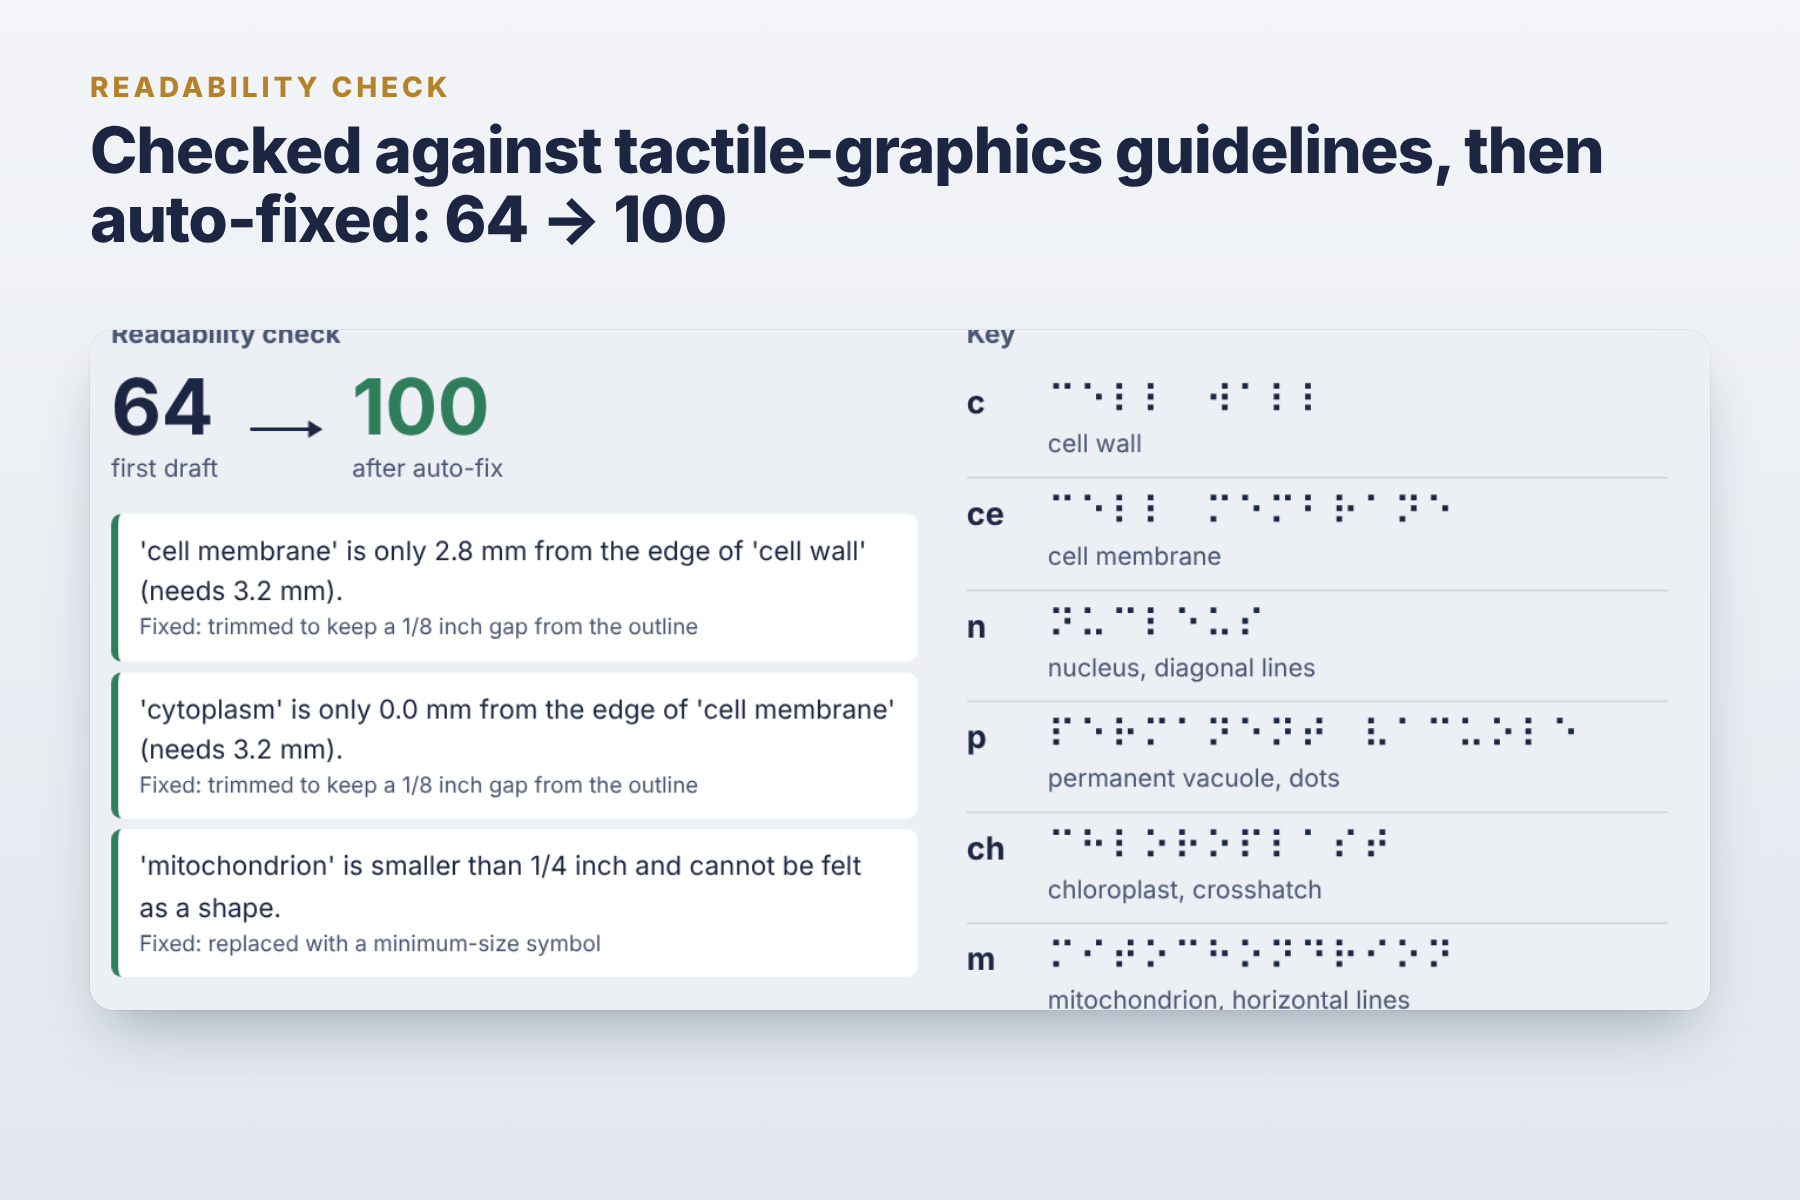
Readability check, 64 → 100
-
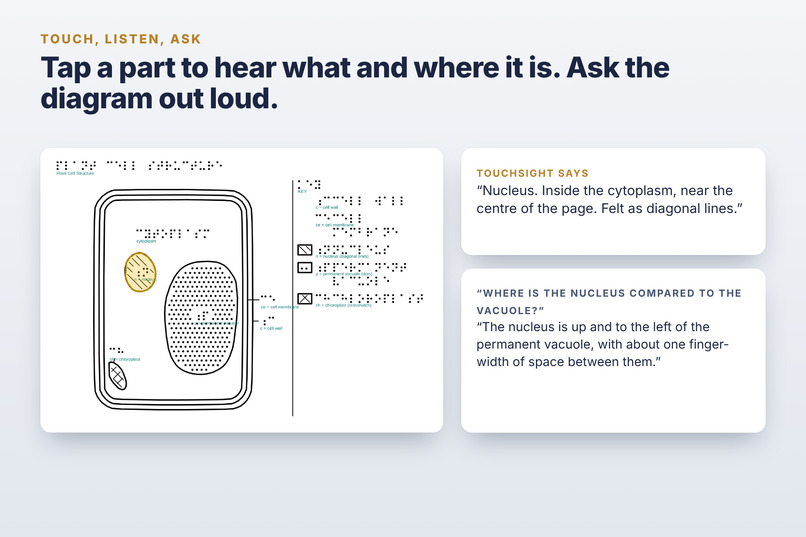
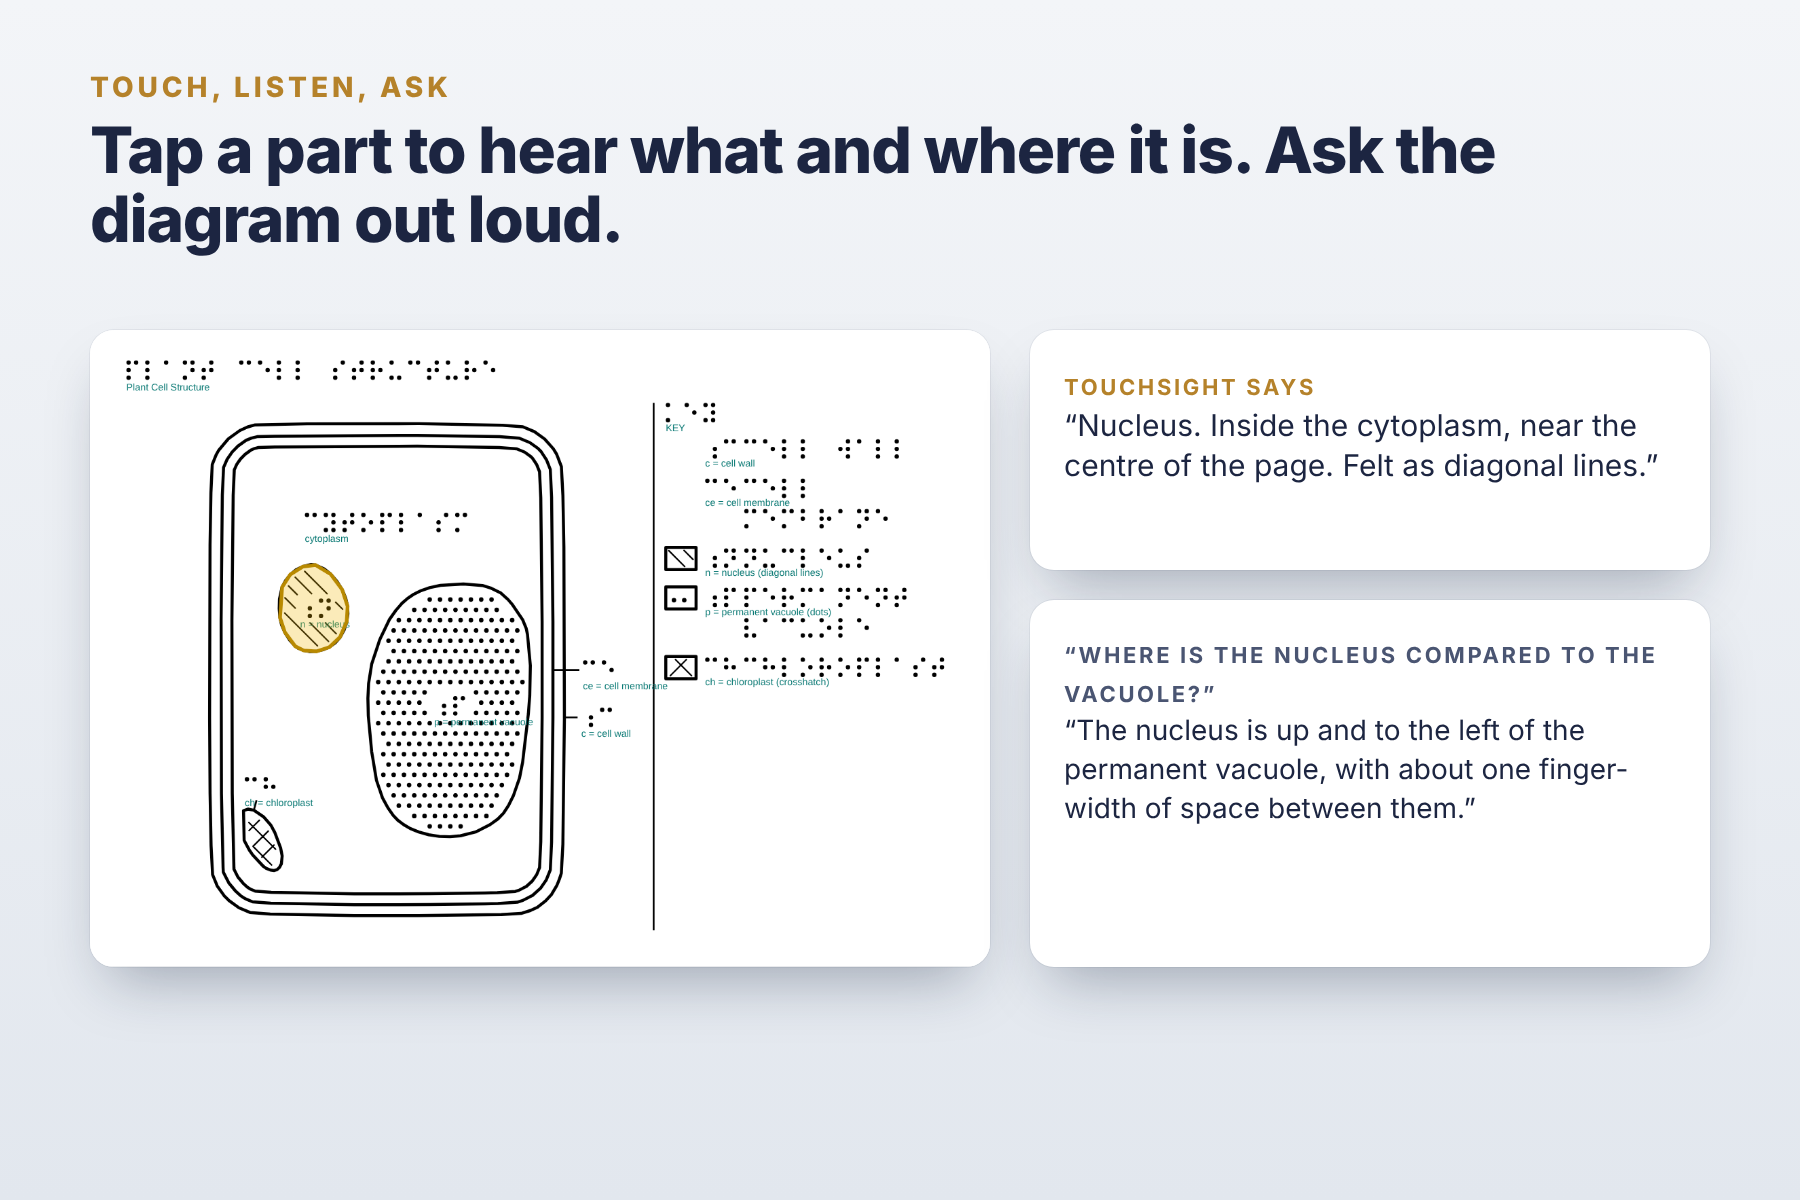
Touch, listen and ask
-
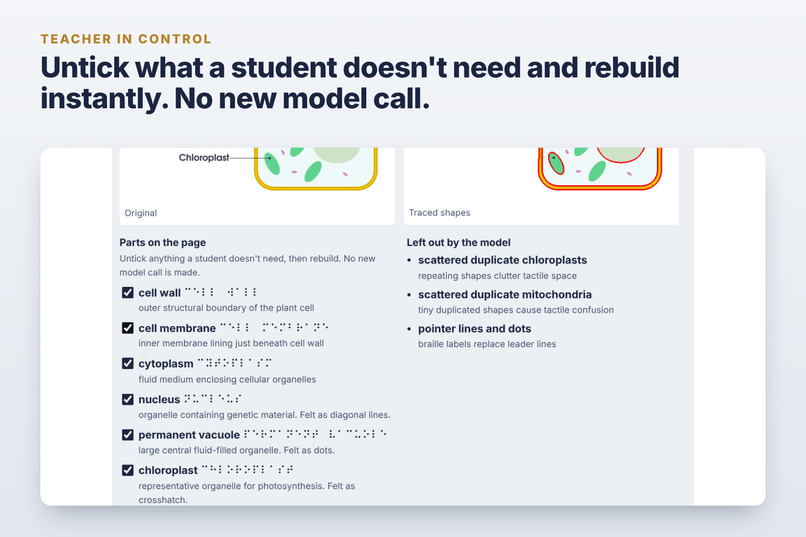
Teacher editing parts
-
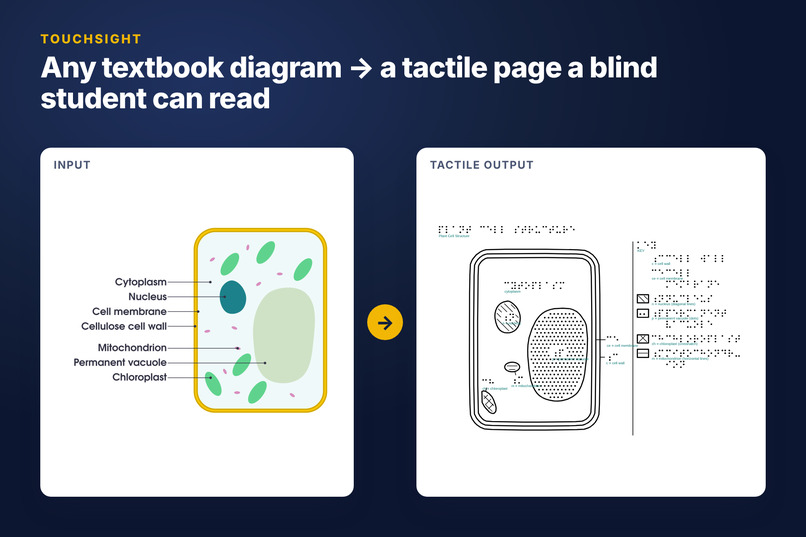
Input → tactile output
-
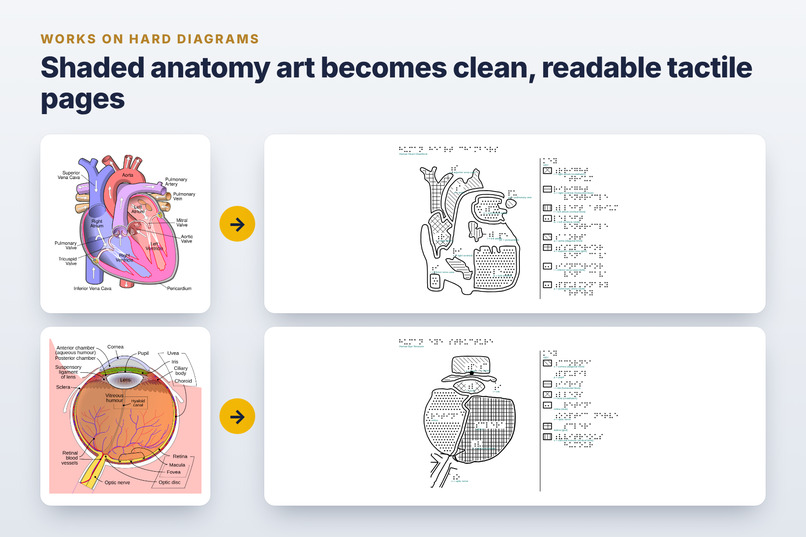
Heart and eye
-
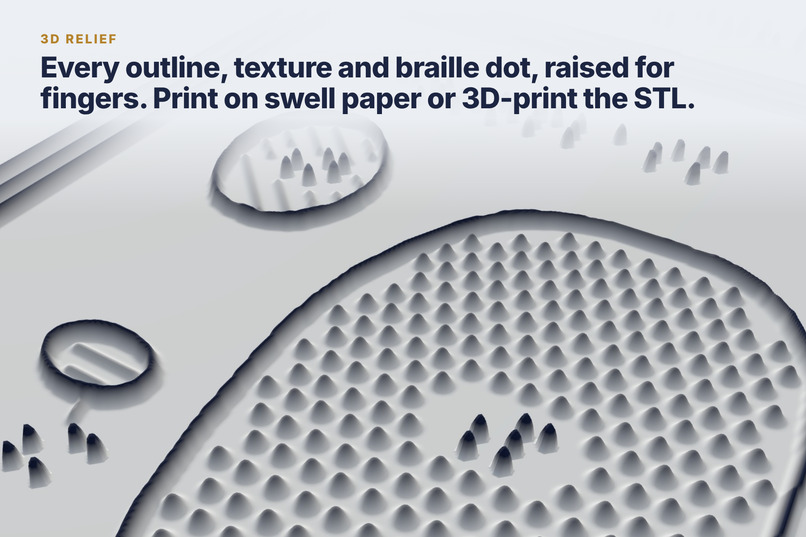
3D relief close-up
Inspiration
Science is taught in pictures: a cell, a heart, an eye. A blind student usually gets one sentence of alt text instead. A real tactile graphic has to be redrawn by a specialist, with raised outlines, textures and braille, and that takes hours per diagram, so most diagrams are never made. I wanted a teacher to be able to make one the night before the lesson.
What it does
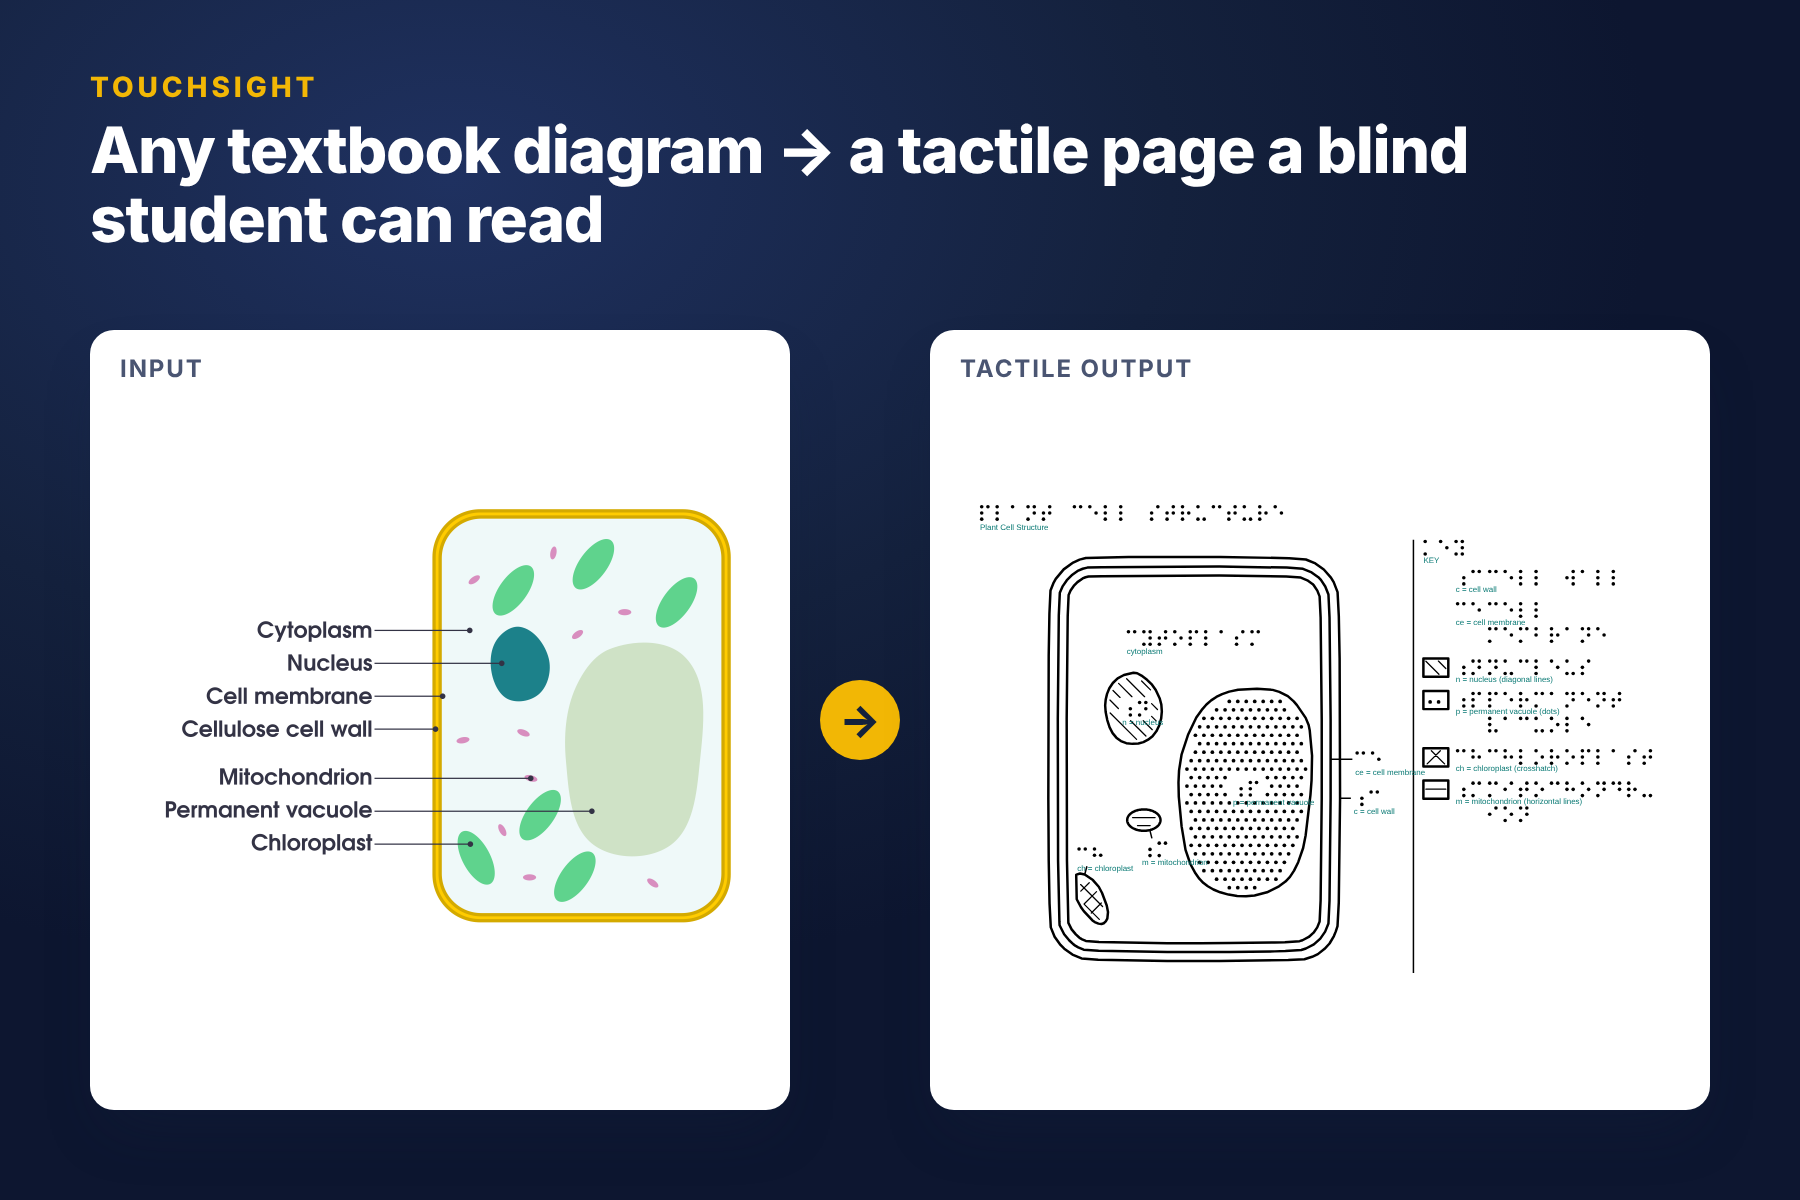
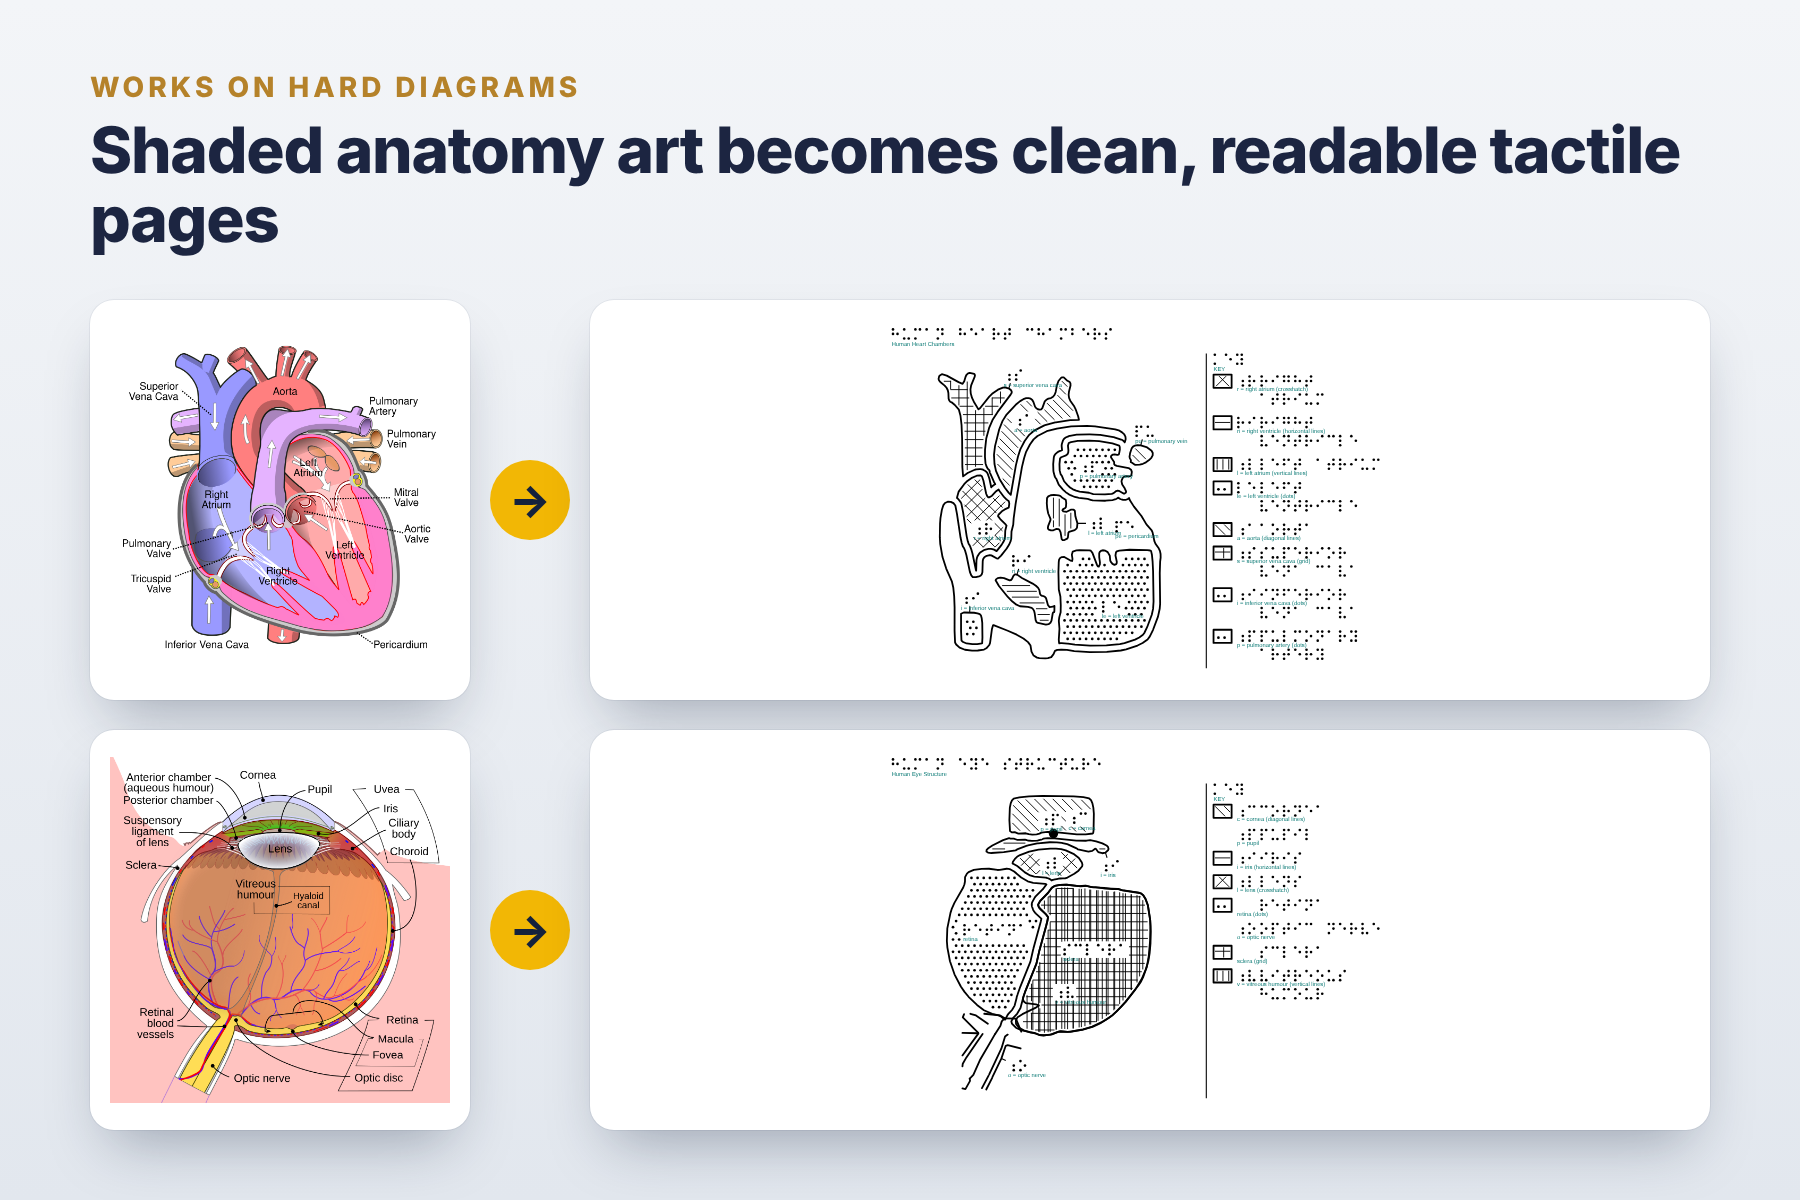
Upload or photograph any textbook diagram and TouchSight returns an A4 tactile page in seconds:
- Simplified shapes with clutter (leader lines, duplicates, tiny details) removed
- A distinct texture for every part, with neighbours never sharing one
- Braille labels and a braille key (UEB grade 1)
- A readability check against tactile-graphics guidelines (shapes at least ¼ inch, ⅛ inch gaps), with auto-fix. The plant cell goes from 64 to 100
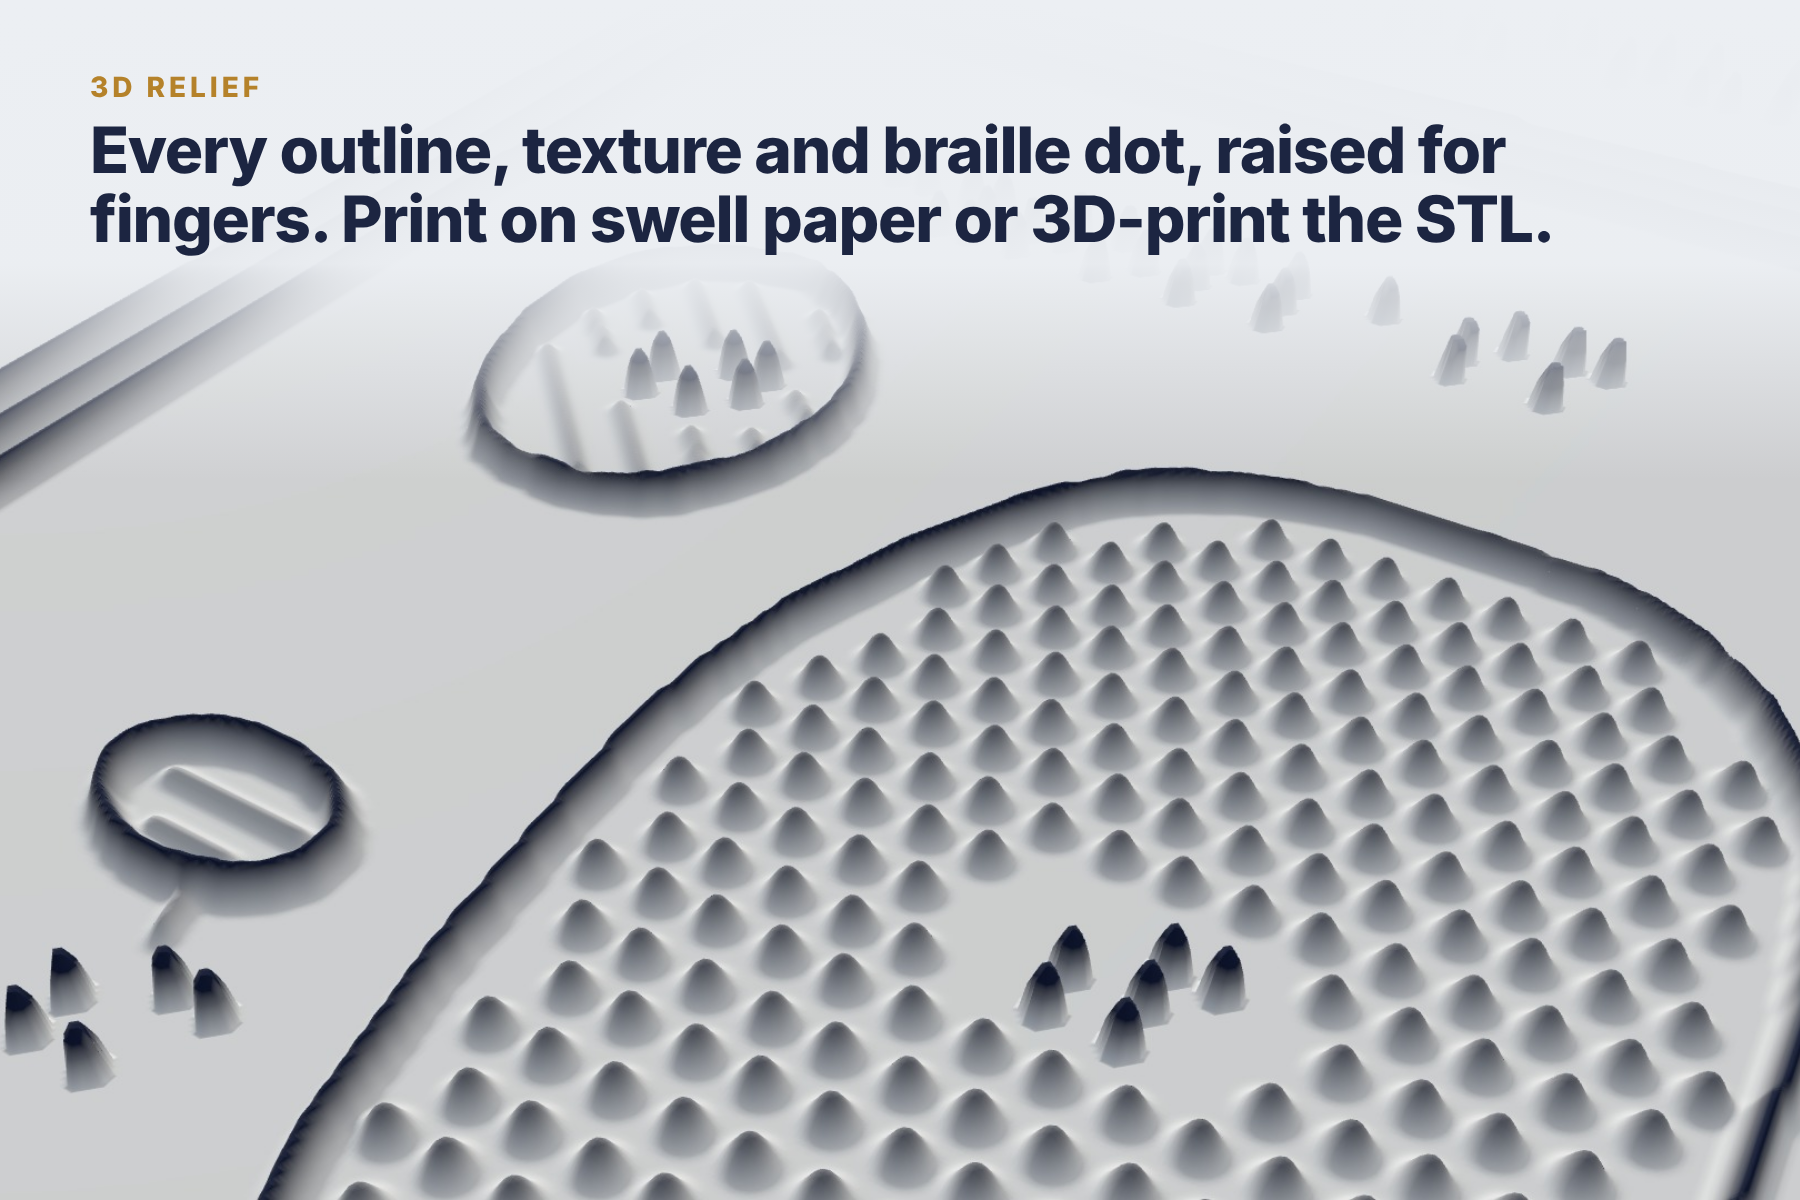
- Exports: print SVG for swell paper, a height map, and a watertight STL for 3D printing
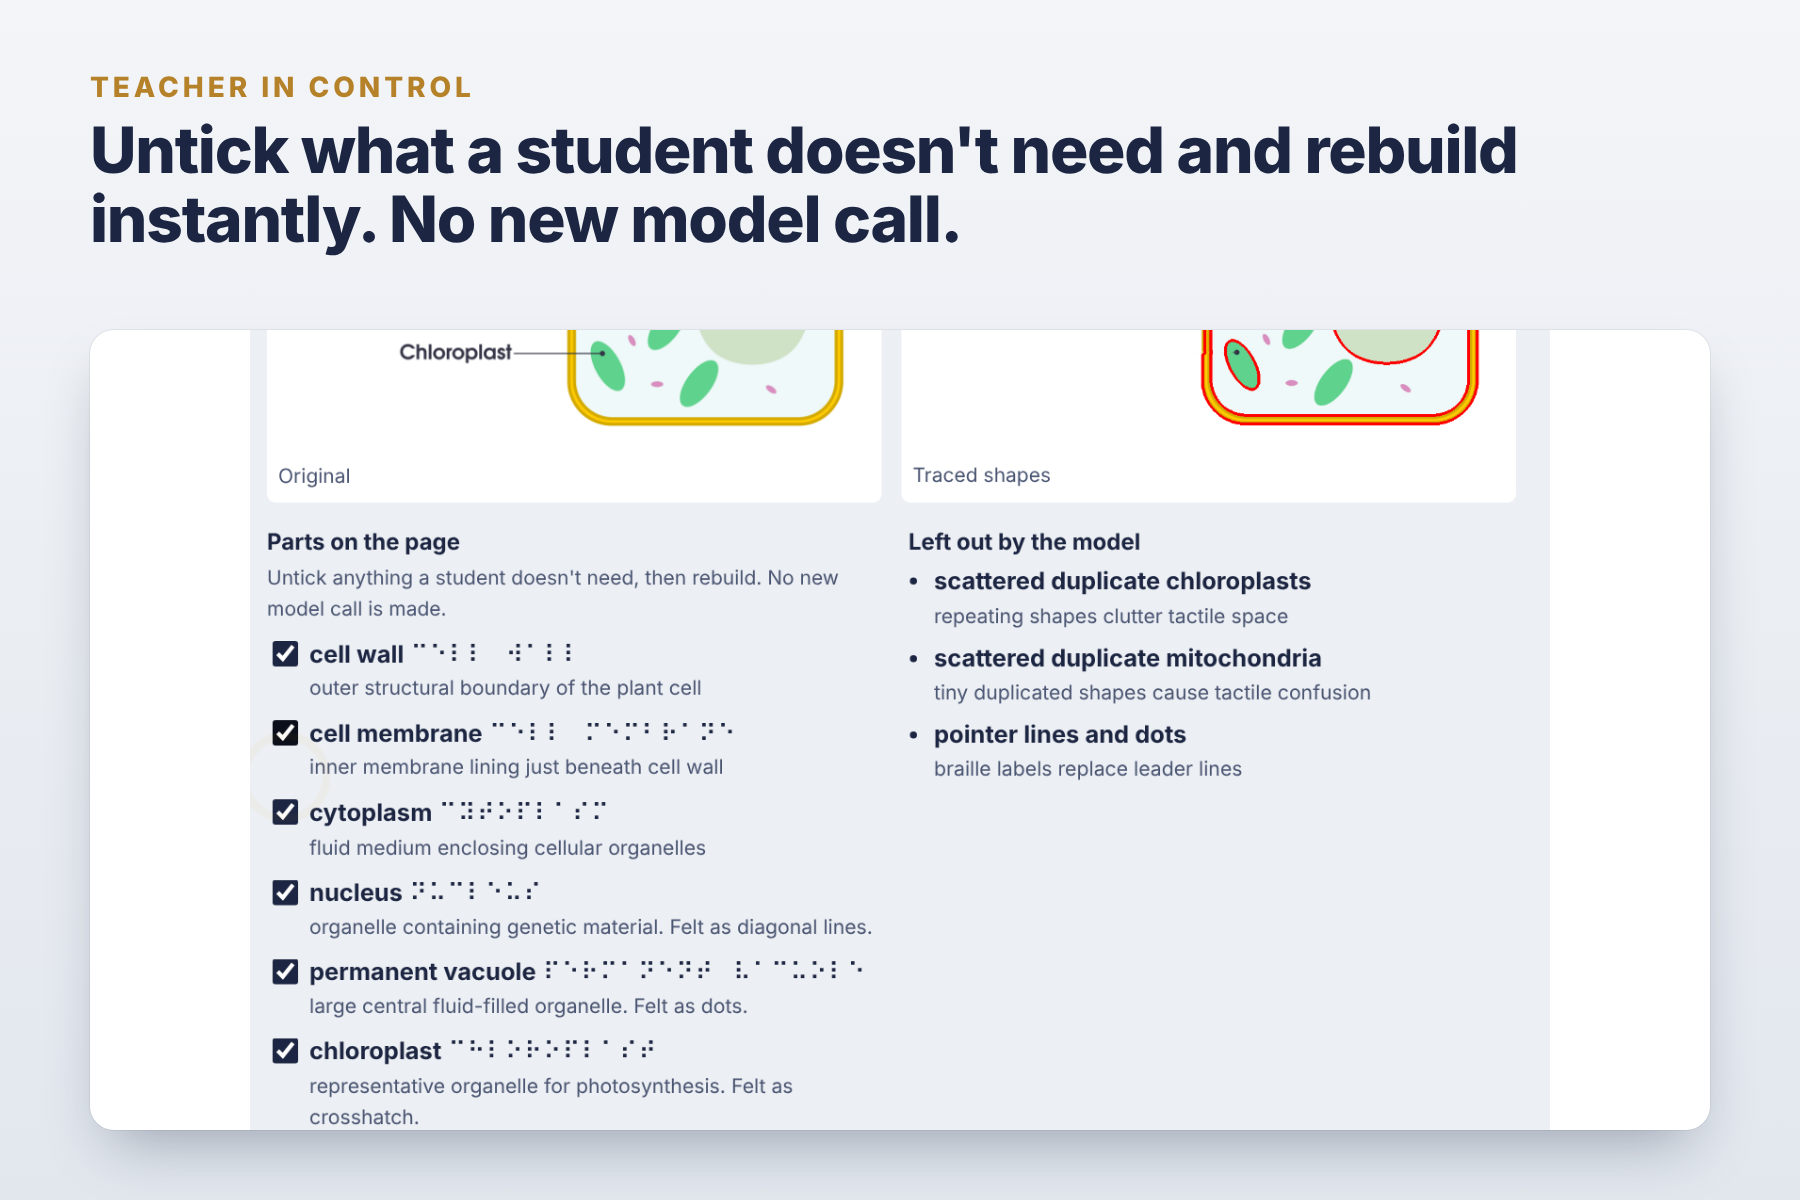
It also talks. Touch and listen reads out what a part is and where it sits ("inside the cytoplasm, near the centre, felt as diagonal lines"). Ask the diagram answers spoken questions like "where is the nucleus compared to the vacuole?" using real page geometry, in finger-widths. Teachers can untick parts and rebuild instantly, with no new model call.
How I built it
- Understand: a vision model (Gemini, with Groq as fallback) decides which parts a student needs and returns bounding boxes. Images are padded to a square so coordinates stay accurate.
- Trace: OpenCV and scikit-image remove text, cluster colours in Lab space into regions, and assign each region to the smallest box containing it. GrabCut and edge hulls are fallbacks. Thin structures are skeletonised into paths.
- Design for touch: a geometry engine in millimetres infers nesting, keeps dead zones, graph-colours textures, places braille labels and builds the key.
- Check and export: a validator scores the page, auto-fixes it, then writes SVG, height map and STL.
- Frontend: Next.js with a three.js relief view and the Web Speech API. FastAPI backend on Render, frontend on Vercel. 52 tests.
Challenges
- Shaded textbook art traced into blobs until I switched to colour-region assignment.
- One model squashed coordinates on non-square images, fixed by padding.
- Removing a parent shape left children overlapping, so nesting is inferred from geometry rather than trusted from the model.
- Free-tier quotas and cold starts meant caching readings, a provider fallback and a wake-up ping.
What I learned
Tactile design is subtraction: a good tactile graphic shows less than the original. The AI is best at judgement (what matters), and plain geometry is best at precision (sizes, gaps, braille spacing). Splitting the work that way made the output trustworthy.
What's next
Testing with teachers of visually impaired students and transcribers, contracted braille, and more diagram types such as graphs and maps.
Built With
- fastapi
- next.js
- opencv
- python
- scikit-image
- typescript
- web-speech-api

Log in or sign up for Devpost to join the conversation.