-
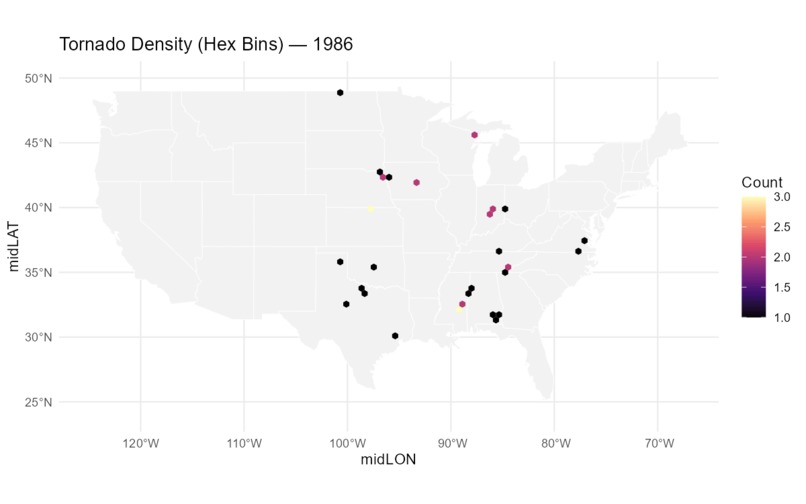 GIF
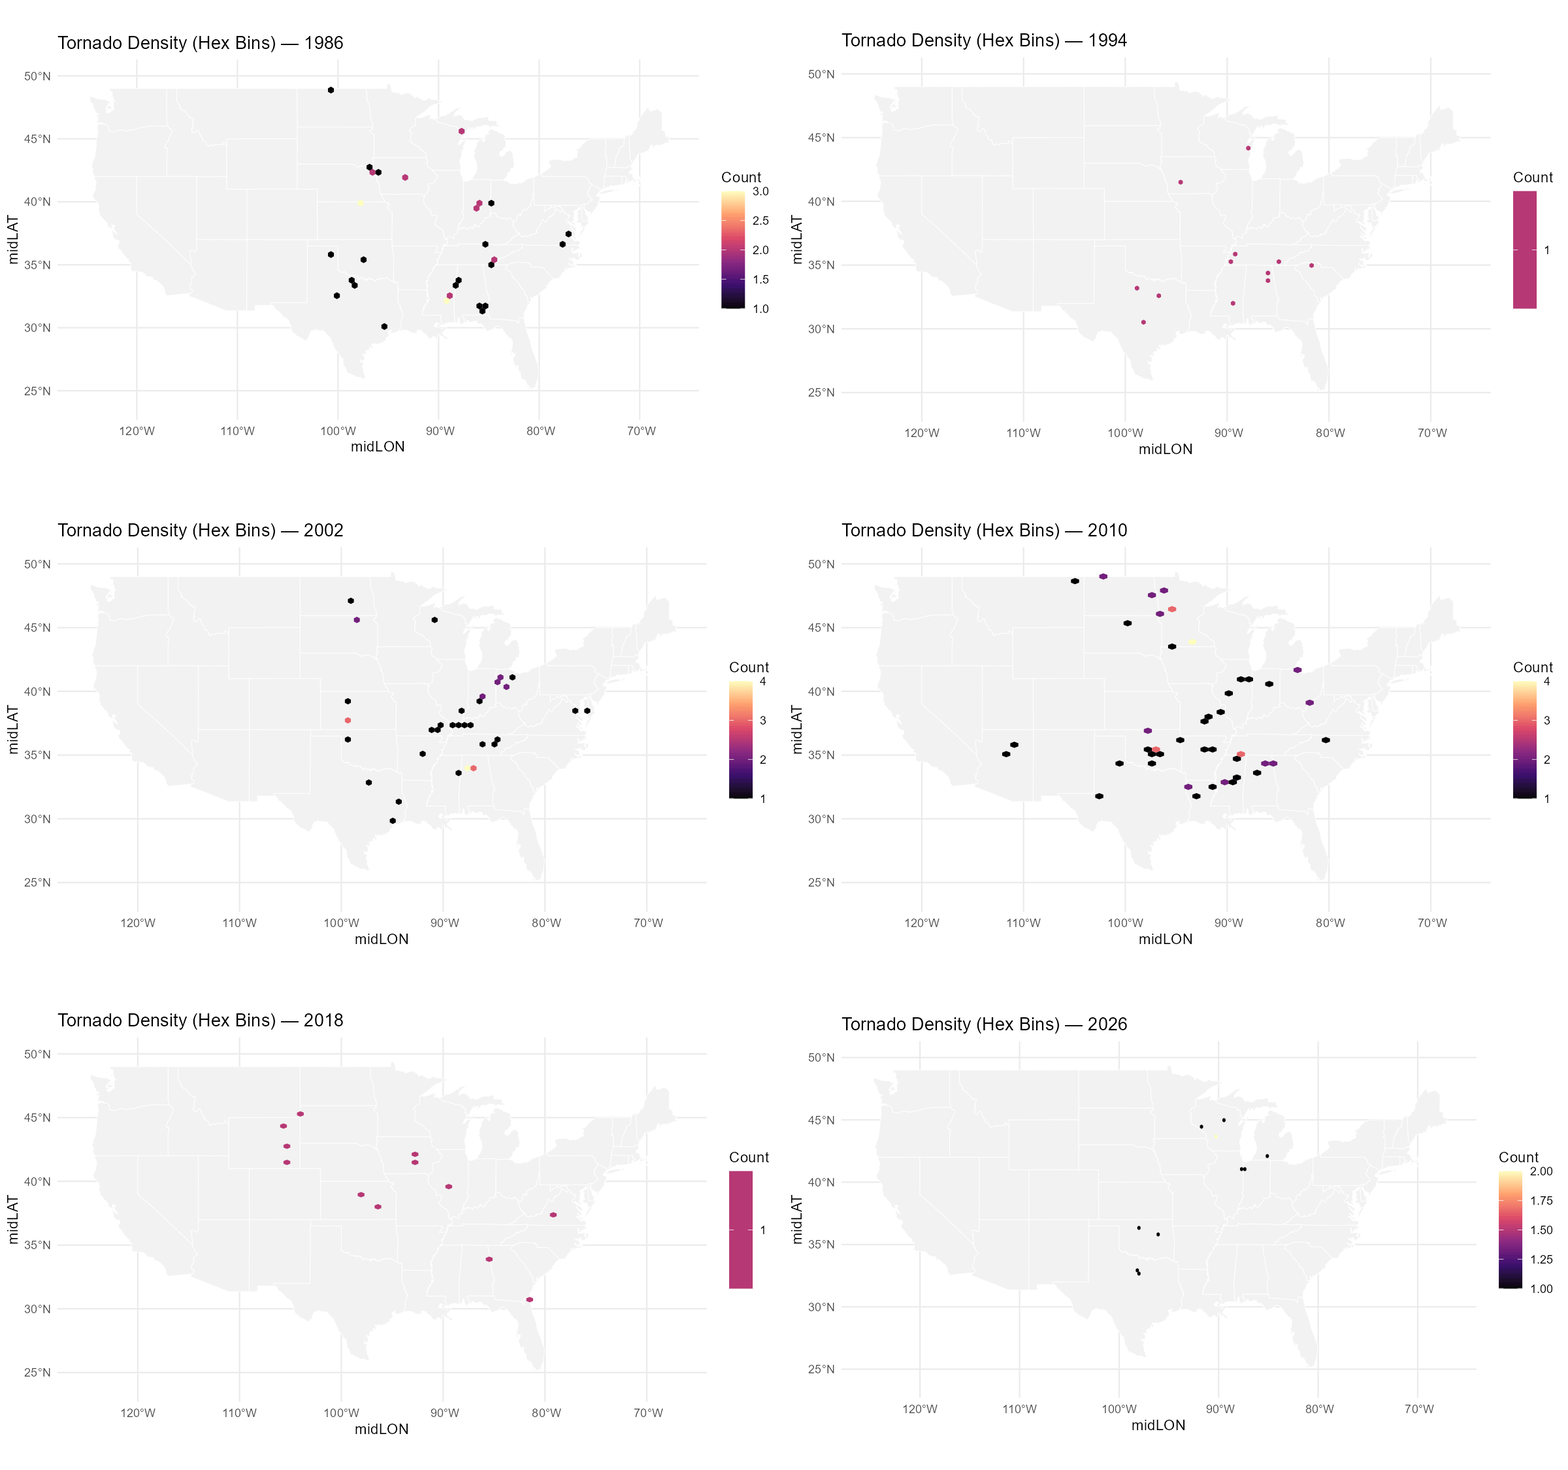
Gif of tornado densities per year 1986-2026
-
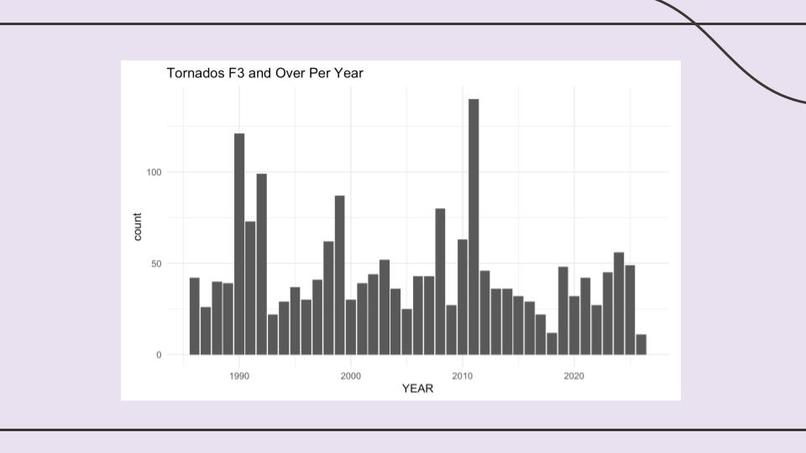
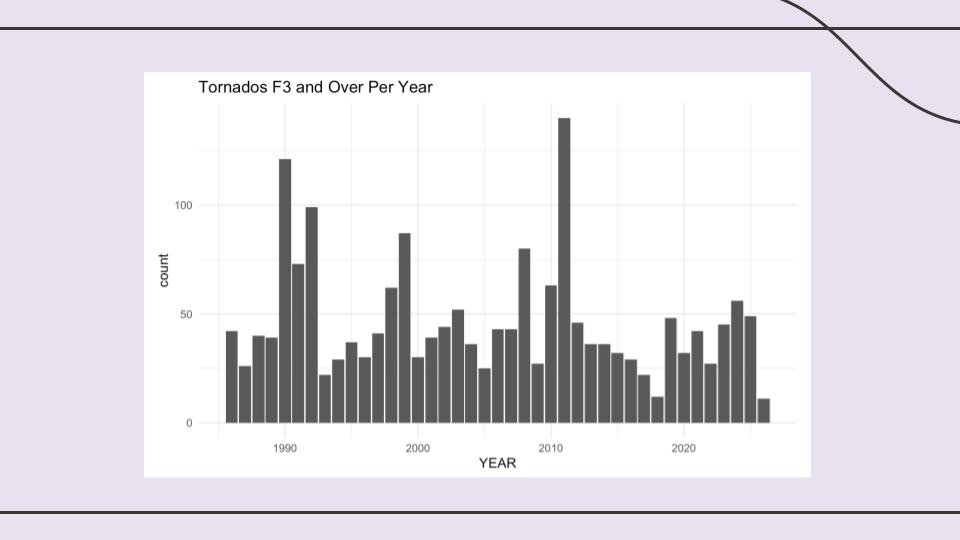
Bar chart of number of tornadoes per year
-
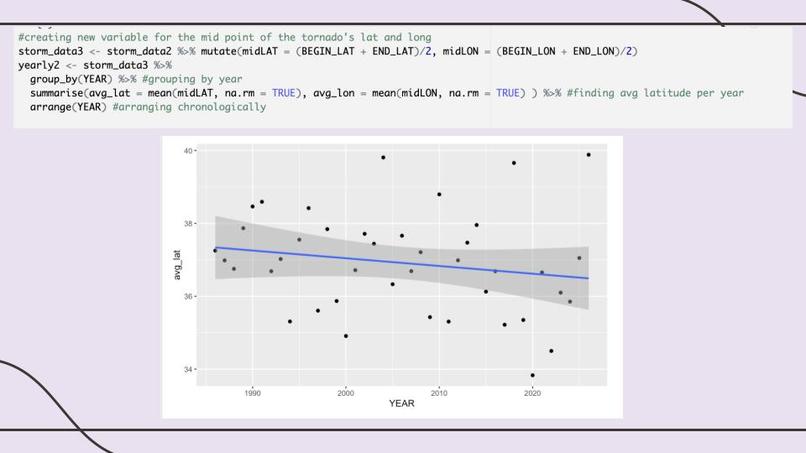
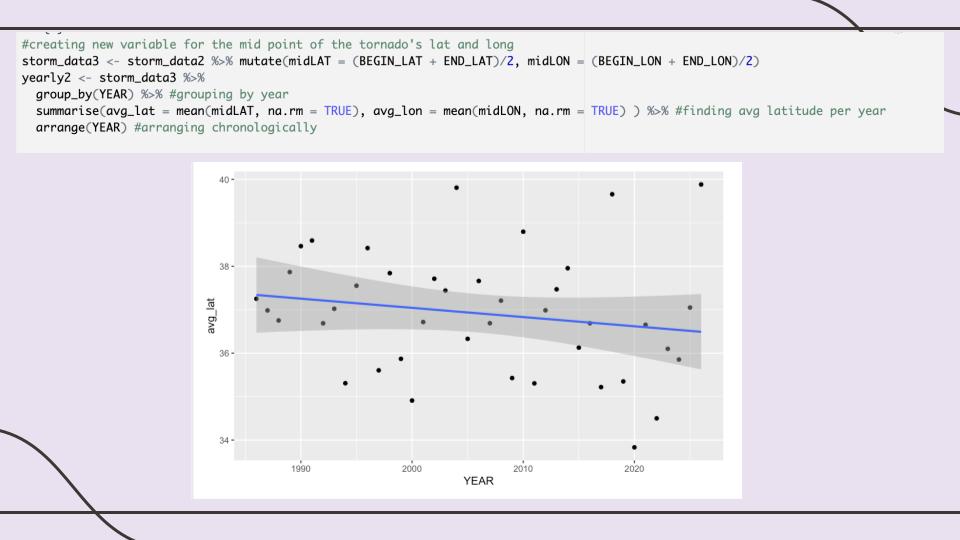
Scatter plot with regression line showing average tornado latitude per year over the years
-
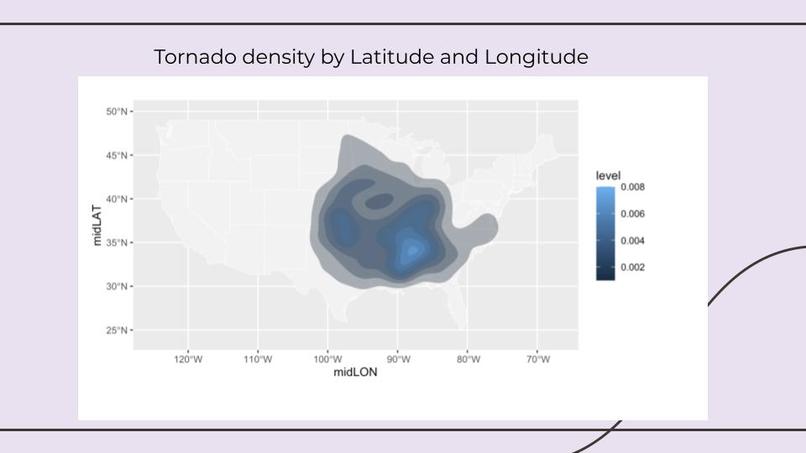
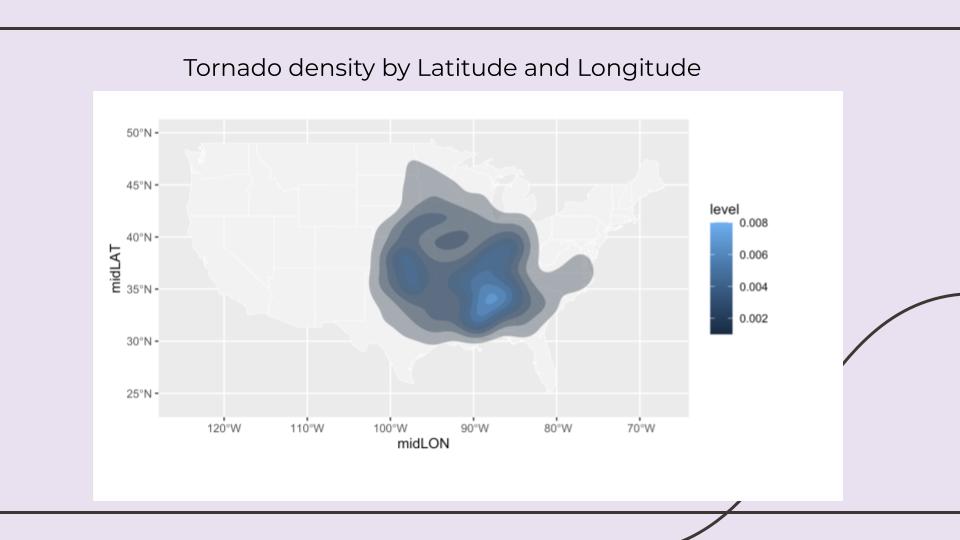
Heat map showing tornado density in America 1986-2026
-
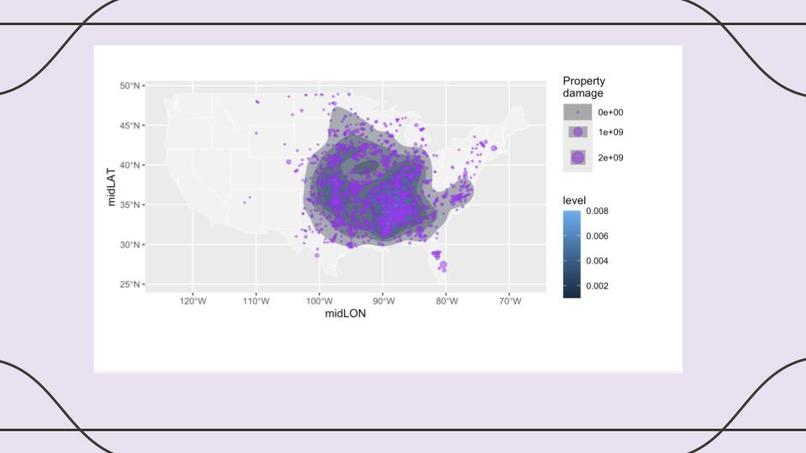
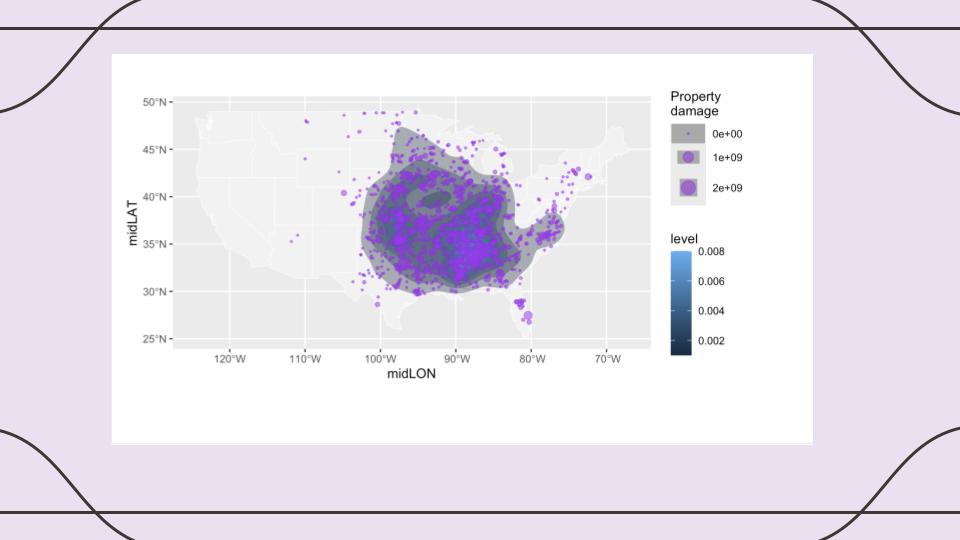
Heat map showing density of tornadoes in America overlaid with amount of property damage
-
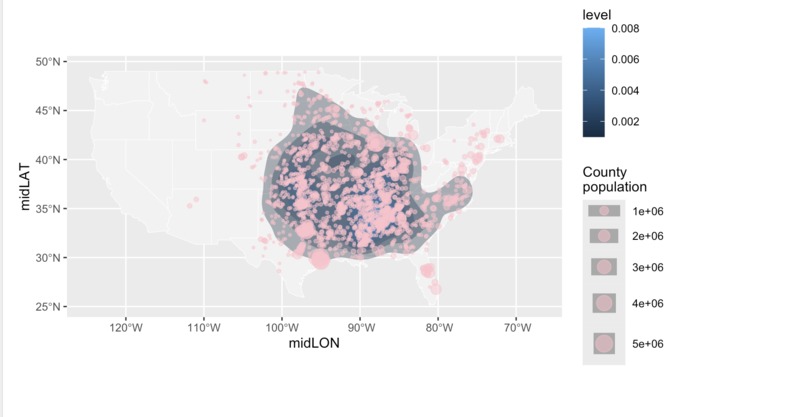
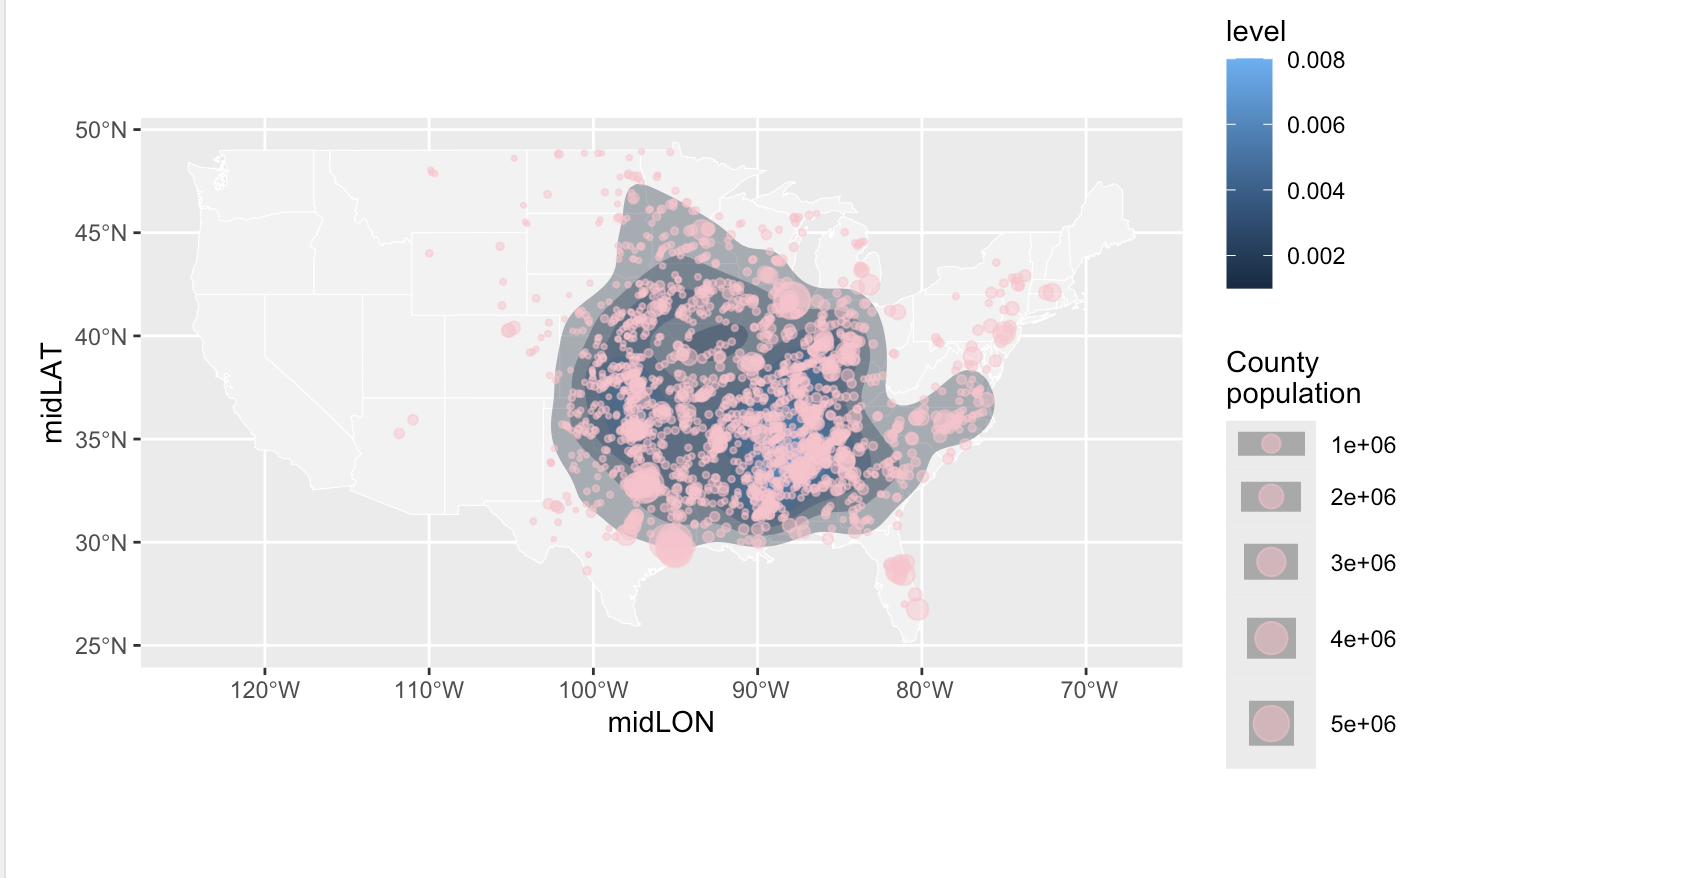
Heat map showing density of tornadoes in America overlaid with population per county
-
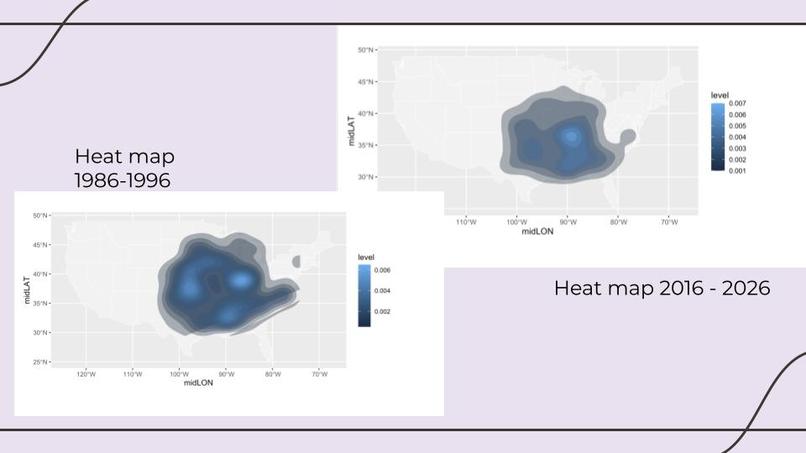
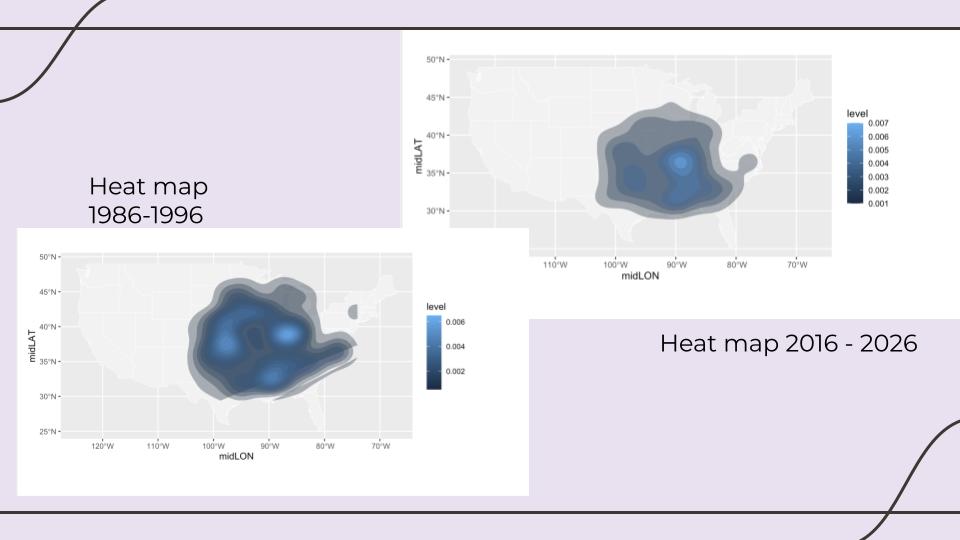
Two heat maps showing density of tornadoes in America, one from 1986-1996 and one from 2016-2026
-
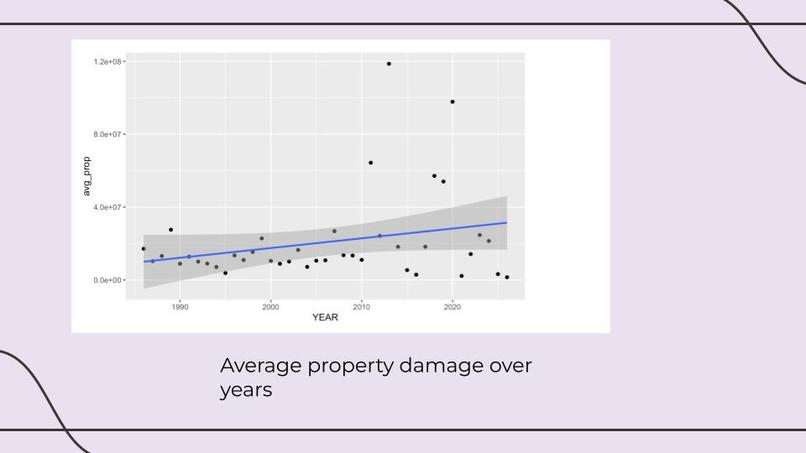
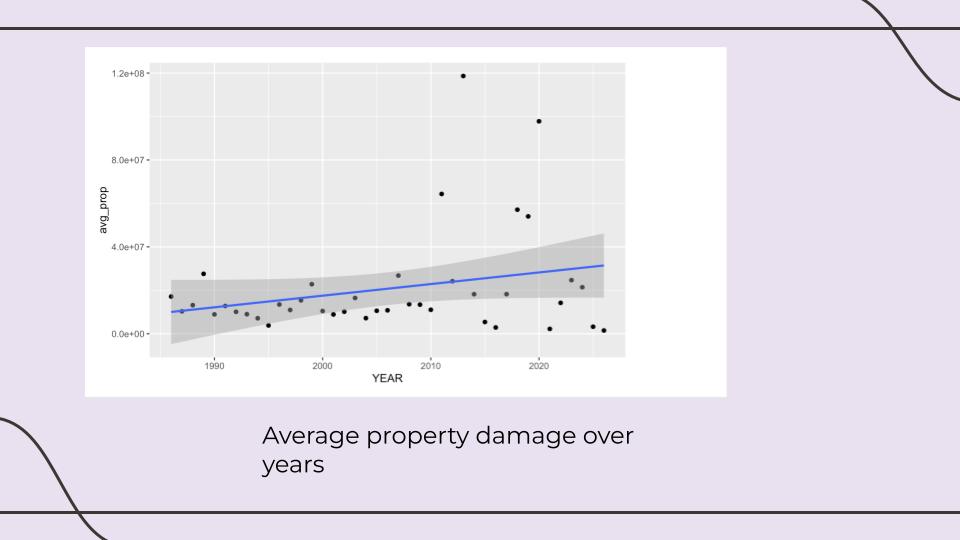
Scatterplot with regression line of average property per year against years
Inspiration
We were inspired by reading about how tornado alley, the region with the highest number of tornadoes in America, might be shifting into the southeast. We wanted to see if we could visualize this shift and see if it is in fact happening. We were also interested in the implications of this shift on the American people, and whether it would have any affect on the number of people who experience tornadoes or the property damage that the tornadoes will inflict.
What it does
It helps us visualize the shift of tornadoes in America over the past 4 years, and understand how this may be pushing tornadoes into higher population areas who are less prepared.
How we built it
We started by using the api to query the NOAA bulk data database, and gathering all instances of tornadoes of severity F3 or higher in the last 40 years. We then made some preliminary bar charts, looking at the quantity of tornadoes over the years to see if there was a notable change. Then we created a variable called midLAT that took the average of the beginning latitude and the ending latitude of a tornado, we also did the same thing with longitude. Then we found the average latitude and longitude per year of tornadoes, and plotted them against the year variable. We saw minimal change for average longitude over time, but saw a slight negative association with latitude over time. When fitting a linear regression of latitude against the year variable we saw a slight but statistically significant negative relationship. We then created heat maps that showed the concentration of tornadoes from 1986 to 1996 and from 2016 to 2026. These heatmaps seemed to support that the concentration of tornadoes was shifting slightly downwards. At this point, we wanted to examine whether or not this shift was changing the number of people affected. We joined the NOAA dataset with the countypop dataset from the usmap r package. We used the fips code of the county to find the population of the county that each tornado occurred in. From this by fitting a linear regression of the latitude against the county population. From this we found that with the counties affected by tornadoes, there is a statistically significant negative relationship between latitude and population. So as population increases, latitude seems to decrease. We can interpret that if tornadoes are shift downwards, they may be pushed into higher population counties. We also plotted property damage across years, and found that property damage has increased over the years. We also predicted the number of tornadoes in a state over five year periods. We found for Poisson model, Negative Binomial, and linear, the state it was in was predictive of the number of tornadoes in a five year period but the five year period was not predictive. By separating training data as 5 year periods before 2000 and after 2000, we also calculated mean absolute error for each model. We did most of our coding in R, but queried the database in python.
Challenges we ran into
We were trying to combine a population dataset with our tornado dataset based on the FIPS code, but in our tornado dataset the FIPS code for state and county were separate, but in the population dataset they were together and had a bunch of leading 0s. This caused the join to be significantly more complicated. We found that there was a lot of variation amongst tornadoes and a lot of noise that made it difficult to predict accurately, especially over a small time frame. For example, when we tried to plot things year by year it wasn't very interpretable.
Accomplishments that we're proud of
We're proud we were able to learn basic R fundamentals despite not having much experience! We're also excited and proud that we managed to put together a coherent and strong data story.
What we learned
We had varying skill levels and understanding of how to work with data going into this. Across all of us we learned how to use ggplot from having no prior experience with R, how to utilize for loops to generate multiple heatmaps using ggplot and the sf library.
What's next for Tornado Tracking
Ideally we would use a larger dataset, including all category of tornadoes, and then we would weight our models based on the severity of the tornadoes. Currently, Tornado Tracking only evaluates the density without taking into account the severity.

Log in or sign up for Devpost to join the conversation.