-
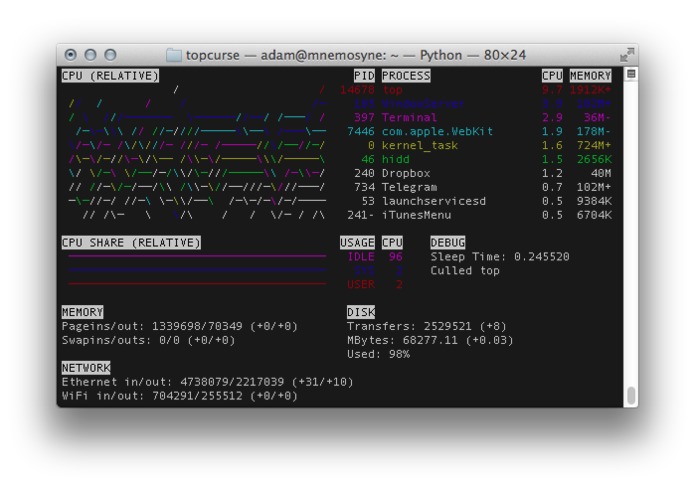
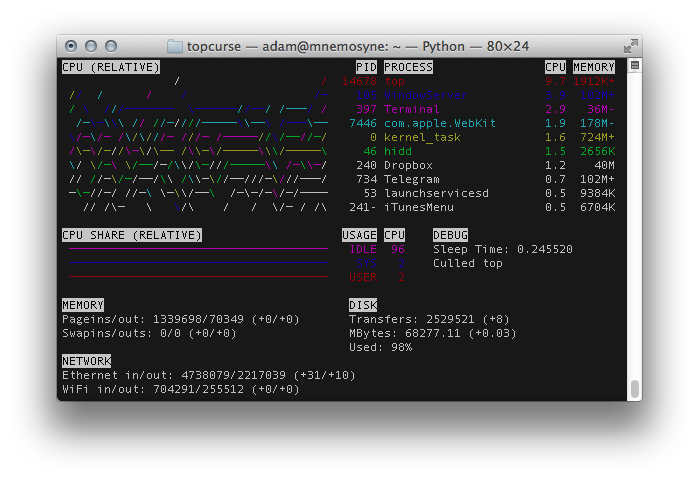
TopCurse in action
Inspiration
The midnight thought that one of the main pain points with top is that it's hard to keep track of how the most CPU-heavy processes are changing over time
What it does
Displays various system statistics (top-like listing of processes, disk transfers, network transfers, memory paging & swapping), including a line graph of the CPU usage by the listed processes. While not as in-depth as top or netstat or other traditional system monitoring tools, TopCurse aims to provide a quick overview of all basic system statistics at a single glance in 80x24 terminal
How I built it
With python, ncurses, and various system utilities
Challenges I ran into
ncurses is a rather peculiar library in many ways, so interfacing with it presented some difficulties
Accomplishments that I'm proud of
The visualization is neat, information-dence, and easily readable
What I learned
More about ncurses, as well as the various system monitoring utilities in OS X
What's next for TopCurse
More statistics!
Built With
- ncurses
- python
- top

Log in or sign up for Devpost to join the conversation.