-
-
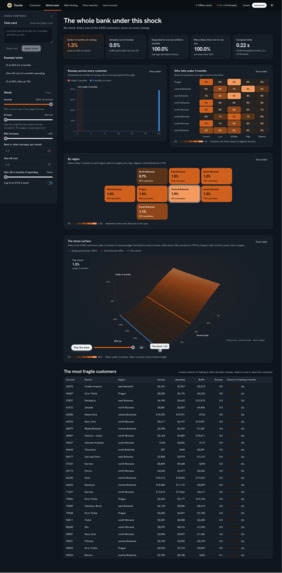
Whole Bank Tab (Advanced Mode)
-
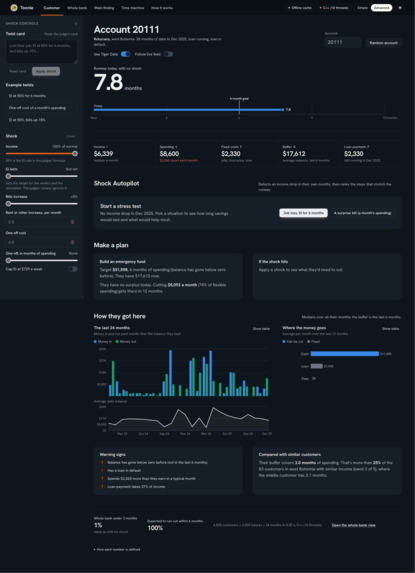
Customer Tab (Advanced Mode)
-
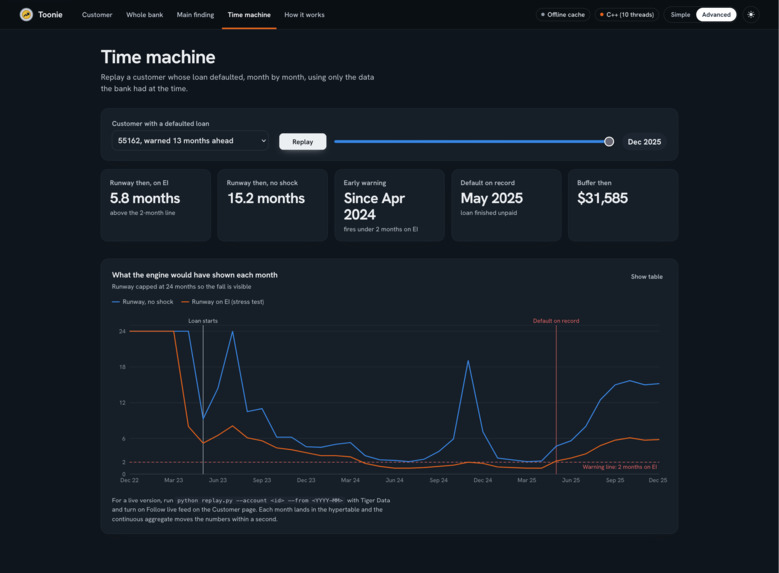
Time Machine Tab (Advanced Mode)
-
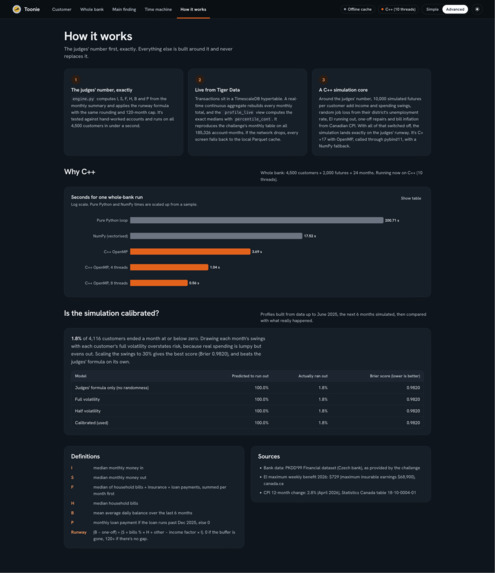
How It Works Tab (Advanced Mode)
-
Main Finding Tab (Advanced Mode)
Inspiration
Banks see every transaction a customer makes, but not the one thing that matters when something goes wrong: how long would this person last?
The Tangerine "Resilience Rewired" challenge gave us a precise way to ask that question. Take a customer's typical income, spending, fixed costs and savings, apply a shock such as a job loss on Employment Insurance, and compute their runway. We wanted to compute the judges' runway exactly for all 4,500 customers, and then answer the questions a single number can't: how likely are they to make it, and what would actually help?
What it does
Toonie gives every customer a runway, a chance of making it, a breaking point and a recovery plan.
The runway is the judges' formula, computed exactly. With typical income $$I$$, typical spending $$S$$, household bills $$H$$, and savings $$B$$, a shock sets an income factor $$f$$, a bills increase $$b$$, an extra monthly cost $$\Delta$$ and a one-off cost $$X$$:
$$\text{runway} = \min\left(\frac{B - X}{(S + bH + \Delta) - fI},\ 120\right)$$
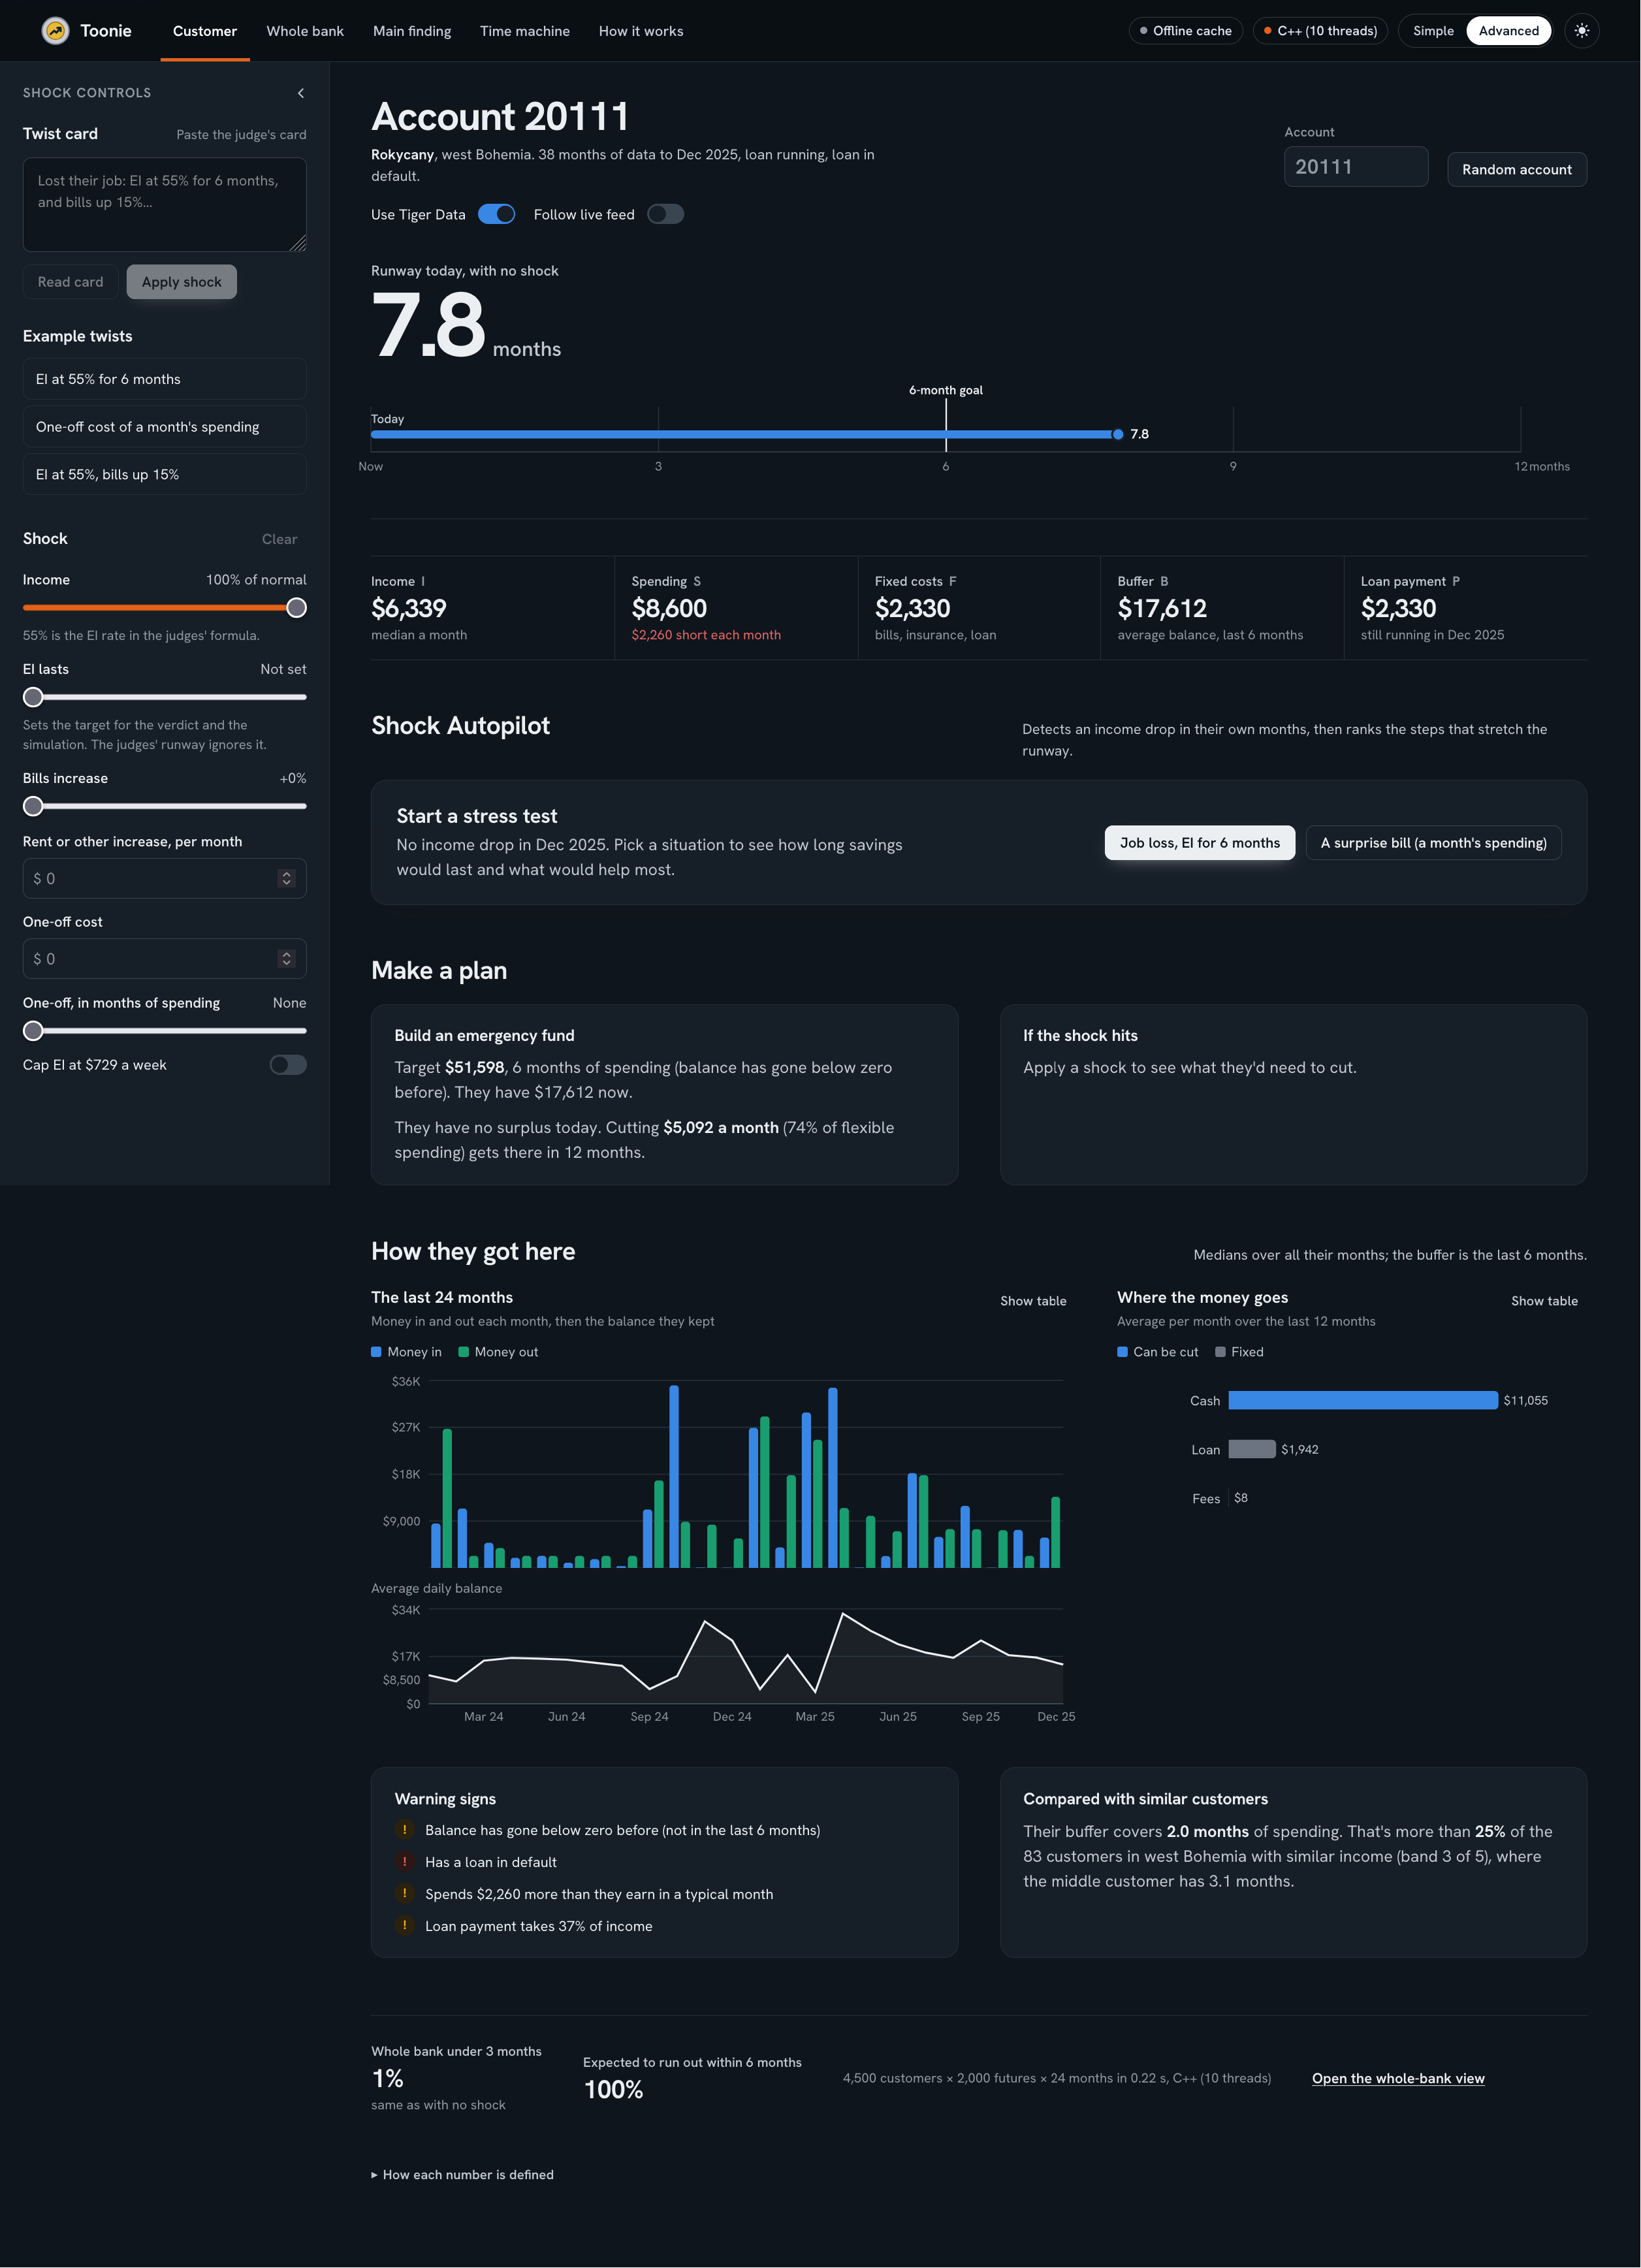
Account 20111 has $17,612 saved and spends $8,600 a month. Today their savings last 7.8 months. On EI at 55% of income, they last 3.4 months.
Everything else is built around that figure and never replaces it:
- Chance of making it: a simulation of 10,000 possible futures per customer.
- Breaking point: the formula run backwards, showing how much income loss or one-off cost a customer can absorb.
- Shock Autopilot: it spots an income drop in a customer's latest month and ranks real spending cuts from their own history by the months each one adds.
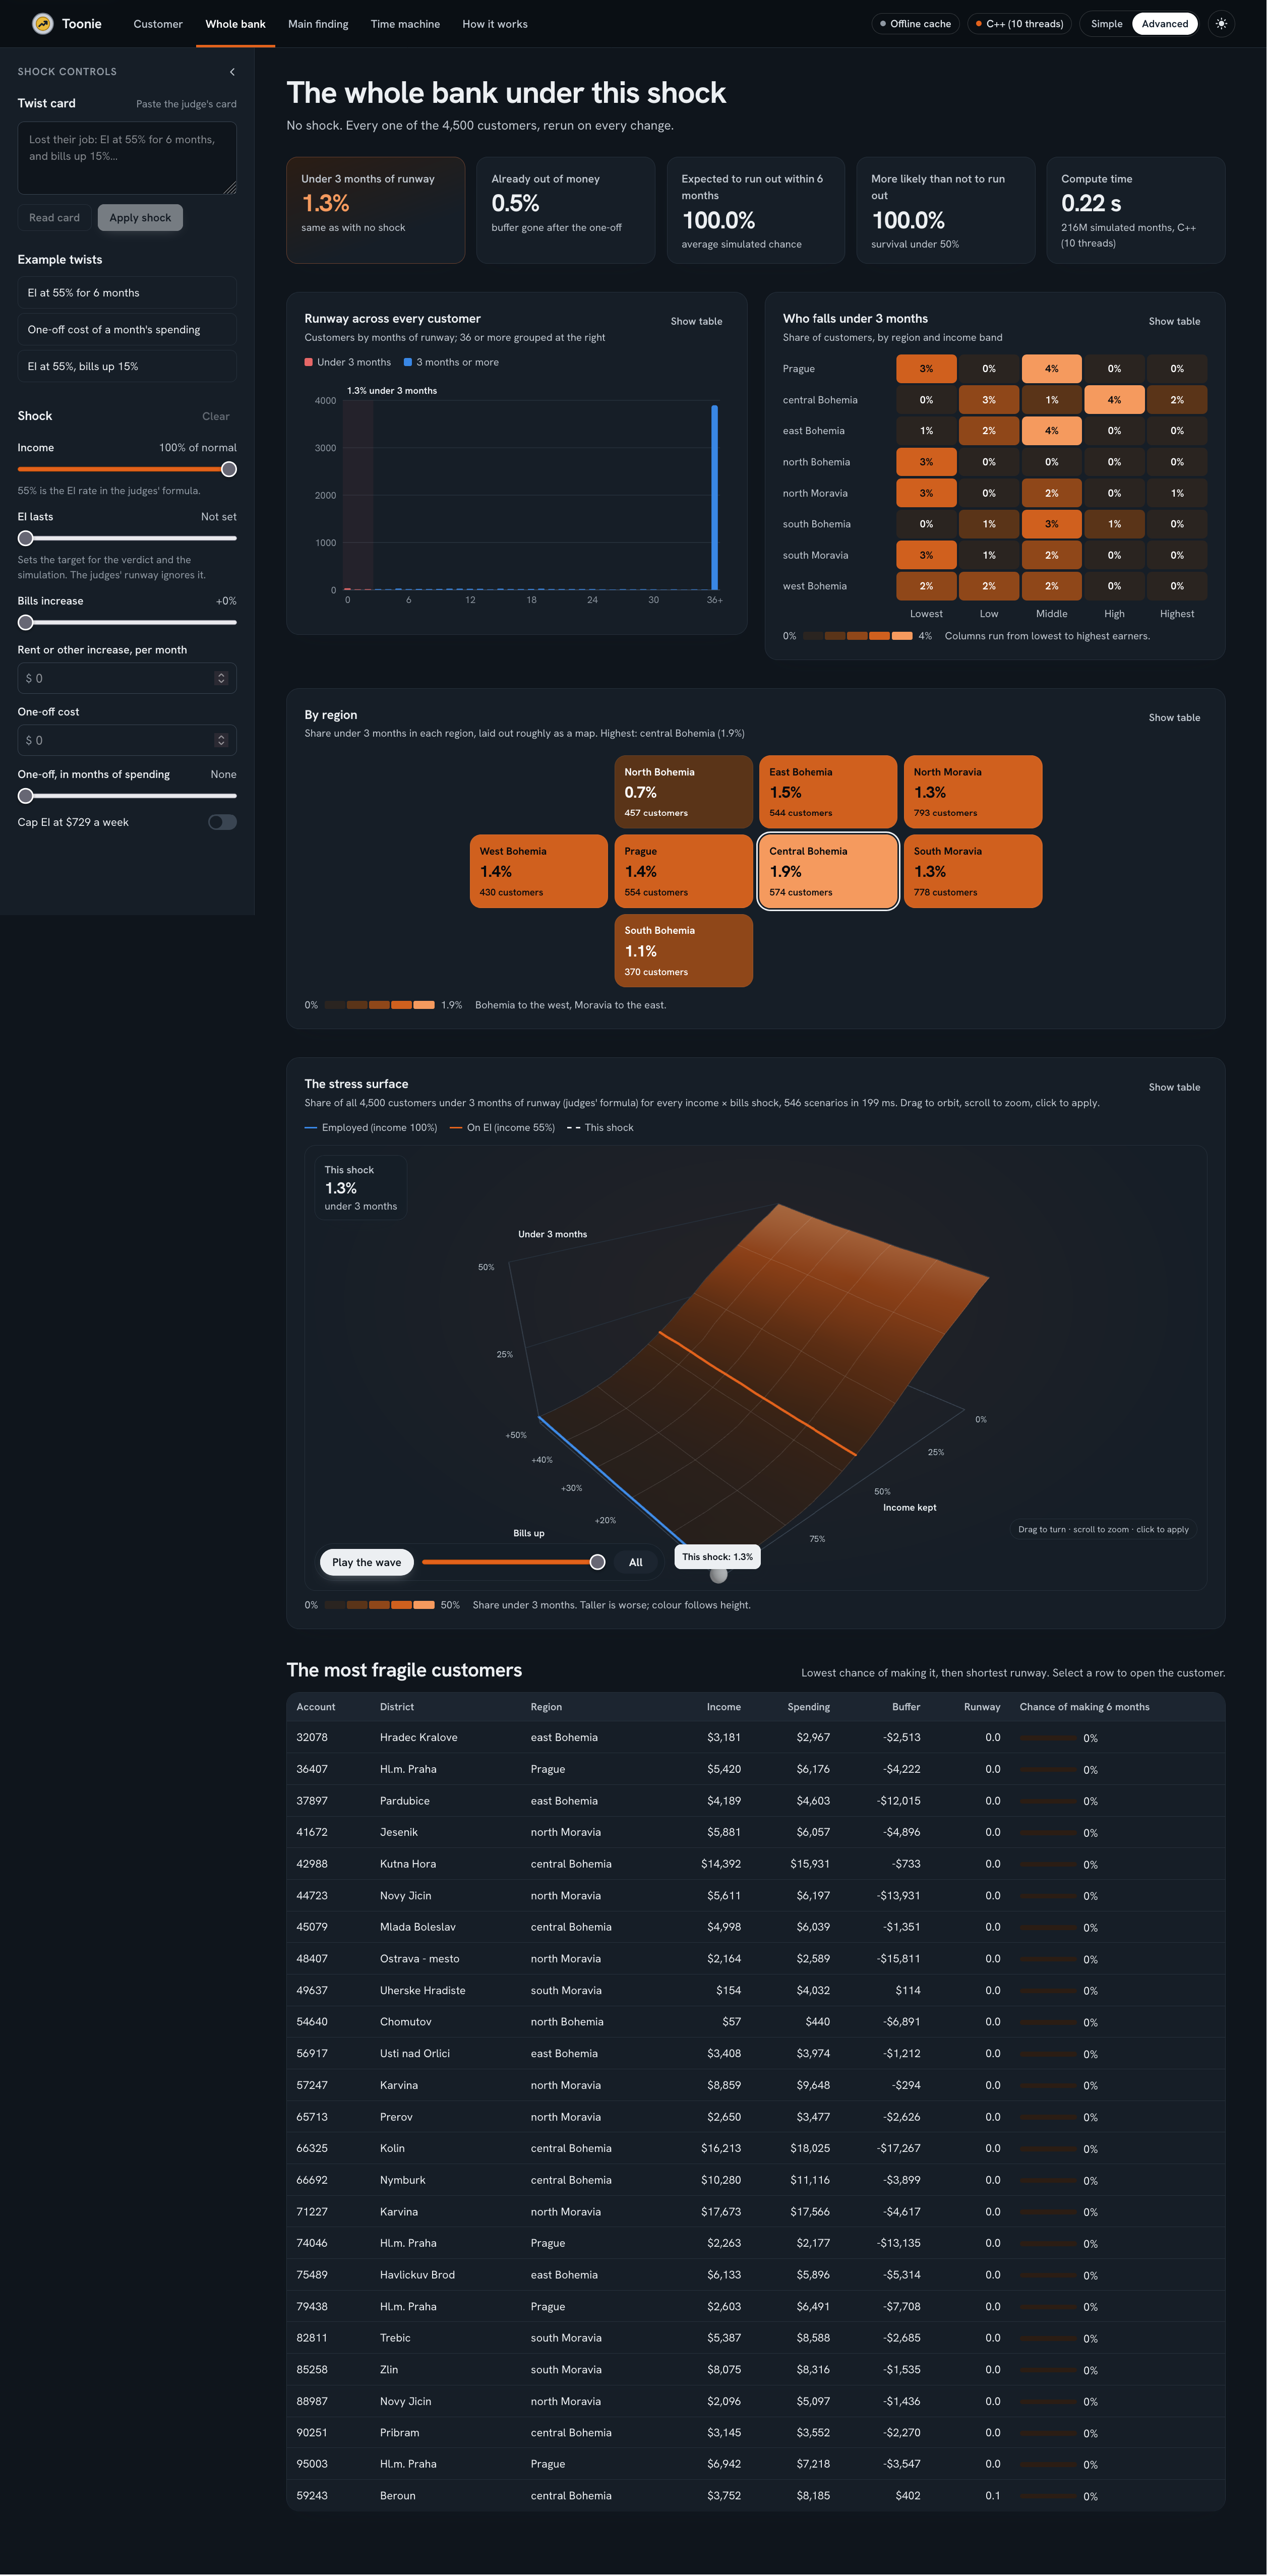
- Whole-bank stress test: every customer under the same shock, recomputed in about 0.6 seconds.
The finding
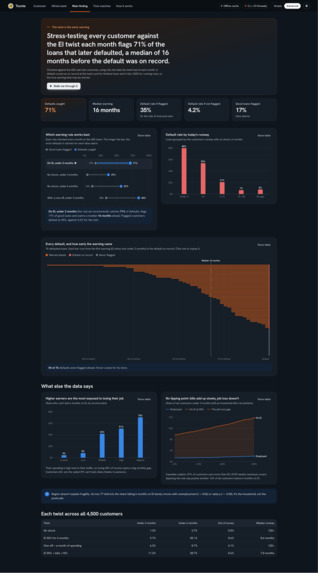
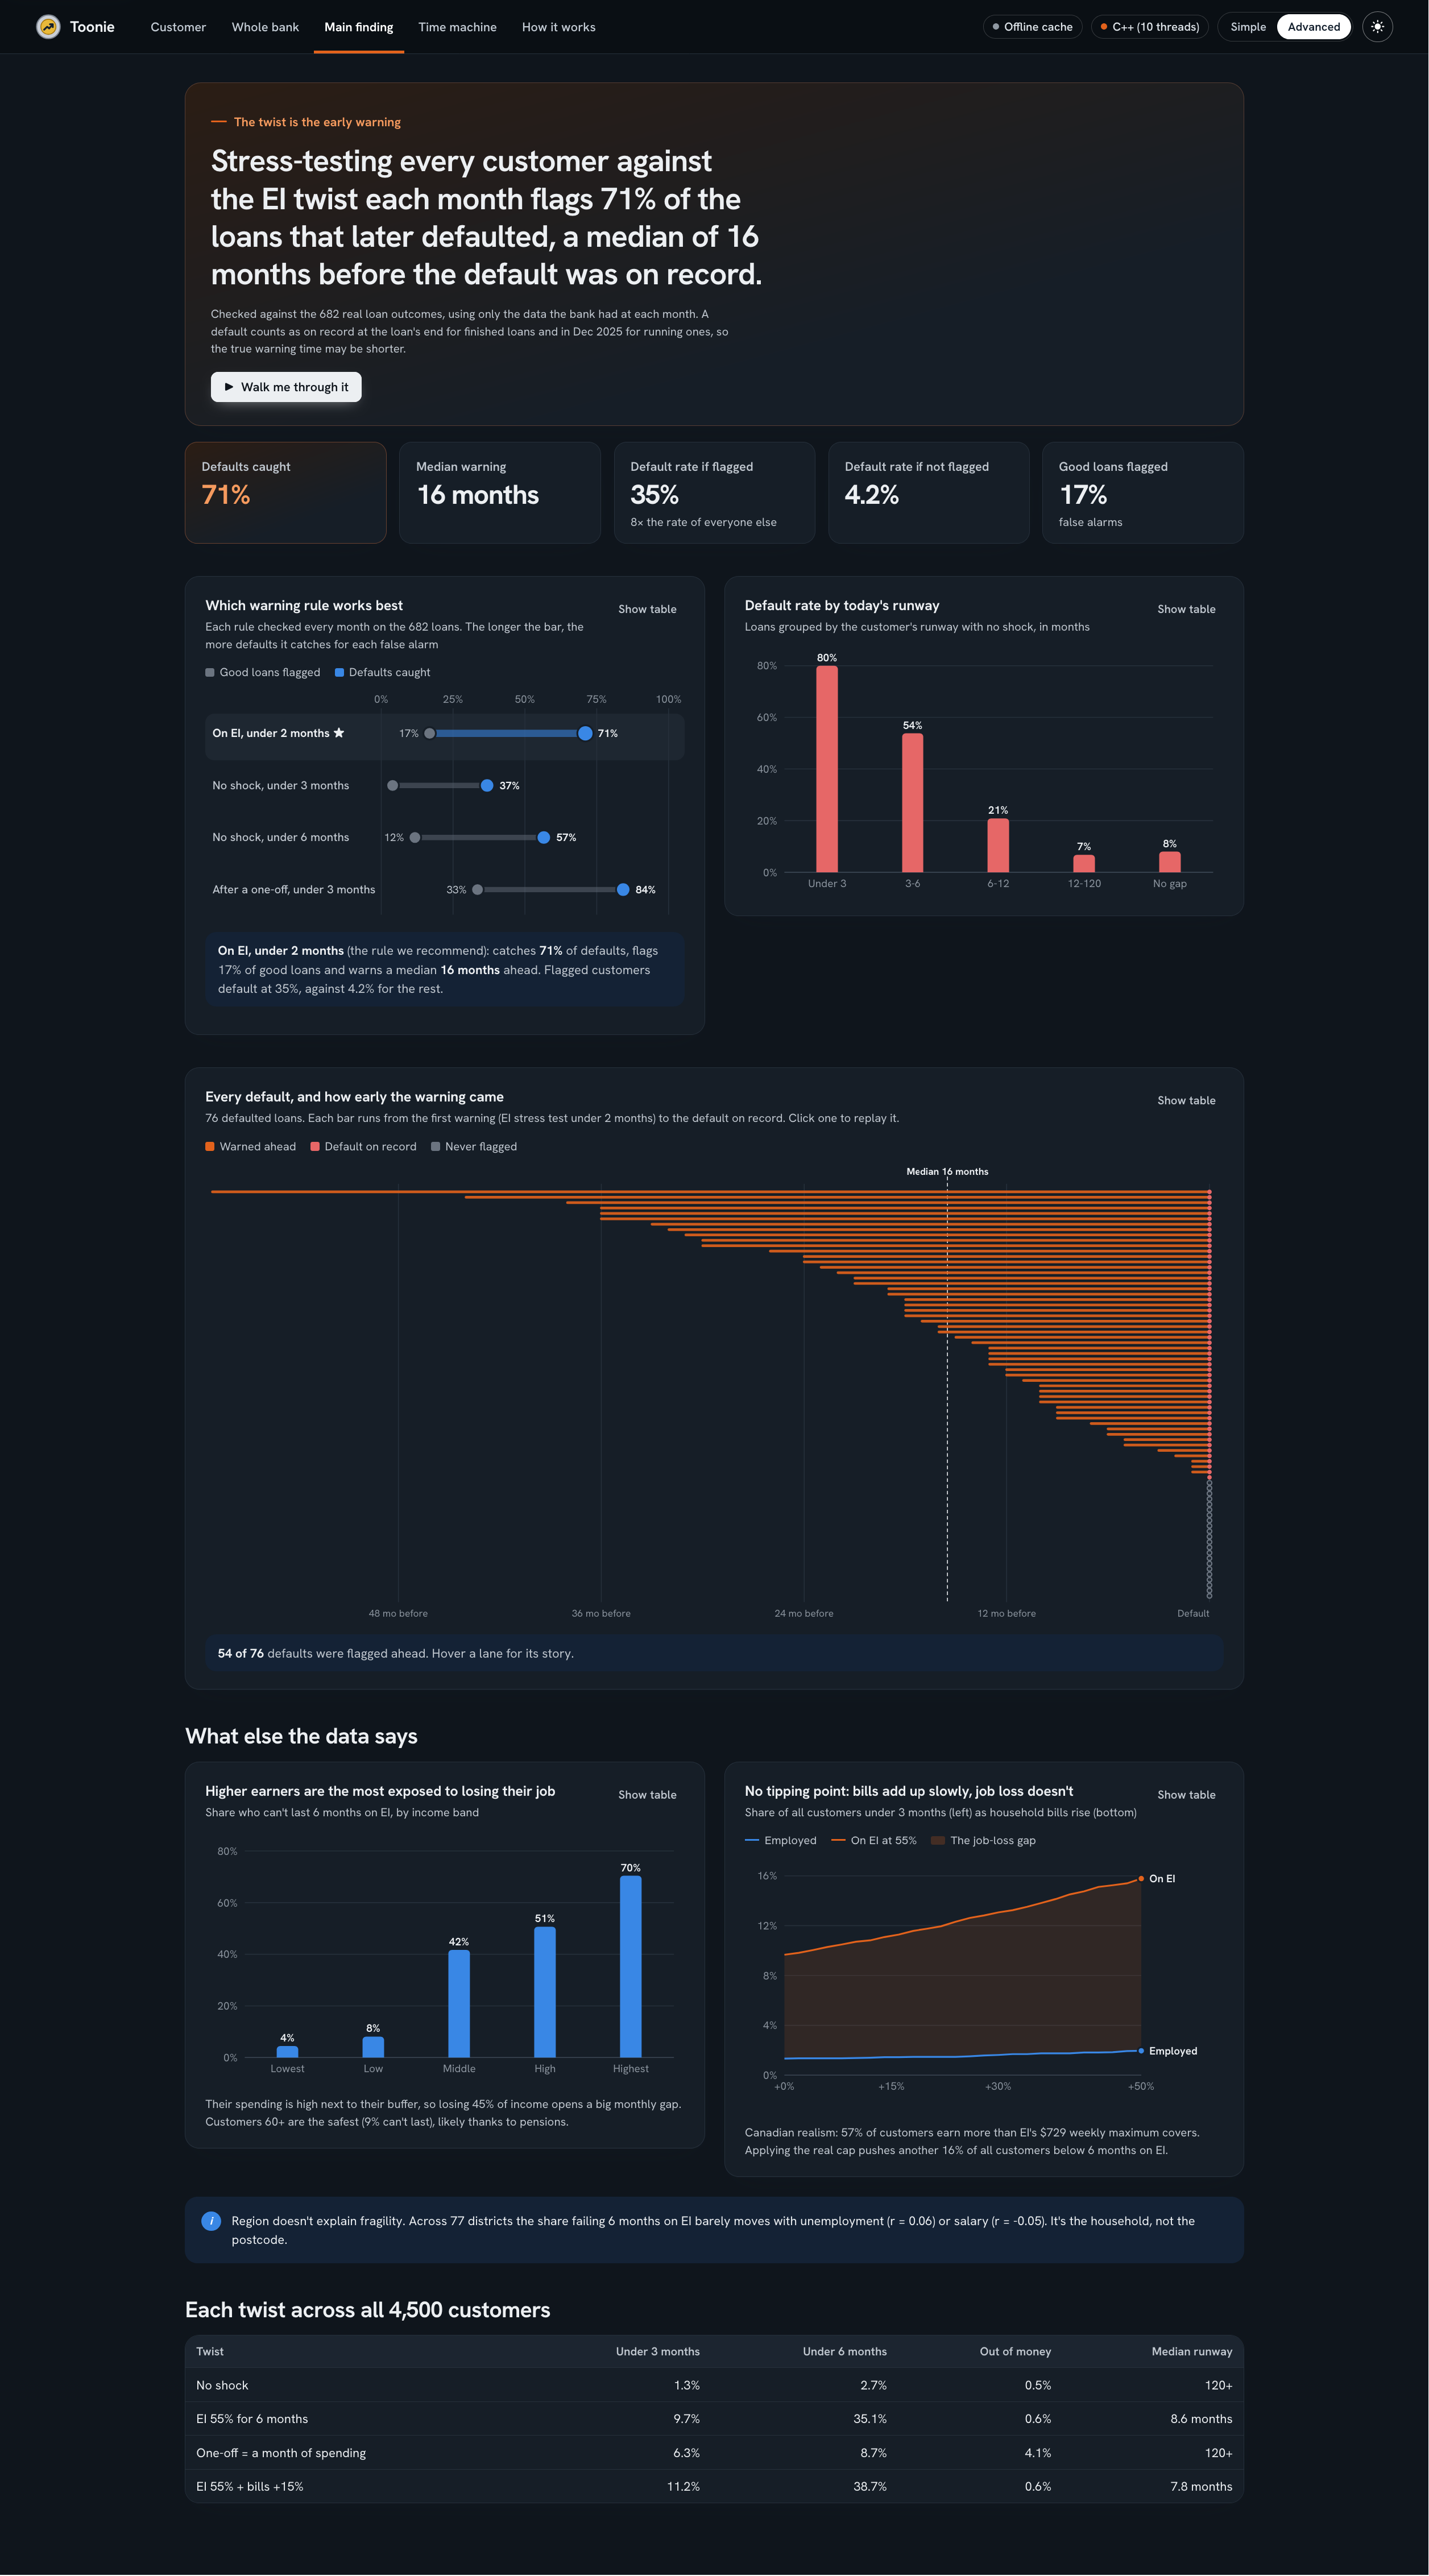
The judges' EI twist turned out to be an early-warning signal, not just a what-if.
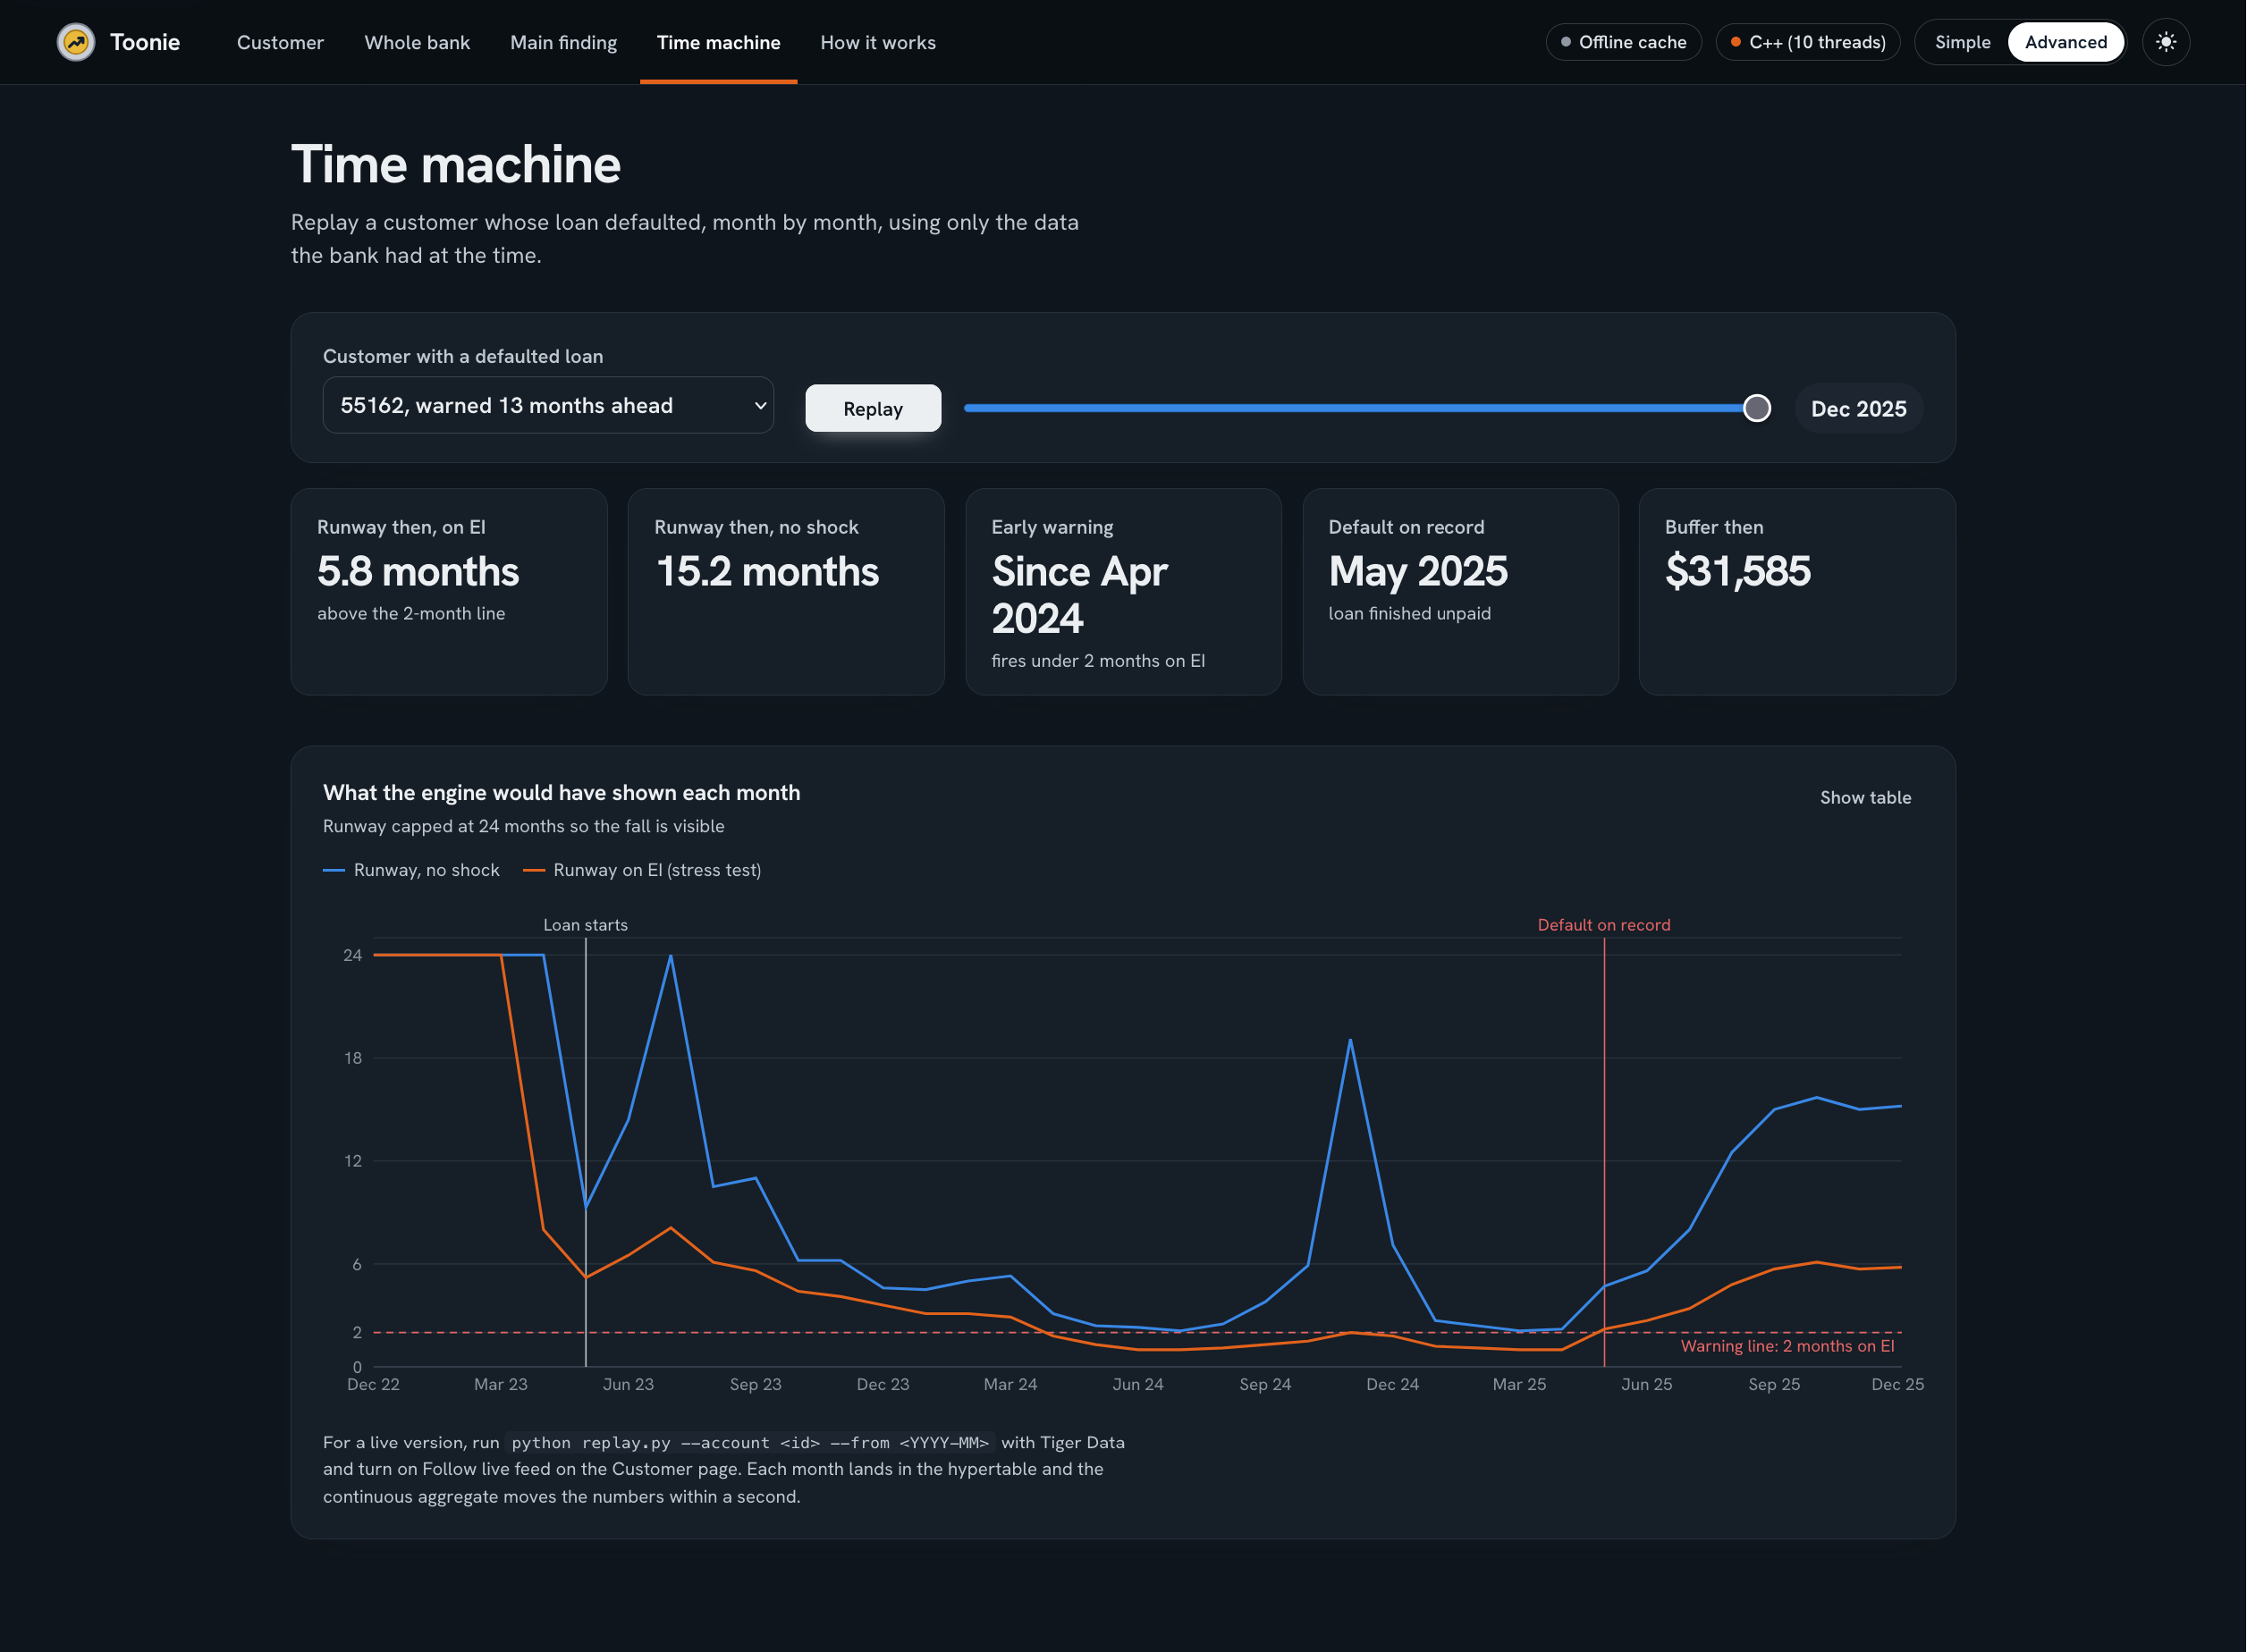
We replayed every loan customer month by month, using only the data the bank had at the time, and flagged a customer the first time their runway on EI fell below 2 months:
| Defaults caught | 71% of the 76 loans that defaulted |
| Warning time | median 15.5 months before the default is on record |
| Default rate when flagged | 34.6% |
| Default rate when not flagged | 4.2% |
Flagged customers defaulted about 8 times as often. The same test on today's runway with no shock caught only 37% of defaults at a 3-month line, so the twist is what makes the signal work.
How we built it
- Engine (Python, pandas): the six profile numbers (I, S, F, H, B, P) are built from
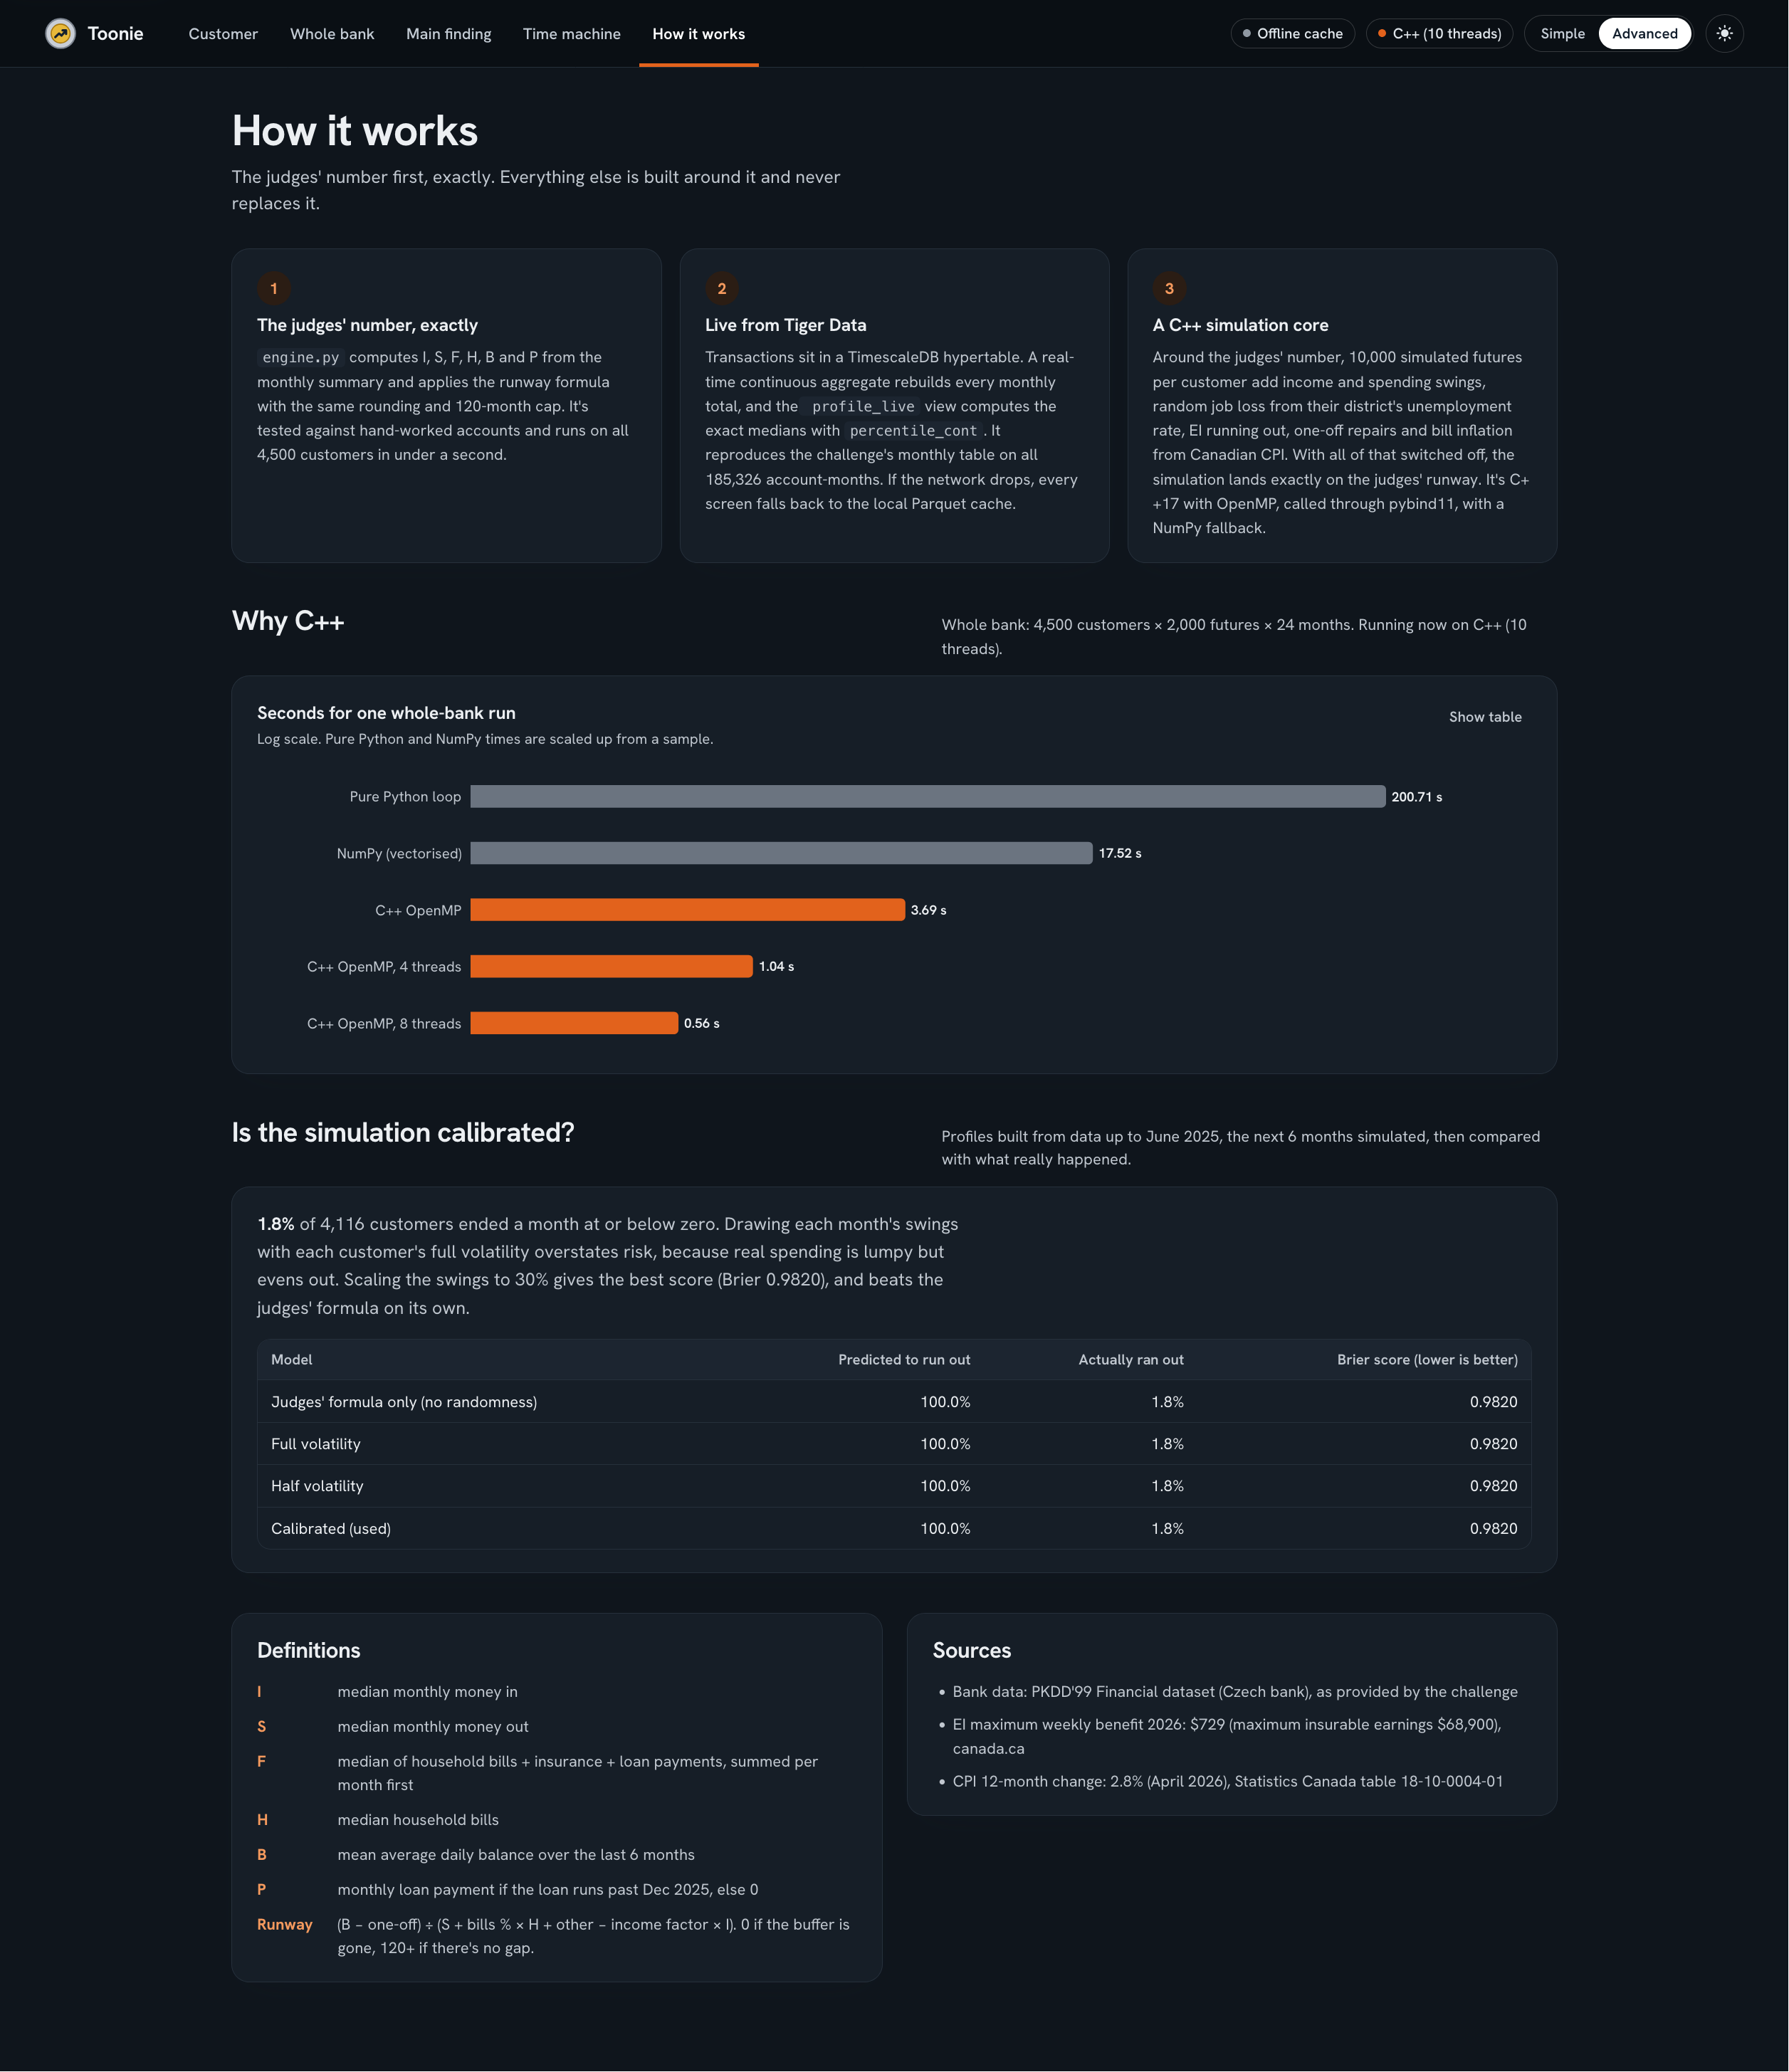
monthly_summary.csv, and the judges' runway is implemented exactly inengine.runway(). - Simulation (C++ with OpenMP, NumPy reference): each future runs 24 months with random income and spending swings, a monthly job-loss chance derived from the customer's district unemployment rate, EI ending, surprise repairs and 2.8% CPI. The whole-bank view is about 216 million simulated months per twist, which the C++ version runs about 357x faster than Python, so it can rerun on every slider move.
- Live data (Tiger Data): a SQL view recomputes every profile with exact medians (
percentile_cont) as transactions arrive. It matches the Python engine on every customer, and the app falls back to an offline cache when Wi-Fi drops. - App (Streamlit): you can paste a twist card, read it, apply it, and see the runway, chance, breaking point, plan and whole-bank impact on one screen.
- Assistant: every number in a reply is checked against what the engine actually produced, so it never states a figure the engine didn't compute.
Challenges we ran into
- Ambiguous definitions. "Median of bills + insurance + loan payments" can mean two things, and "still running at the end of 2025" can too. We chose the readings that match real data (the first changes F for just 26 customers, and the loan rule agrees with the status codes on all 682 loans), and documented that neither changes any runway.
- Making the simulation agree with the formula. A fancy model that contradicts the judges' number is worthless. With every random part switched off, our simulation reproduces the judges' runway to within 0.05 months for every customer, on both the C++ and NumPy versions.
- Calibrating the randomness. Full-size swings overshot badly. We built profiles from data up to June 2025, simulated the next six months and compared with reality (1.8% of customers actually hit zero). Full-size swings predicted 12.6% (Brier score 0.0451), the plain formula 2.7% (0.0284). Swings at 30% of each customer's own volatility predicted 4.8% and scored best (0.0228).
- Avoiding hindsight. The early-warning test rebuilds every profile month by month using only data available at that point. The dataset doesn't date the default itself, so we treat it as on record when a finished loan ended (or in December 2025 for loans still running), which means the true warning time may be shorter.
- Being honest about EI. Real EI pays at most $729 a week, so the twist is generous. With the cap on, another 16% of all customers fall below 6 months.
What we learned
- A simple, exact formula is a better foundation than a complex model. Everything we added is checked against the judges' number.
- Calibrating against what really happened matters more than model sophistication, because our best-scoring simulation was the one with smaller swings.
- The most useful insight came from a stress test rather than a prediction: the twist reveals fragility that today's balance hides. Under 3 months of runway is 1.3% of customers today, but 9.7% on EI for 6 months and 11.2% with bills up 15% as well.
- Speed changes how people use a tool. When the whole-bank view reruns in under a second, a banker can explore shocks instead of waiting on them.
What's next
Autopilot already flags 350 customers whose latest month's income is under 60% of normal. The next step is putting a priced recovery plan, built from each customer's own spending, in front of them the moment the drop appears.
