-
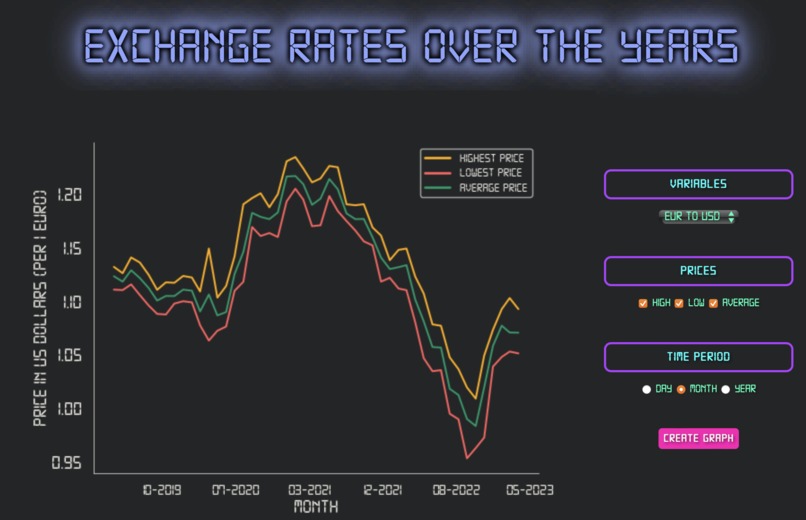
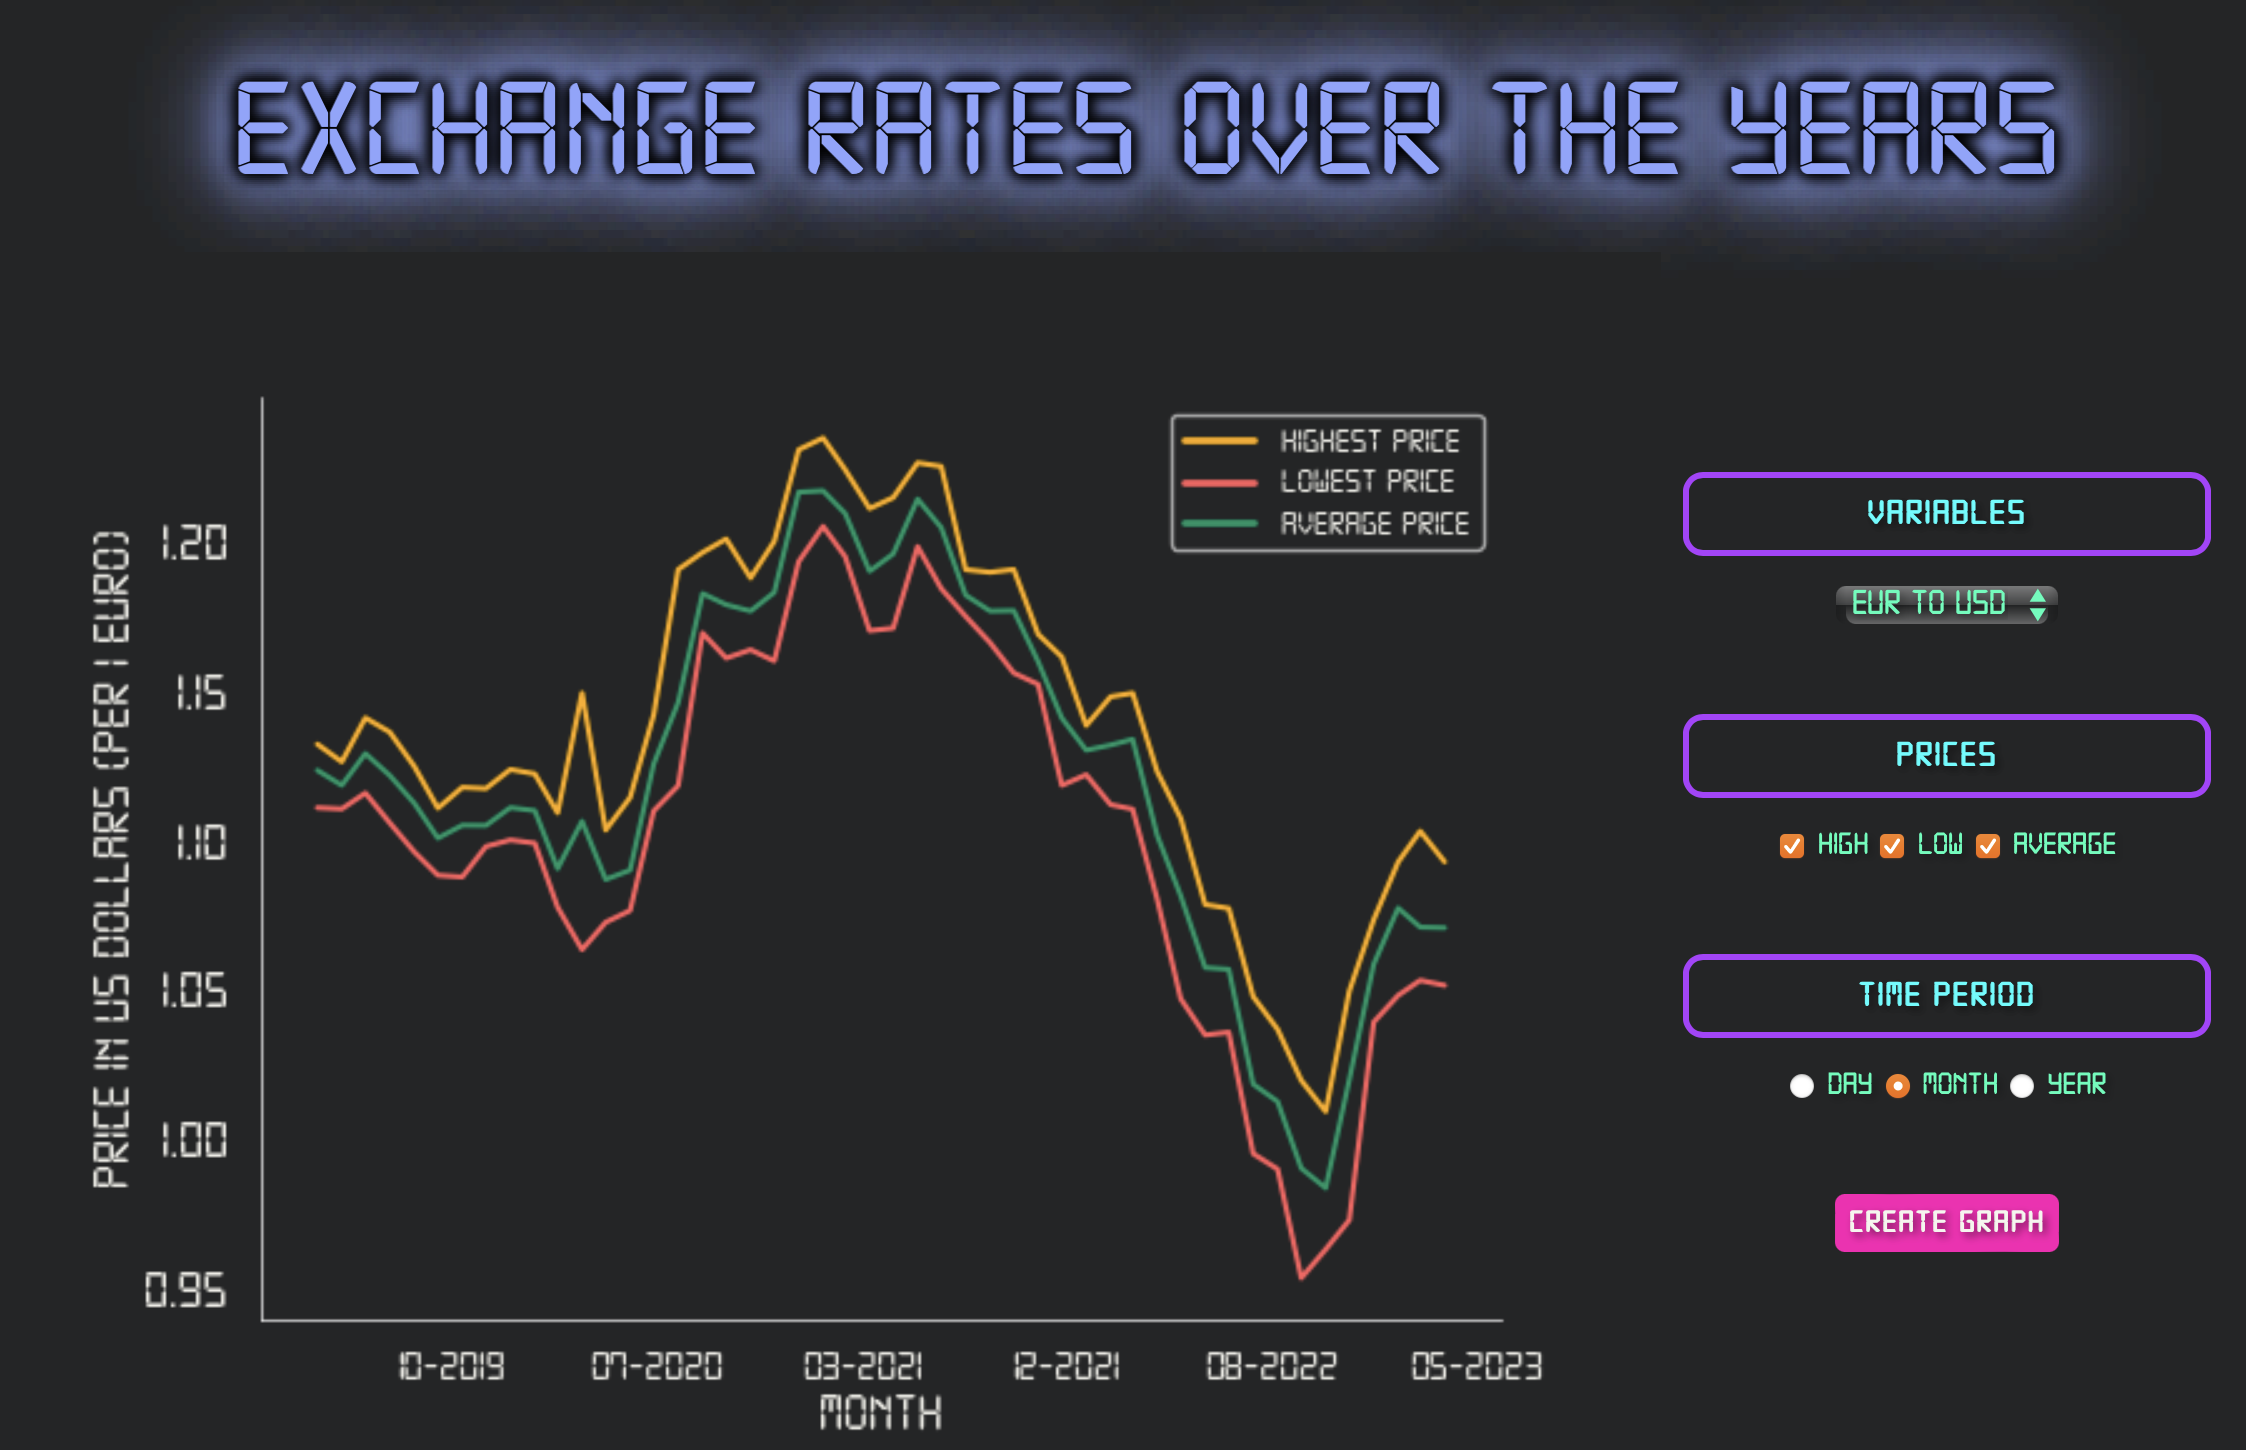
Example of a produced graph
Inspiration
To build an analysis/visualisation tool that is easy to use and gives them an overview of the exchange rates over the past years.
What it does
The user can choose between the 7 different exchange rates that they want to analyse. They can select one or more price points (High, Low and Average) as well as the time period (Day, Month, Year).
How we built it
The solution mainly followed client-server architecture and was divided into a backend and frontend. The frontend was developed using the HTML/CSS/JavaScript stack and is dynamically updated instead of full page re-renders. The backend was written using python and followed a microservice architecture. It was further subdivided into two parts, the data visualisation part to produce graphs (using matplotlib / Seaborn) and the general backend containing the endpoints. The frontend accesses data from the backend using fetch requests, which decreases the load on the server.
What's next for Tools of the Trade ‘BidFX’ / Team AbsentCompetentGoose
With more time a filter feature could be added in which a single day / month or year could be analysed/visualised more clearly. Furthermore live data could be added to provide the users with the newest information

Log in or sign up for Devpost to join the conversation.