-
-

Too Hot to Handle, Rice Datathon: Chevron Challenge
-
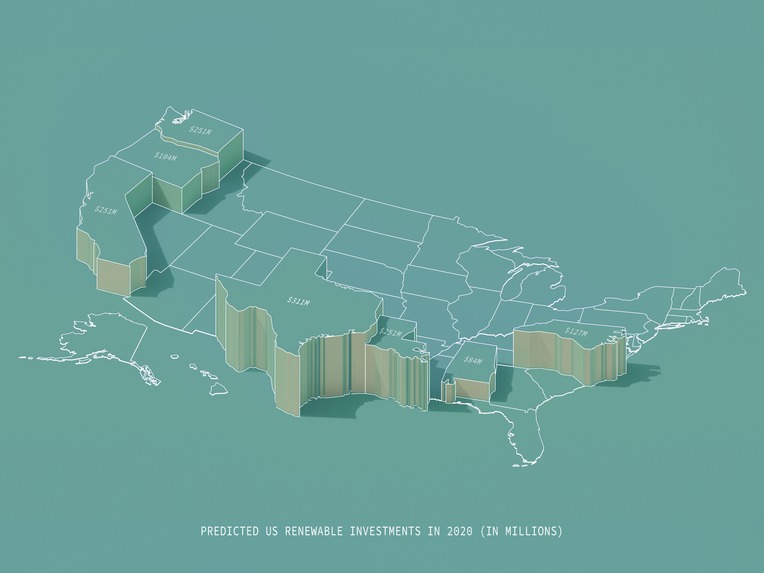
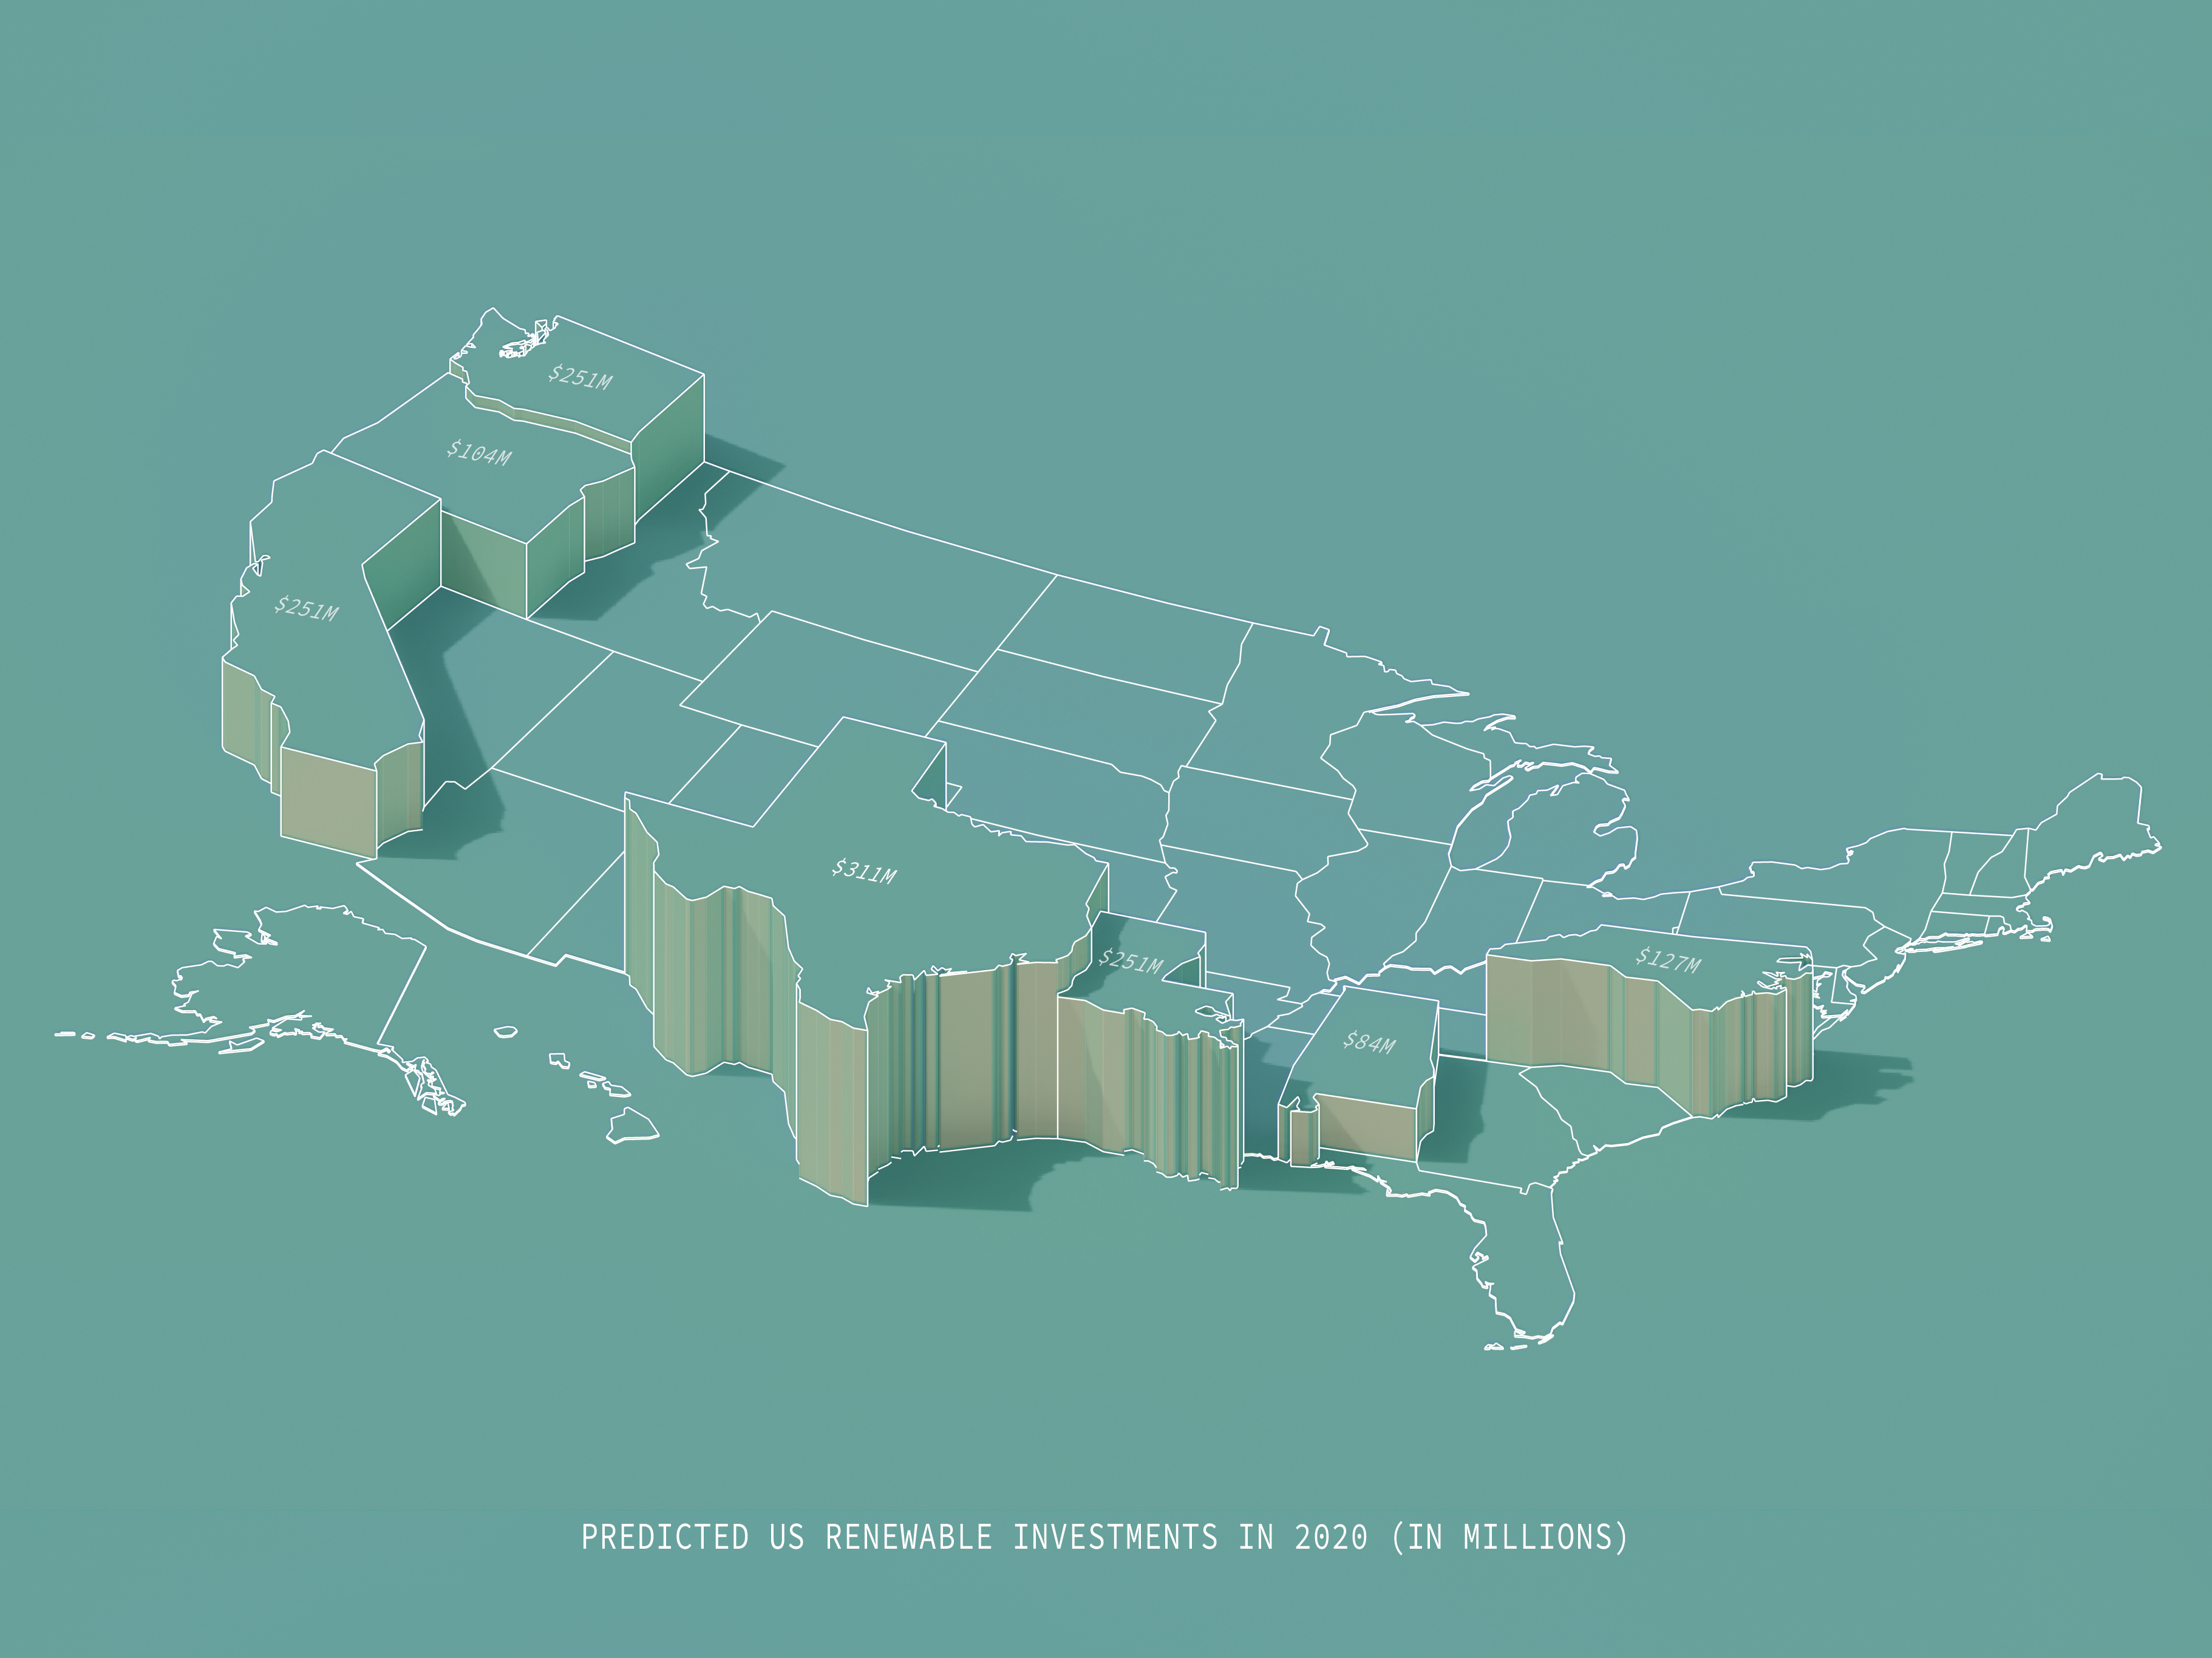
2020 Projected Renewable Energy Investments by State
-
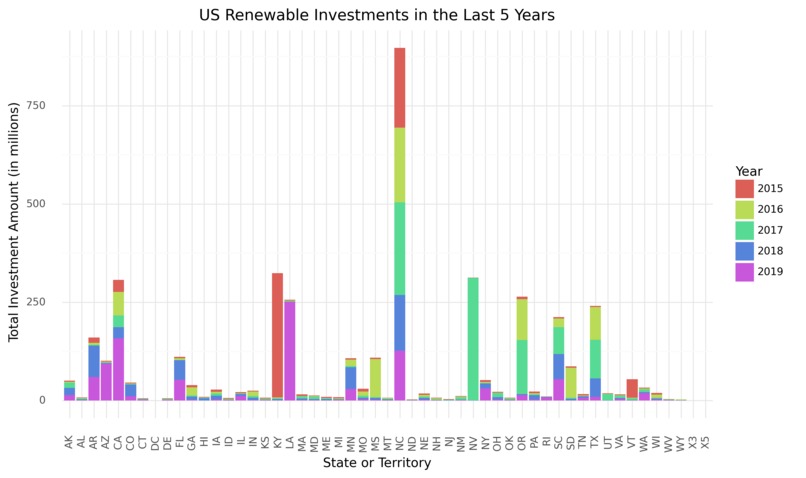
US Renewable Energy Investments 2015-19
-
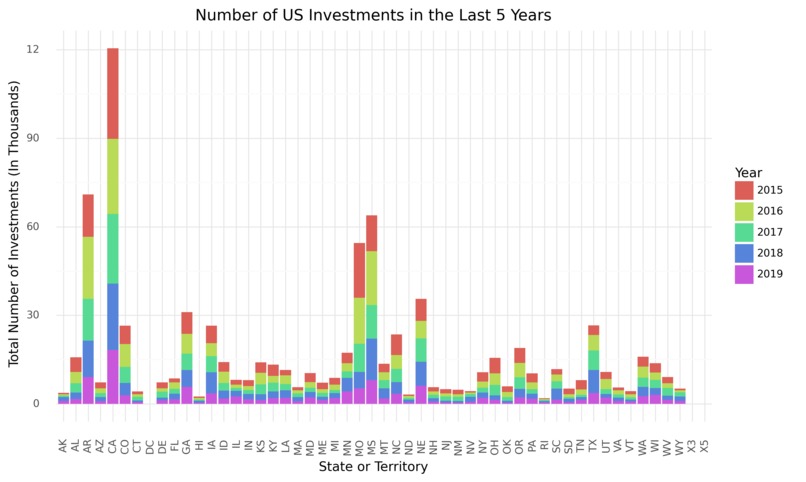
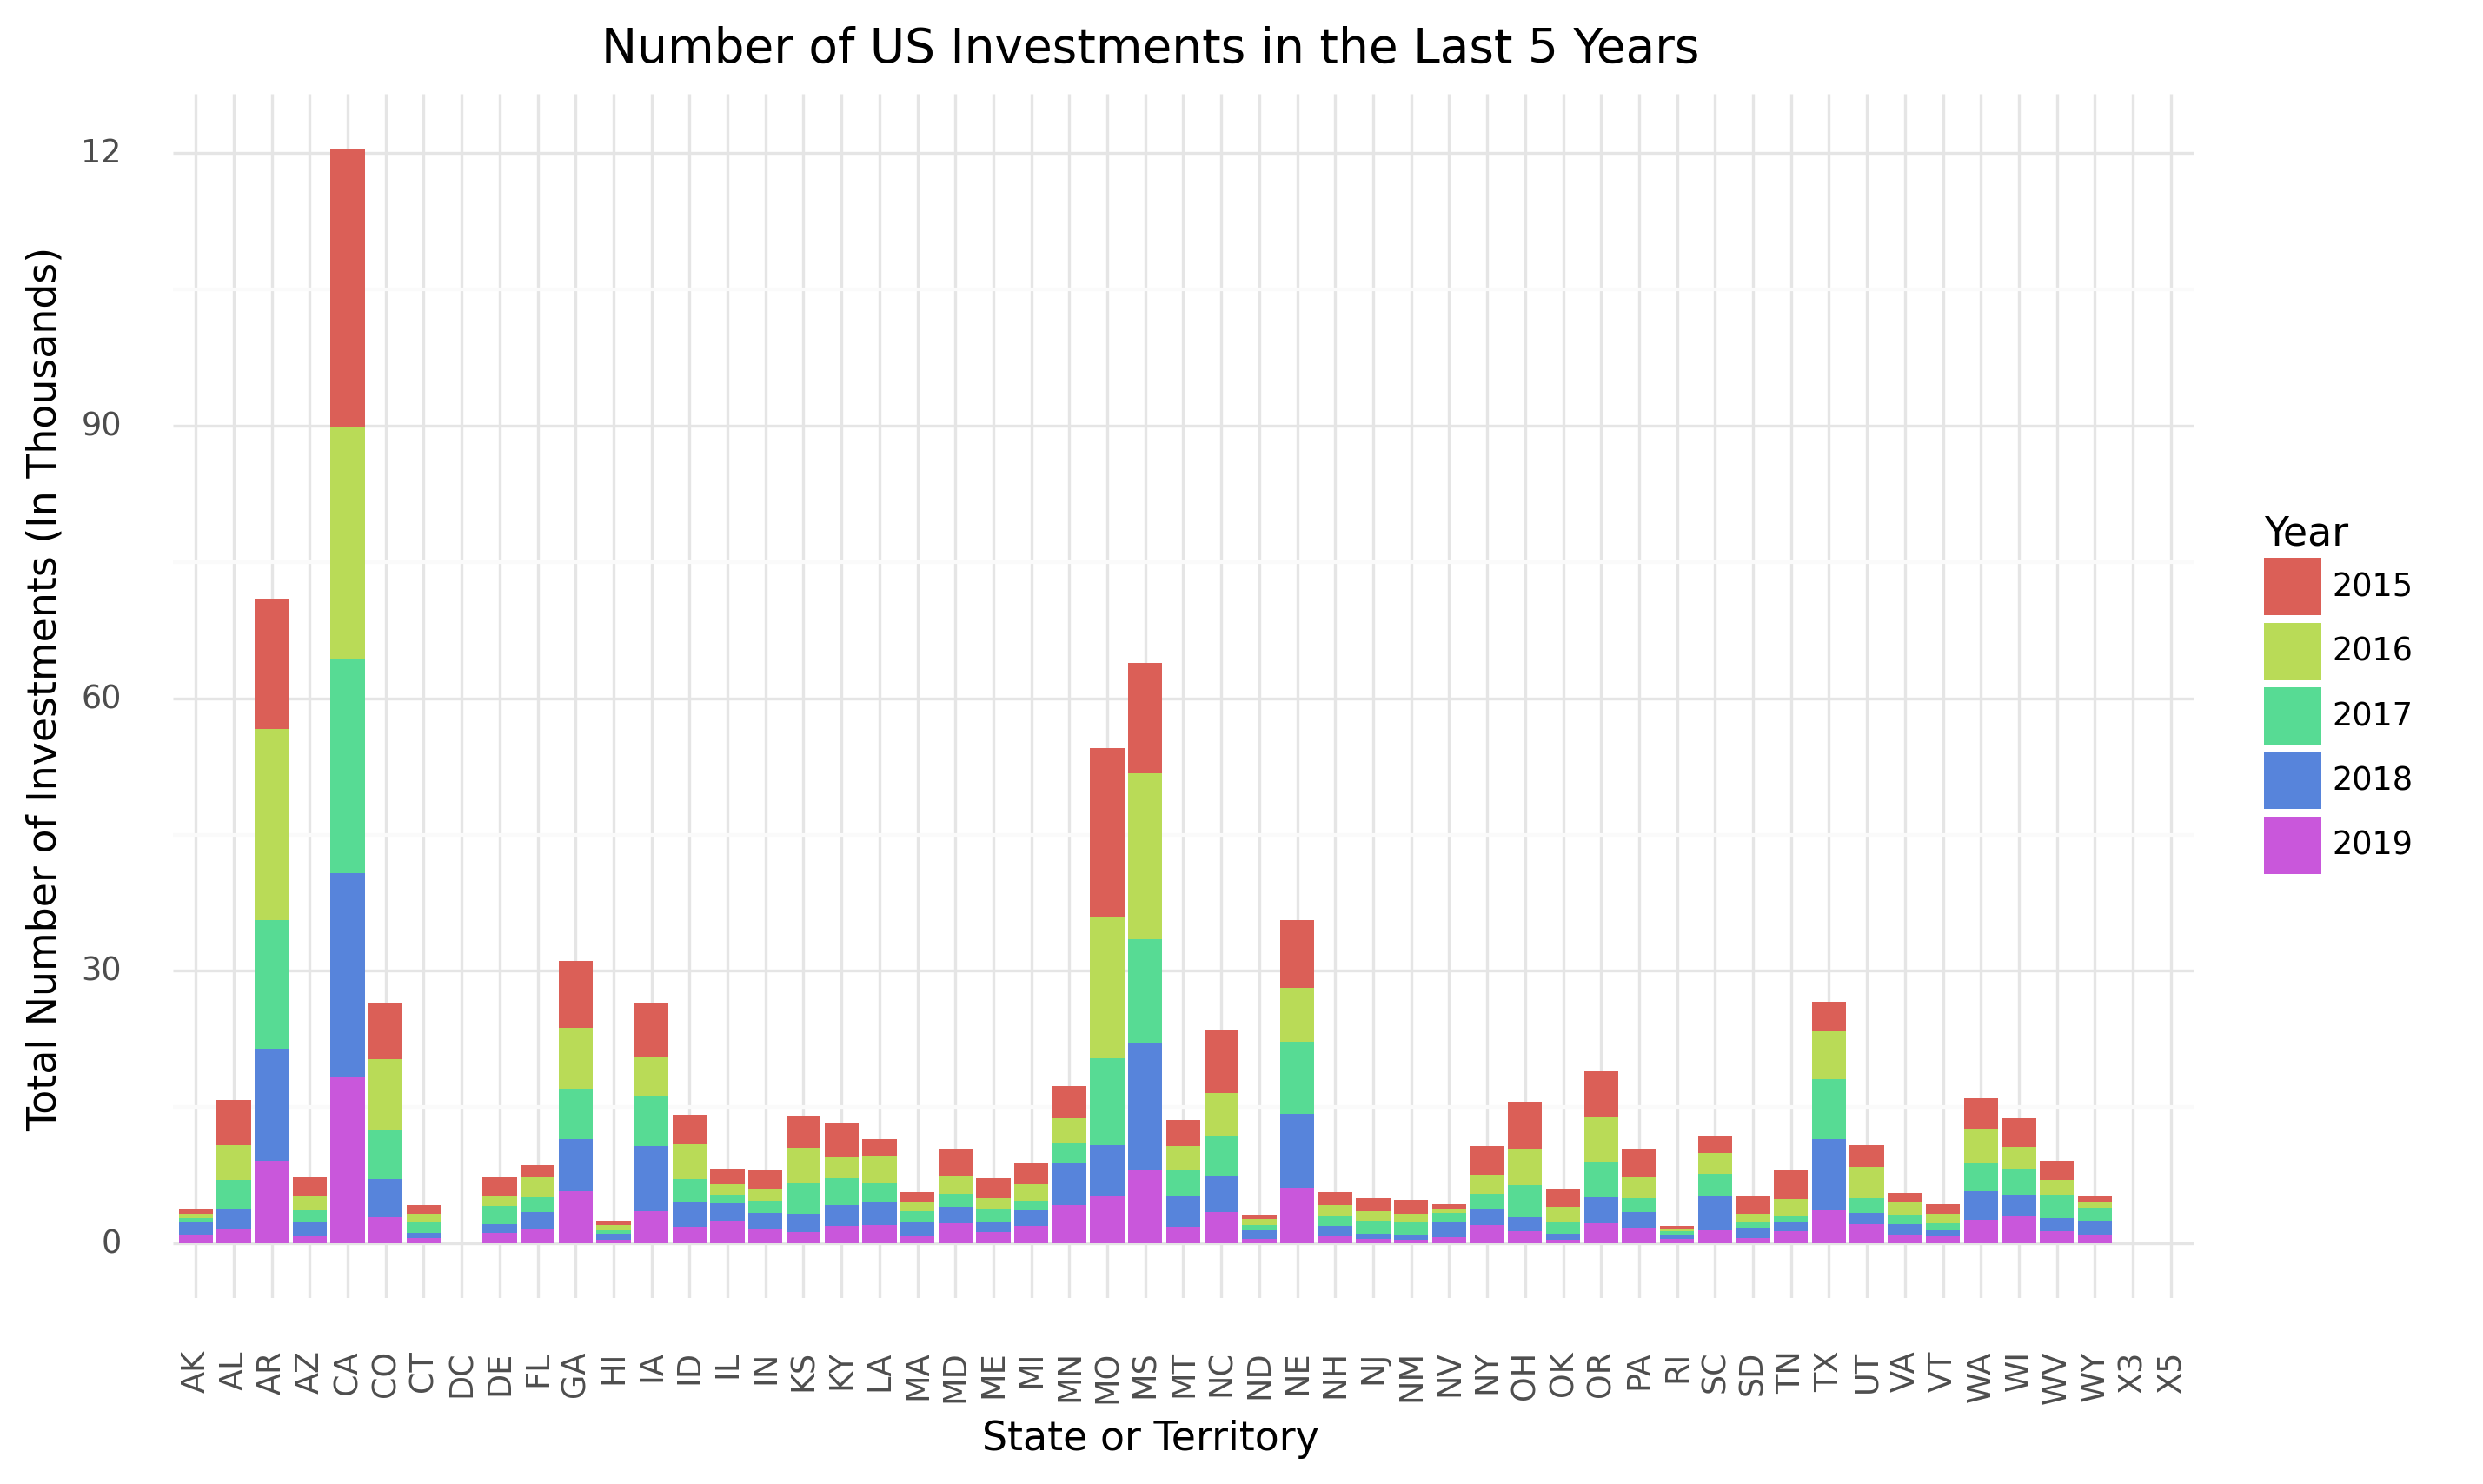
Number of US Renewable Energy Investments 2015-19
-
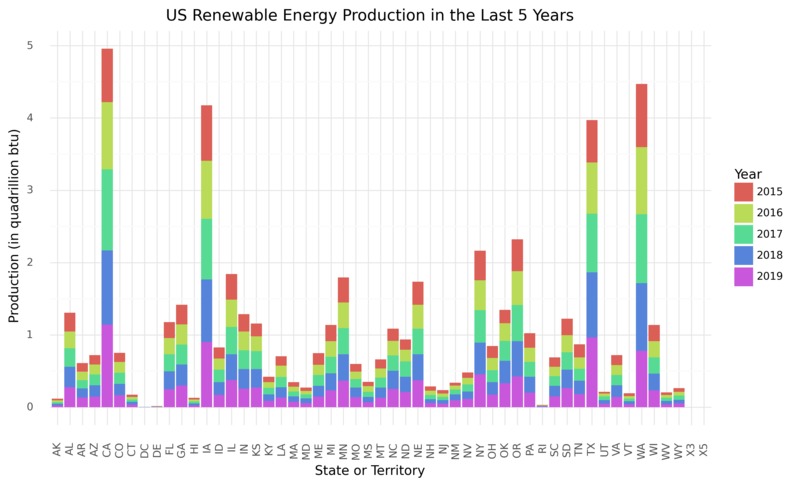
US Renewable Energy Production 2015-19
-
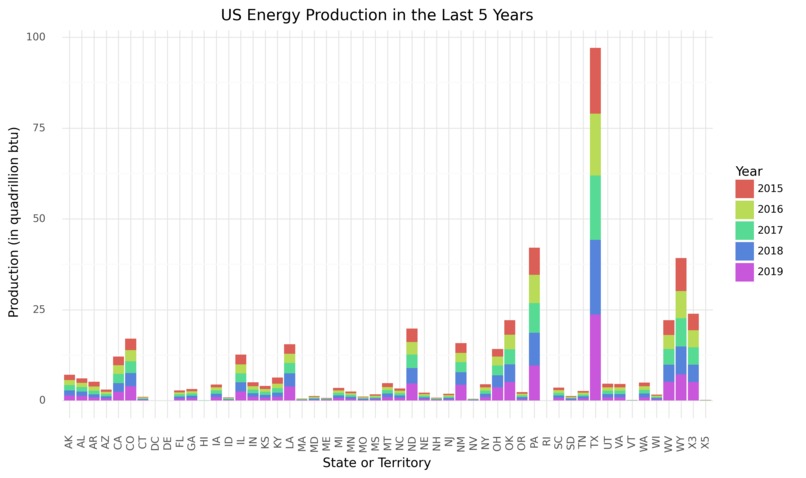
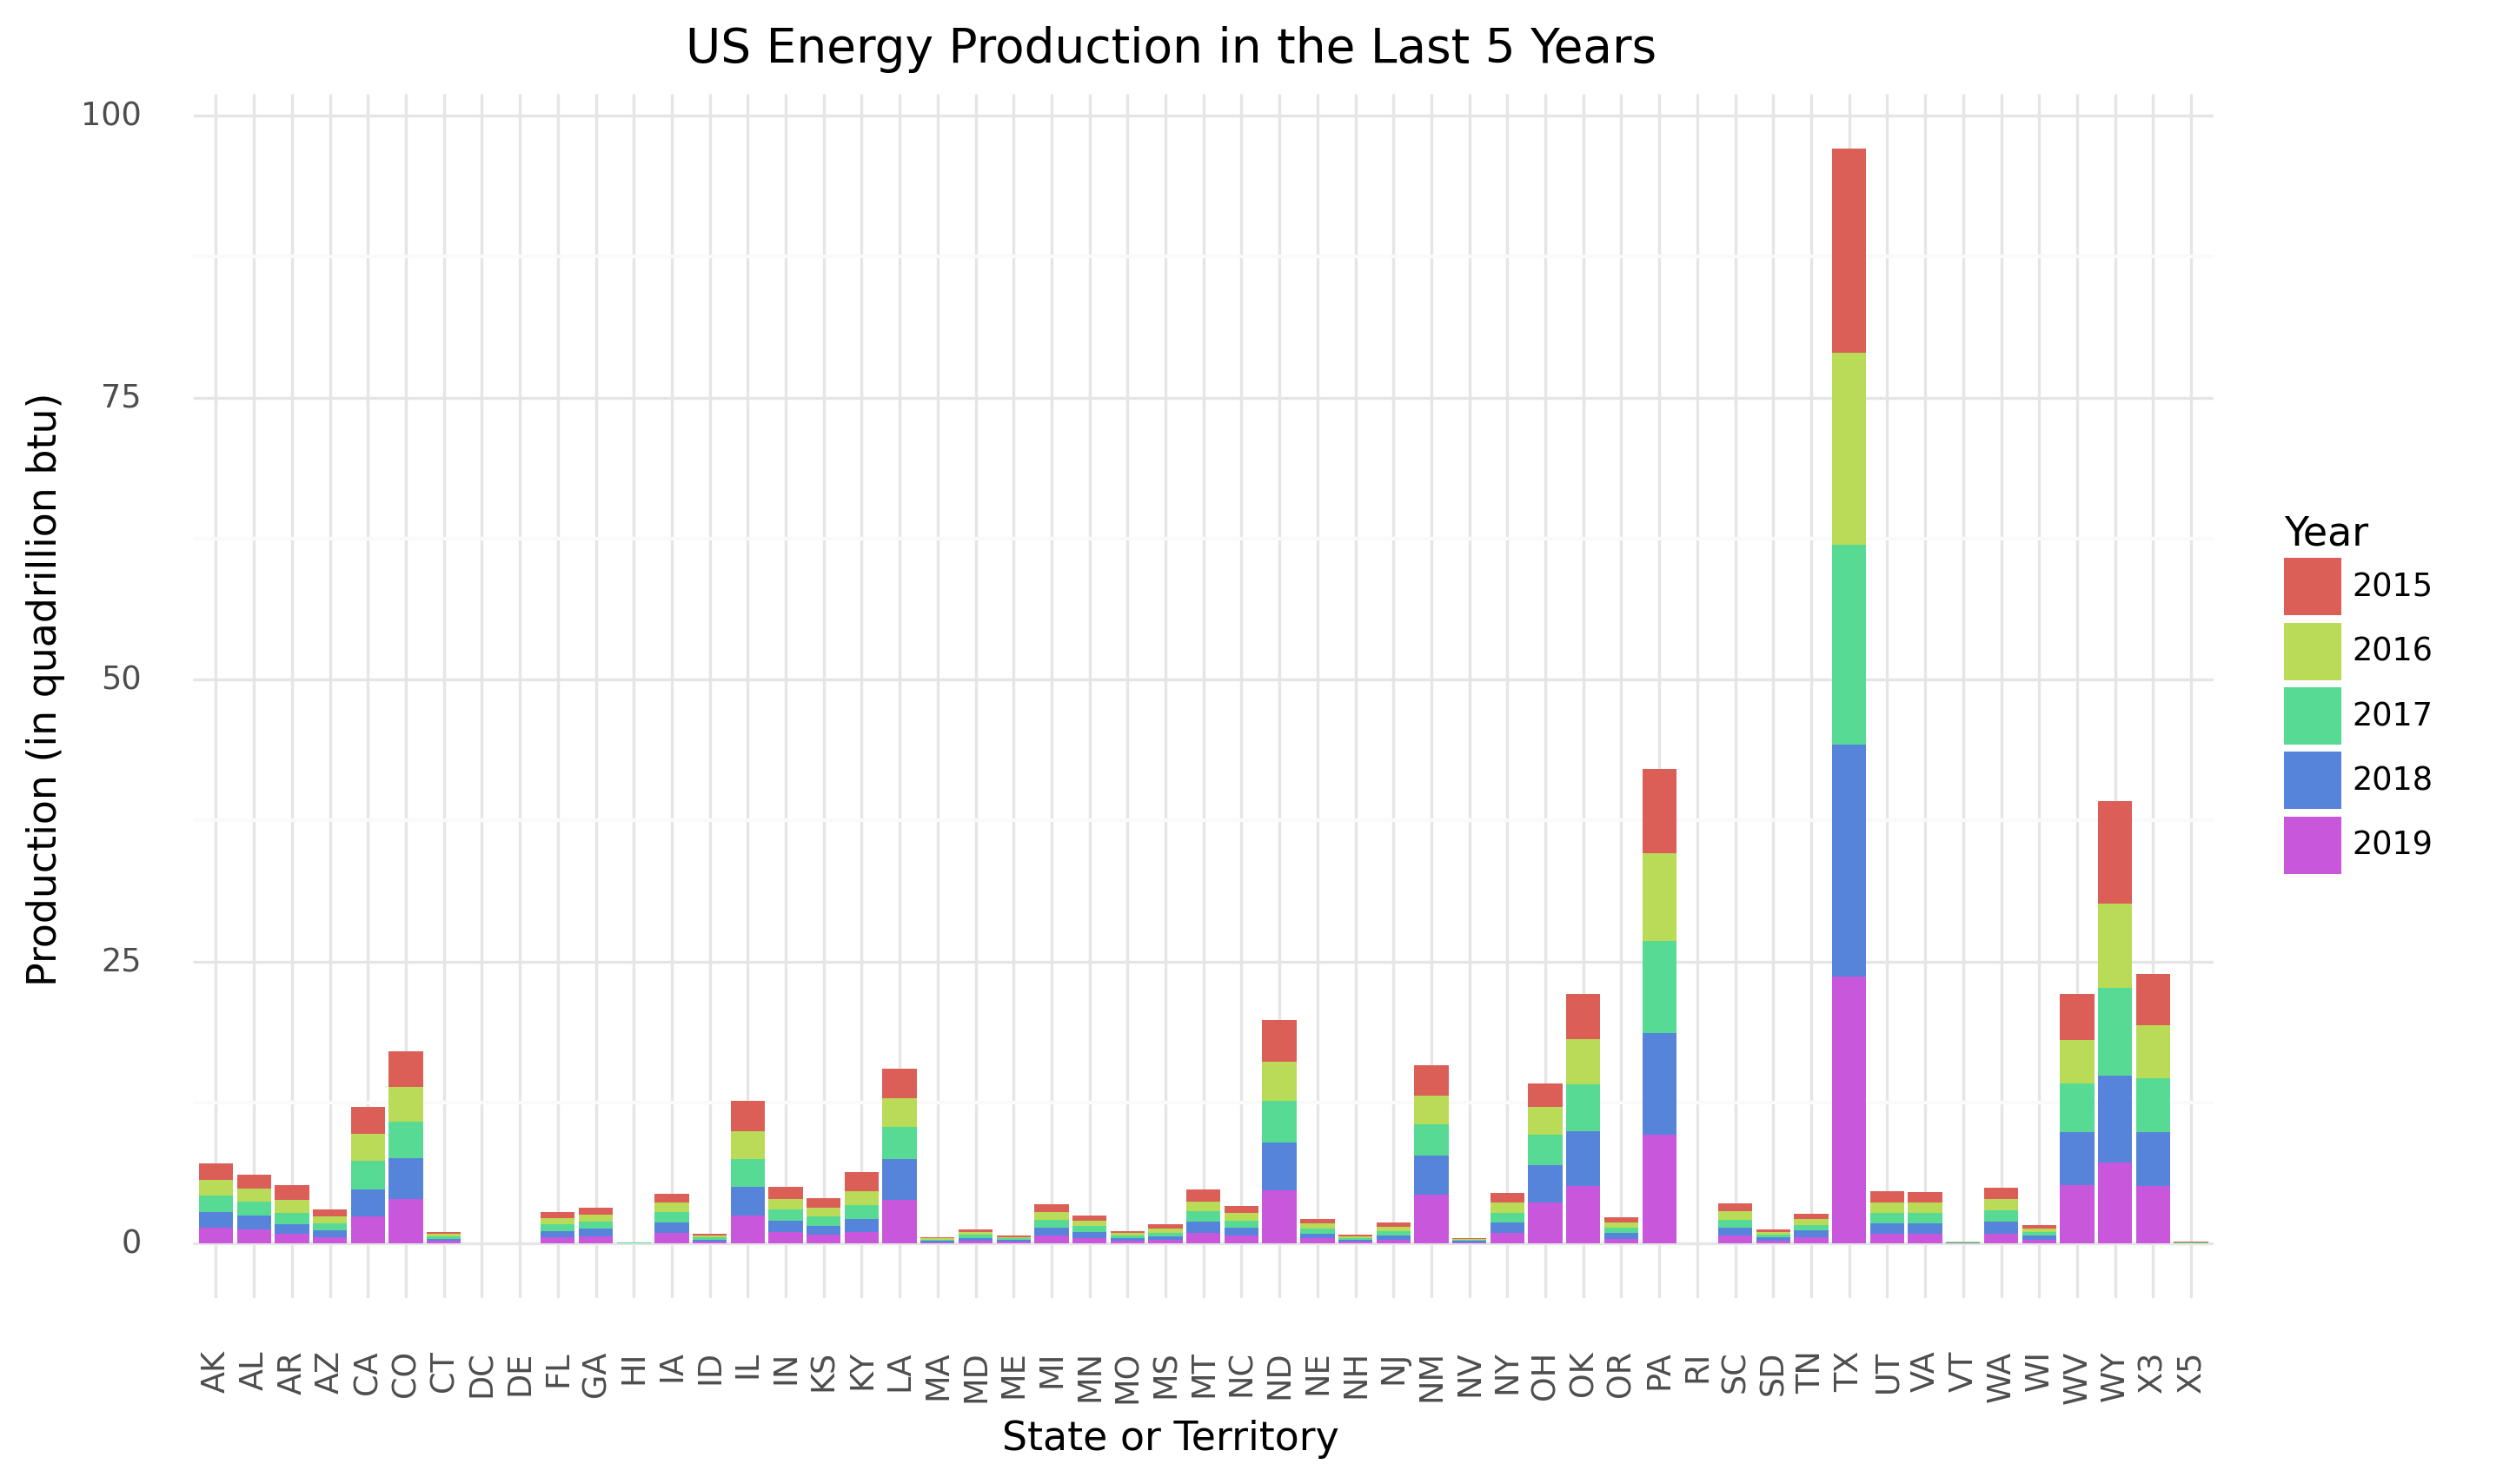
Total US Energy Production 2015-19
-
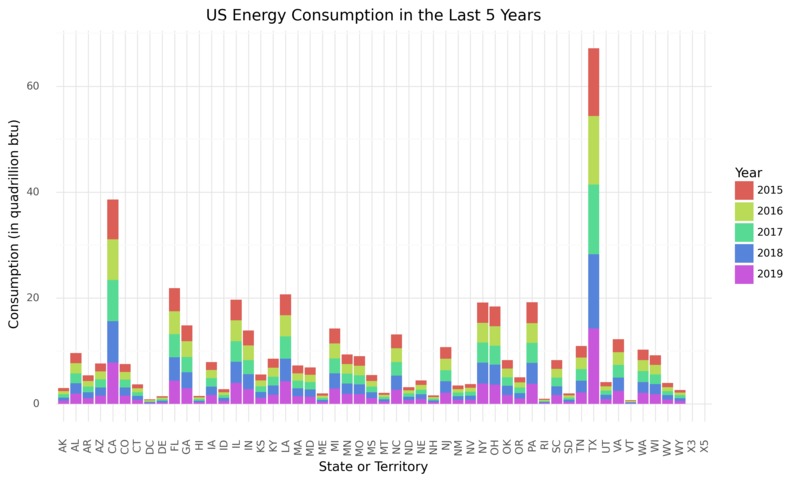
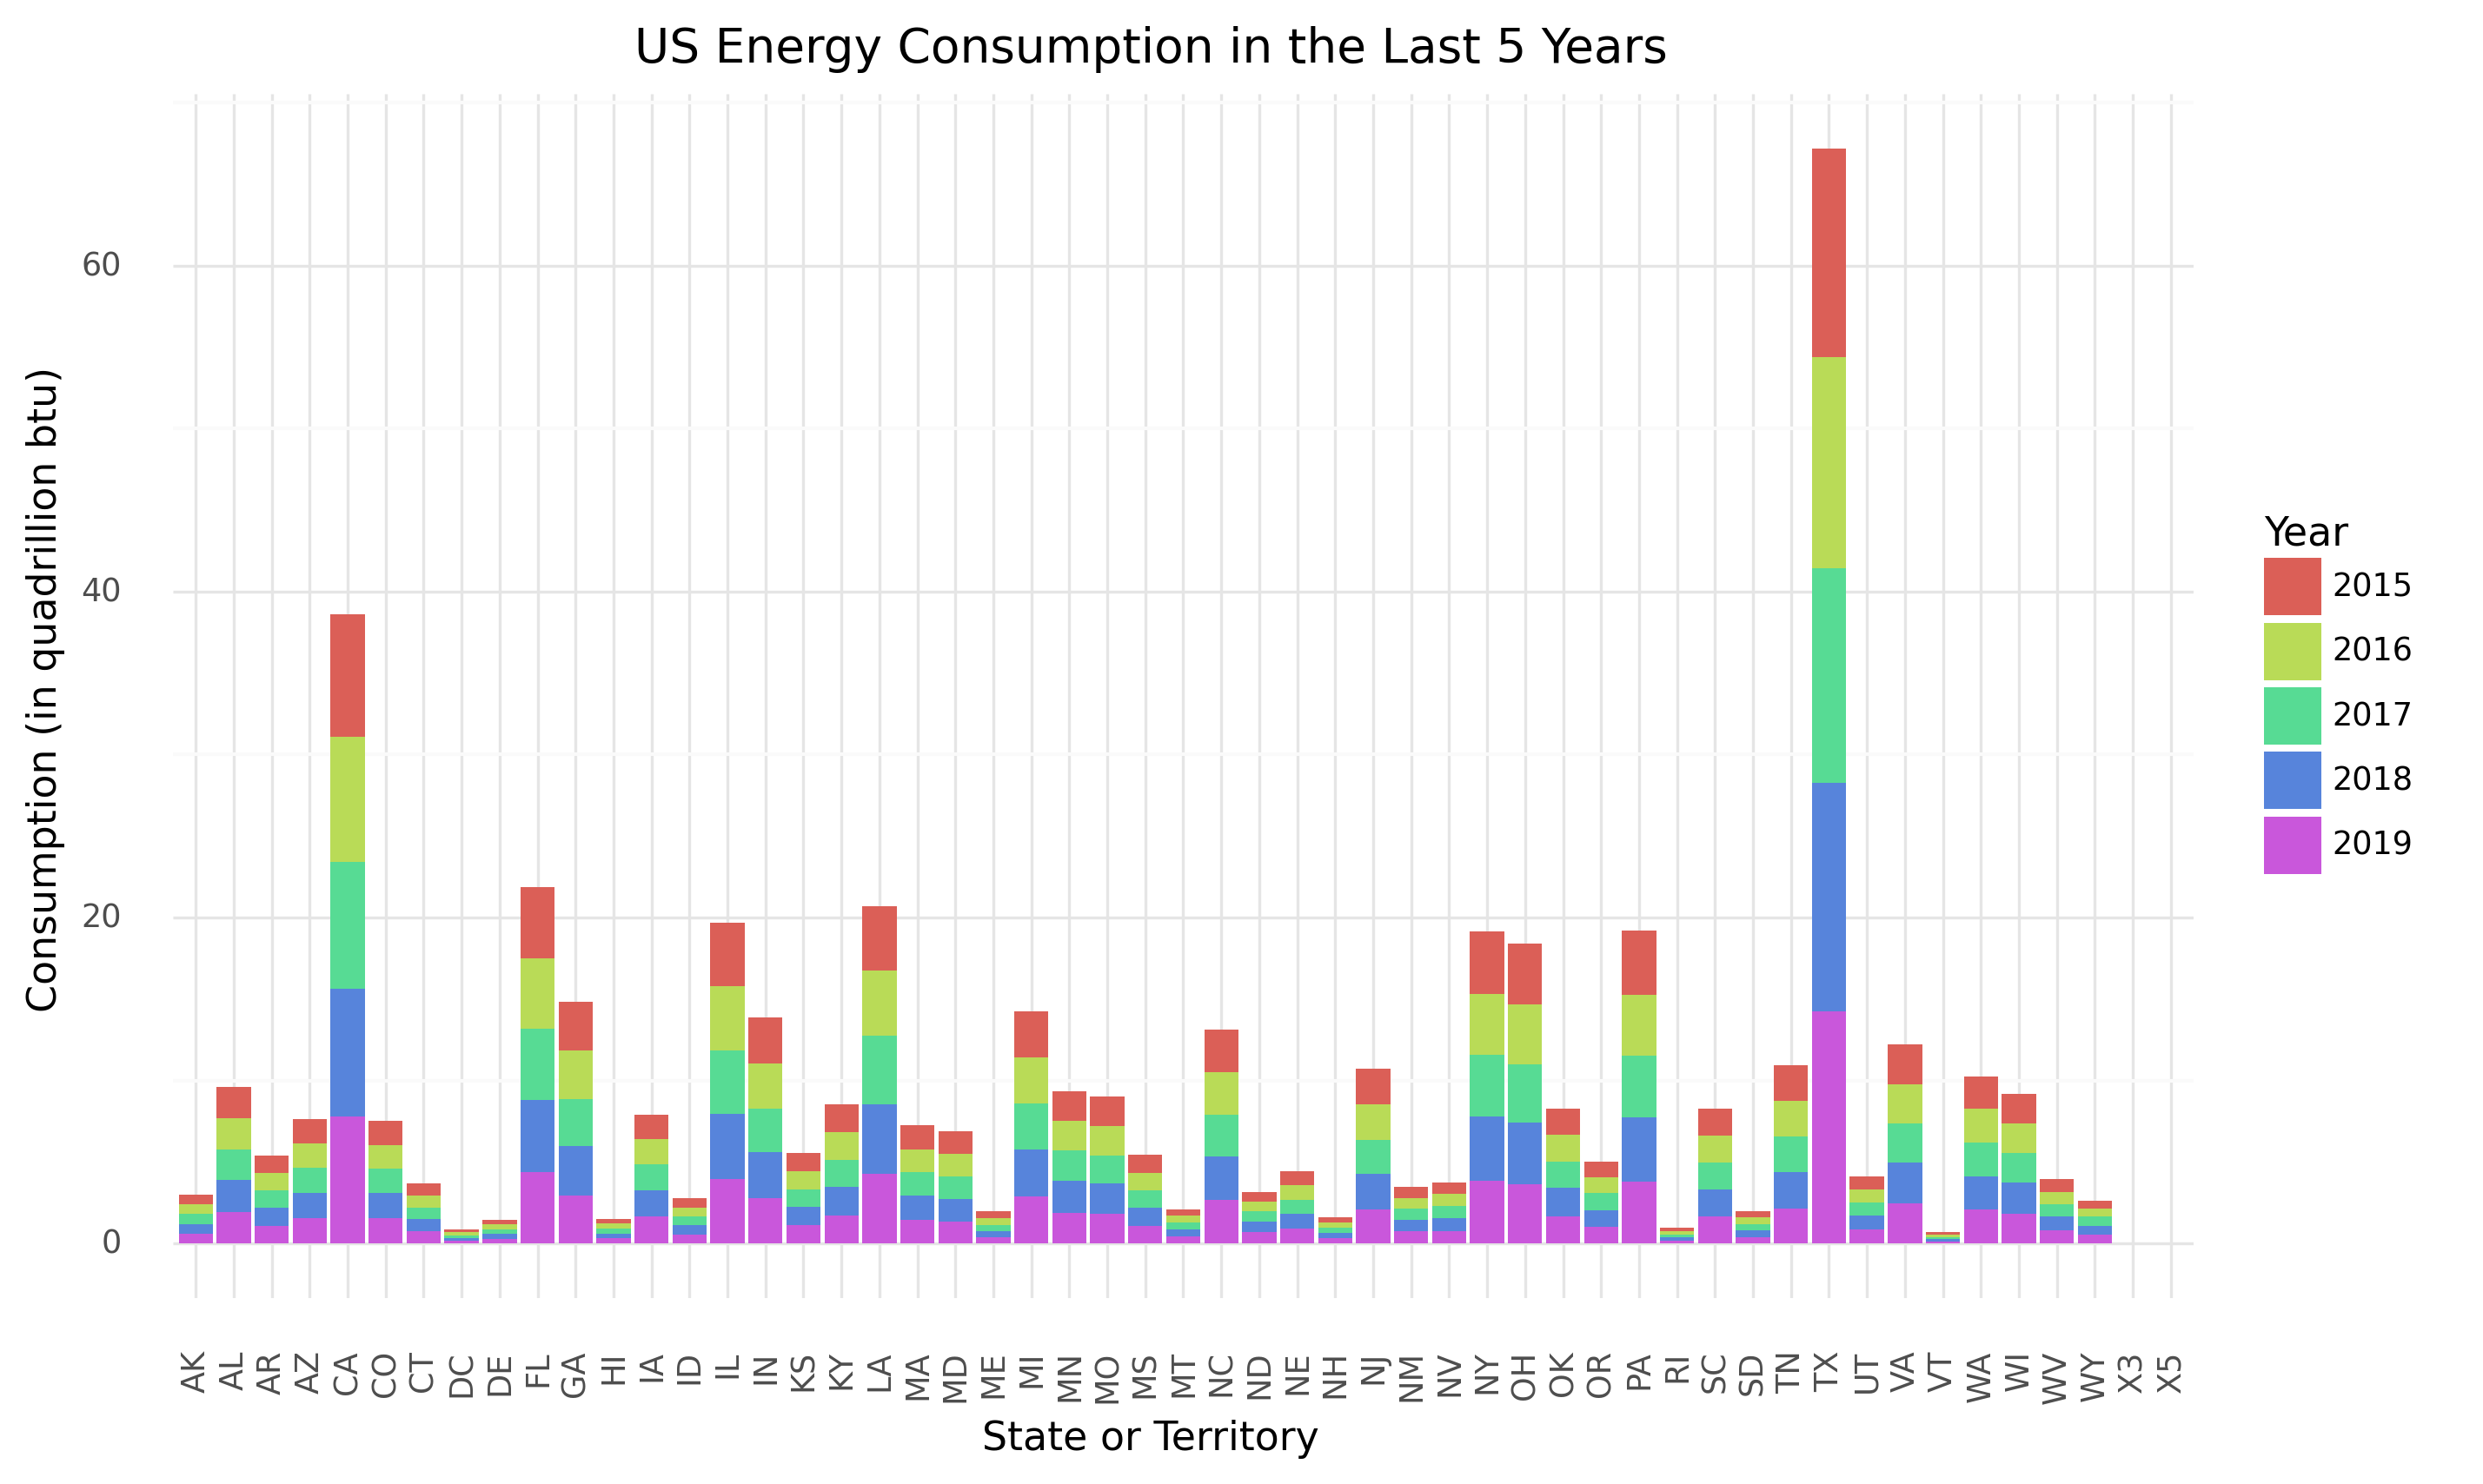
US Energy Consumption 2015-19
-
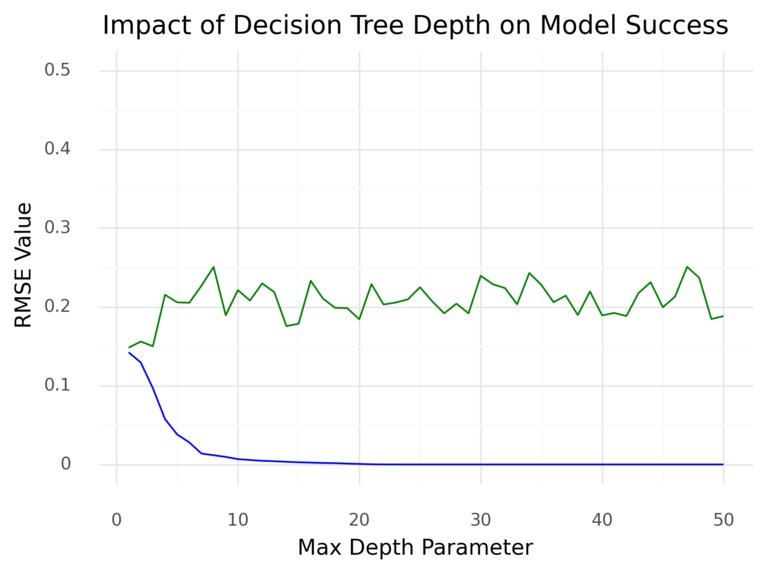
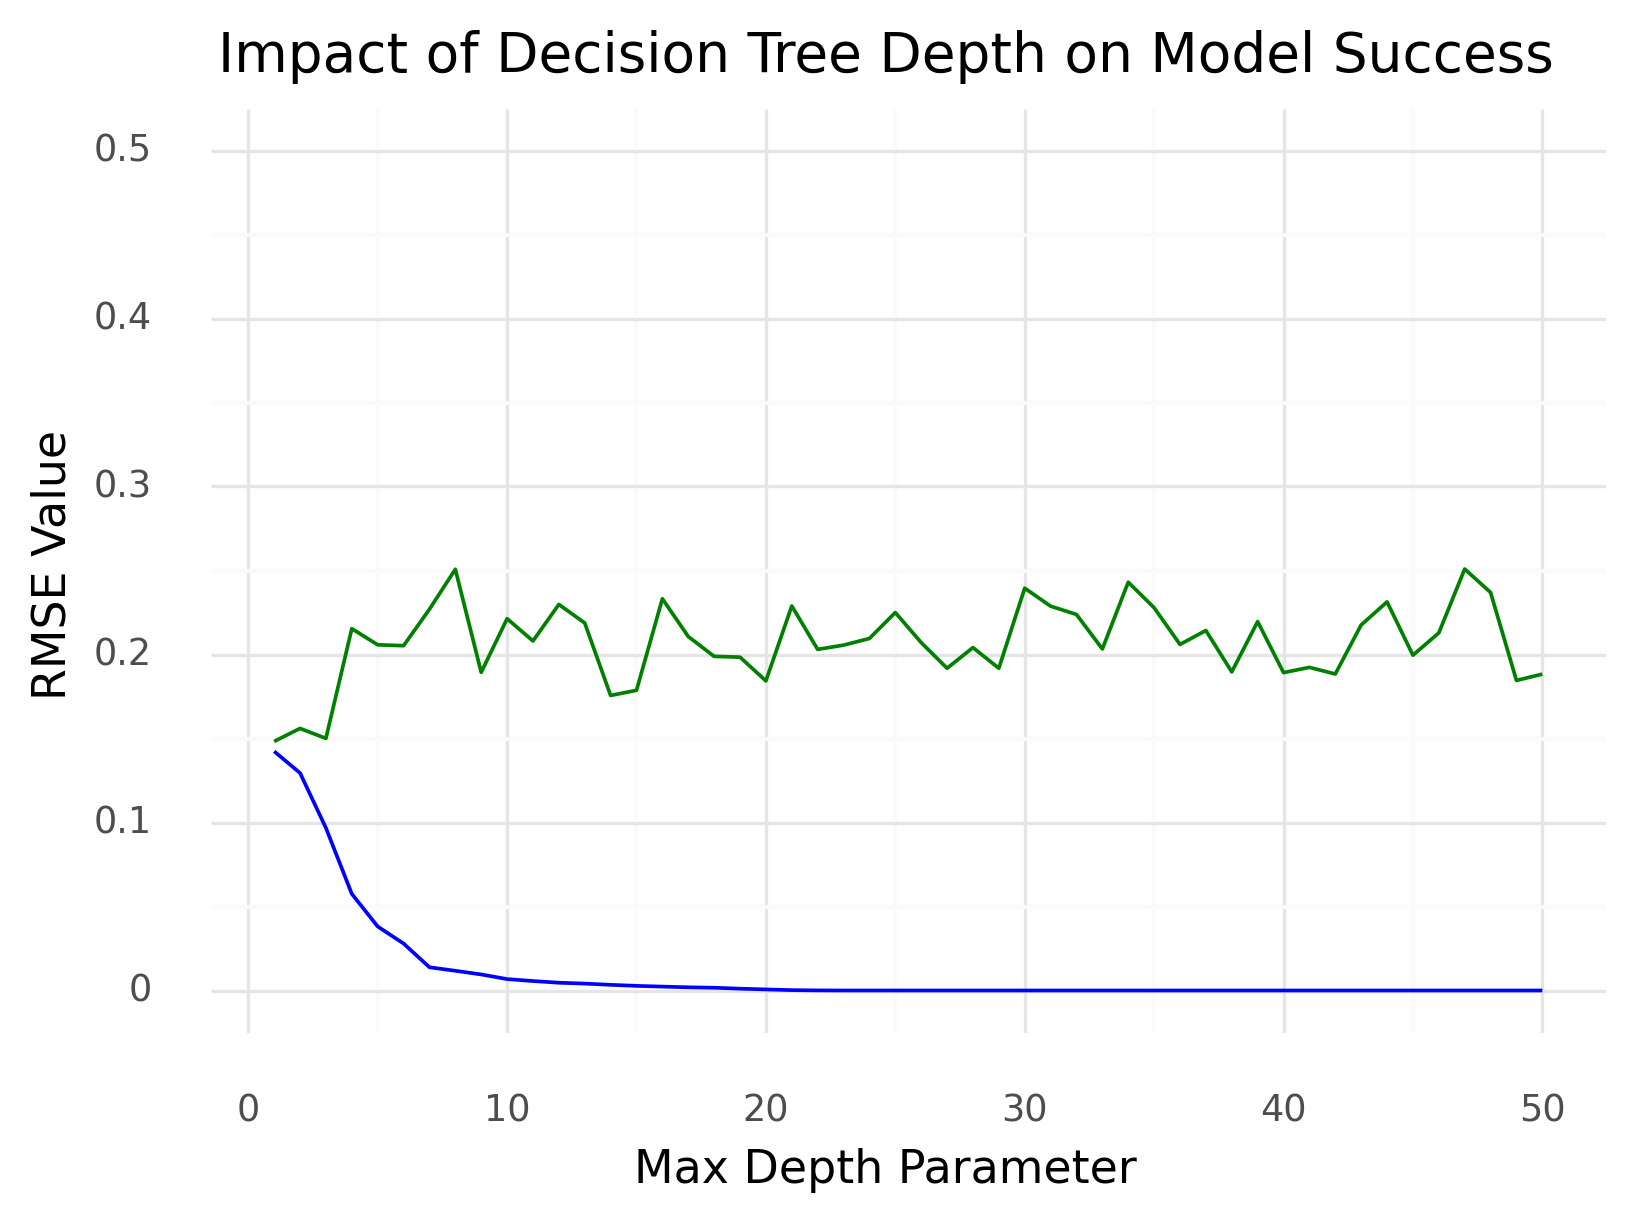
Impact of Decision Tree Depth on Model Success
-

LASSO Performance on Validation Data
-

LASSO Performance on Training Data


Inspiration
Recent national investment in clean energy in the United States has been on the rise. As Chevron implements their energy transition strategy, they must complete the task of narrowing down prospective collaborators. Chevron predicts that they will find more collaborators and companies of interest within states with greater renewable energy investments. Therefore, we aim to develop a model to predict the renewable energy investments of each US state for 2020.
What it does
We have developed a model to predict the amount of renewable energy investment dollars invested in each state.
GitHub Repo
Rice Datathon Chevron Challenge
How we built it
Step 1: Data Cleaning and Restructuring In order to restructure the data, we converted MSN values into variables with ‘Amount’ as the value. Next, to clean the data we filled in missing values, removed unwanted data, one-hot encoded state codes, standardized numerical data, and removed years to make predictions.
Step 2: Data Visualization To explore the data, we developed several visualizations. First, we plotted U.S. renewables investments (from 2015-2019) in each state. We observed that very few states invested a similar amount consistently, and states that invest the largest amounts of money vary each year. Based on this observation, we would expect a model to predict a few states that will invest a substantial amount of money.
Next, we graphed amounts of investments (from 2015-2019) in each state. By comparing this graph to the former, we found that states with the largest amounts of investments don’t necessarily match up with the states with the highest dollar amount of federal investment.
Step 3: Choosing a Model, and Fine-tuning Performance
Linear regression We began by running a linear regression model with default parameters, and received an RMSE of 0.2531. While this wasn’t a bad error to begin with, we decided to explore some more advanced statistical models.
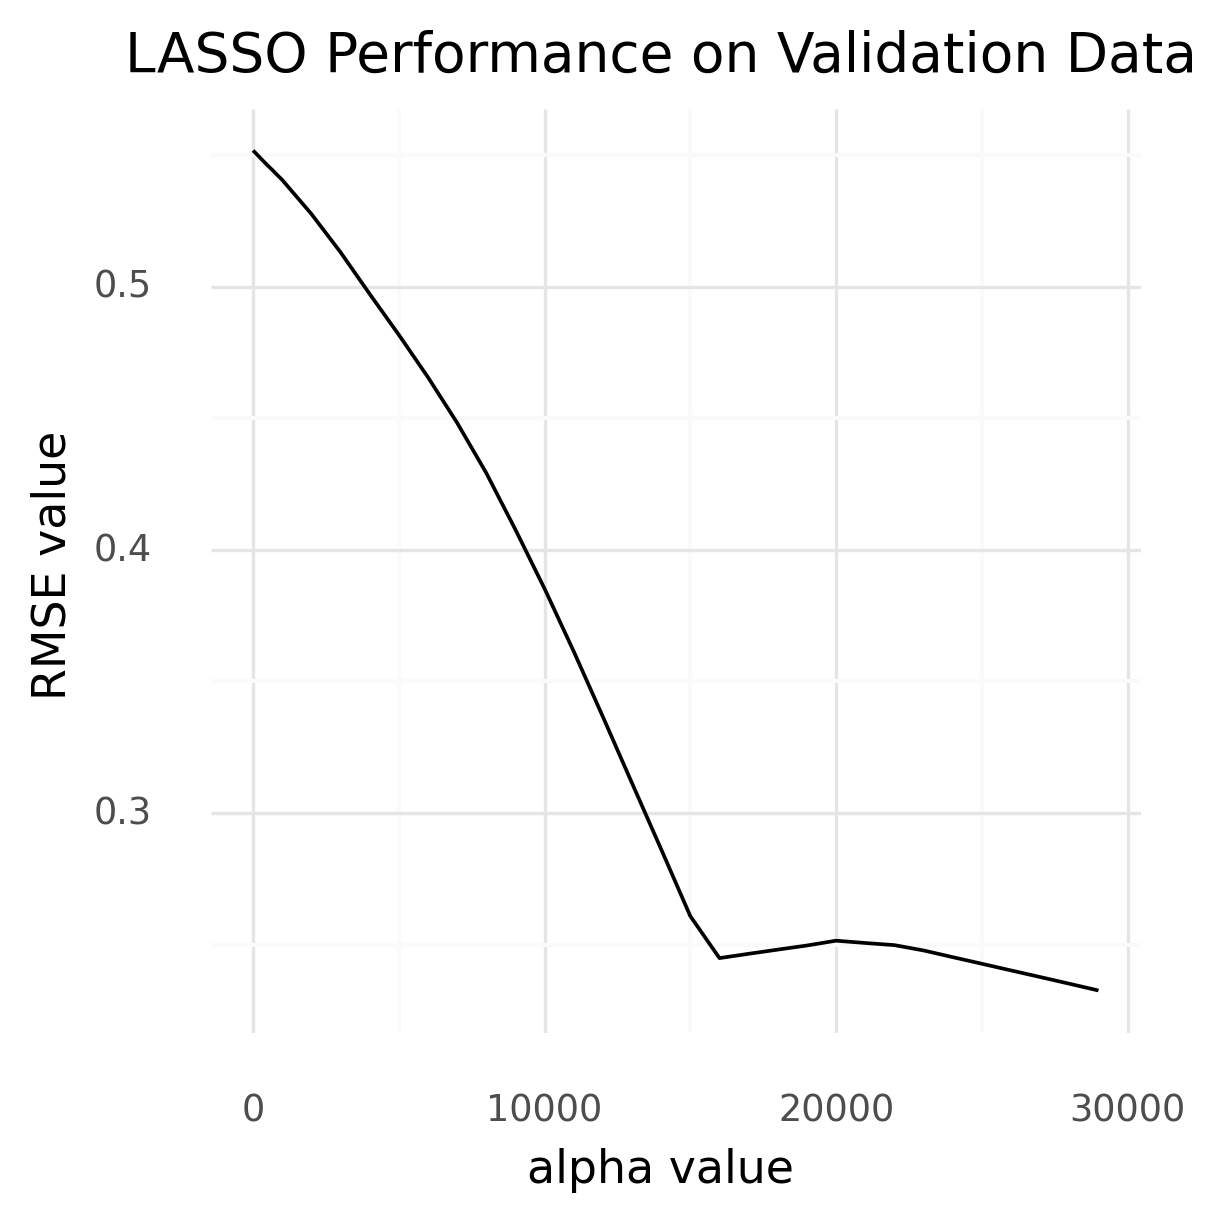
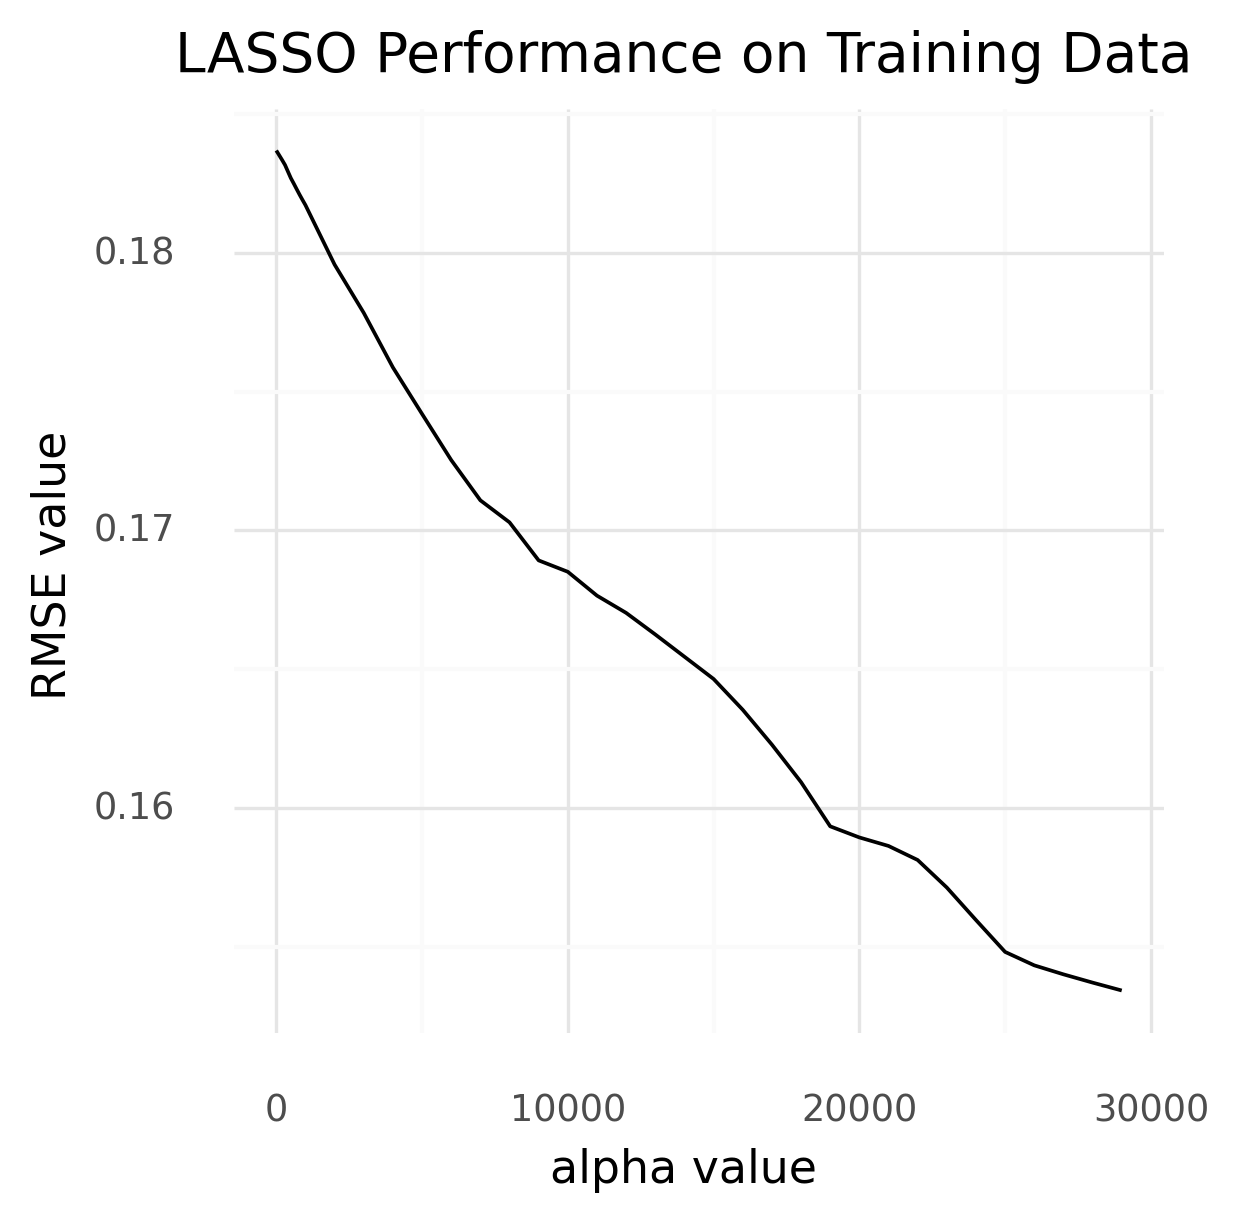
LASSO Next, we ran a LASSO regression model with default parameters, but our RMSE never stabilized.
Decision Tree Finally, we ran decision tree models with depth parameters from 1 to 50. The training RMSE quickly converged around a depth parameter of 10. The validation data remained fairly stable around an RMSE of 0.20. We chose to create a decision tree model with a depth parameter of 7. Running all 2015-2019 data gave an RMSE of about 0.014. The 2020 data had an RMSE of about 0.23.
Challenges we ran into
Formatting the data correctly was a challenge. The data was not overly messy, but each MSN code would be better processed as a variable with amount as a value. Additionally, it would make for cleaner predictions if each state and year was a single observation. While not technically difficult, it was a bit of a headache to format well.
For a while the RMSE was consistently reporting in the millions. It was baffling until we understood that we needed to standardize the output predictions to produce an RMSE that is interpretable.
Accomplishments that we're proud of
We’re proud of the visualizations that we created. They help interpret the data in a human-readable format, which is important to decision making, especially in a business context.
What we learned
Interestingly, only a handful of states seem to give large amounts of investments to renewable energy each year.
Built With
- google-colab
- pandas
- plotnine
- python
- rhino
- scikit-learn


Log in or sign up for Devpost to join the conversation.