Inspiration
Virginia holds more data centers than anywhere on Earth — and when they run out of industrial land, they get built next to suburbs. Residents document a persistent low hum. Standard sound meters can't hear the problem: Loudoun County's own noise page admits its dBA standard "does not capture low frequency noise or the discomfort caused by steady tonal sounds." A resident complains; the county's meter says everything is fine; the complaint dies. The harm persists because it is invisible to the measuring tool the law uses.
We picked this problem after screening 18+ alternative data-center solutions (waste-heat reuse, rainwater capture, siting tools) and finding the same thing each time: mature infrastructure already exists. For community noise around data centers — nothing. No map, no complaint protocol, no tooling anywhere.
What it does
TonalWatch measures the exact thing the standard can't see. Any phone or laptop records a 5/15/30-second sample; the browser computes two official sound weightings at once — A-weighting (the way standard meters "hear," the way the law counts) and C-weighting (much more sensitive to low frequencies, the way your body registers a hum). The difference (C−A) isolates low-frequency content: when C reads 15+ dB higher than A, that is the tonal signature the county's number misses. Constant volume errors cancel in the difference — that's the honest part.
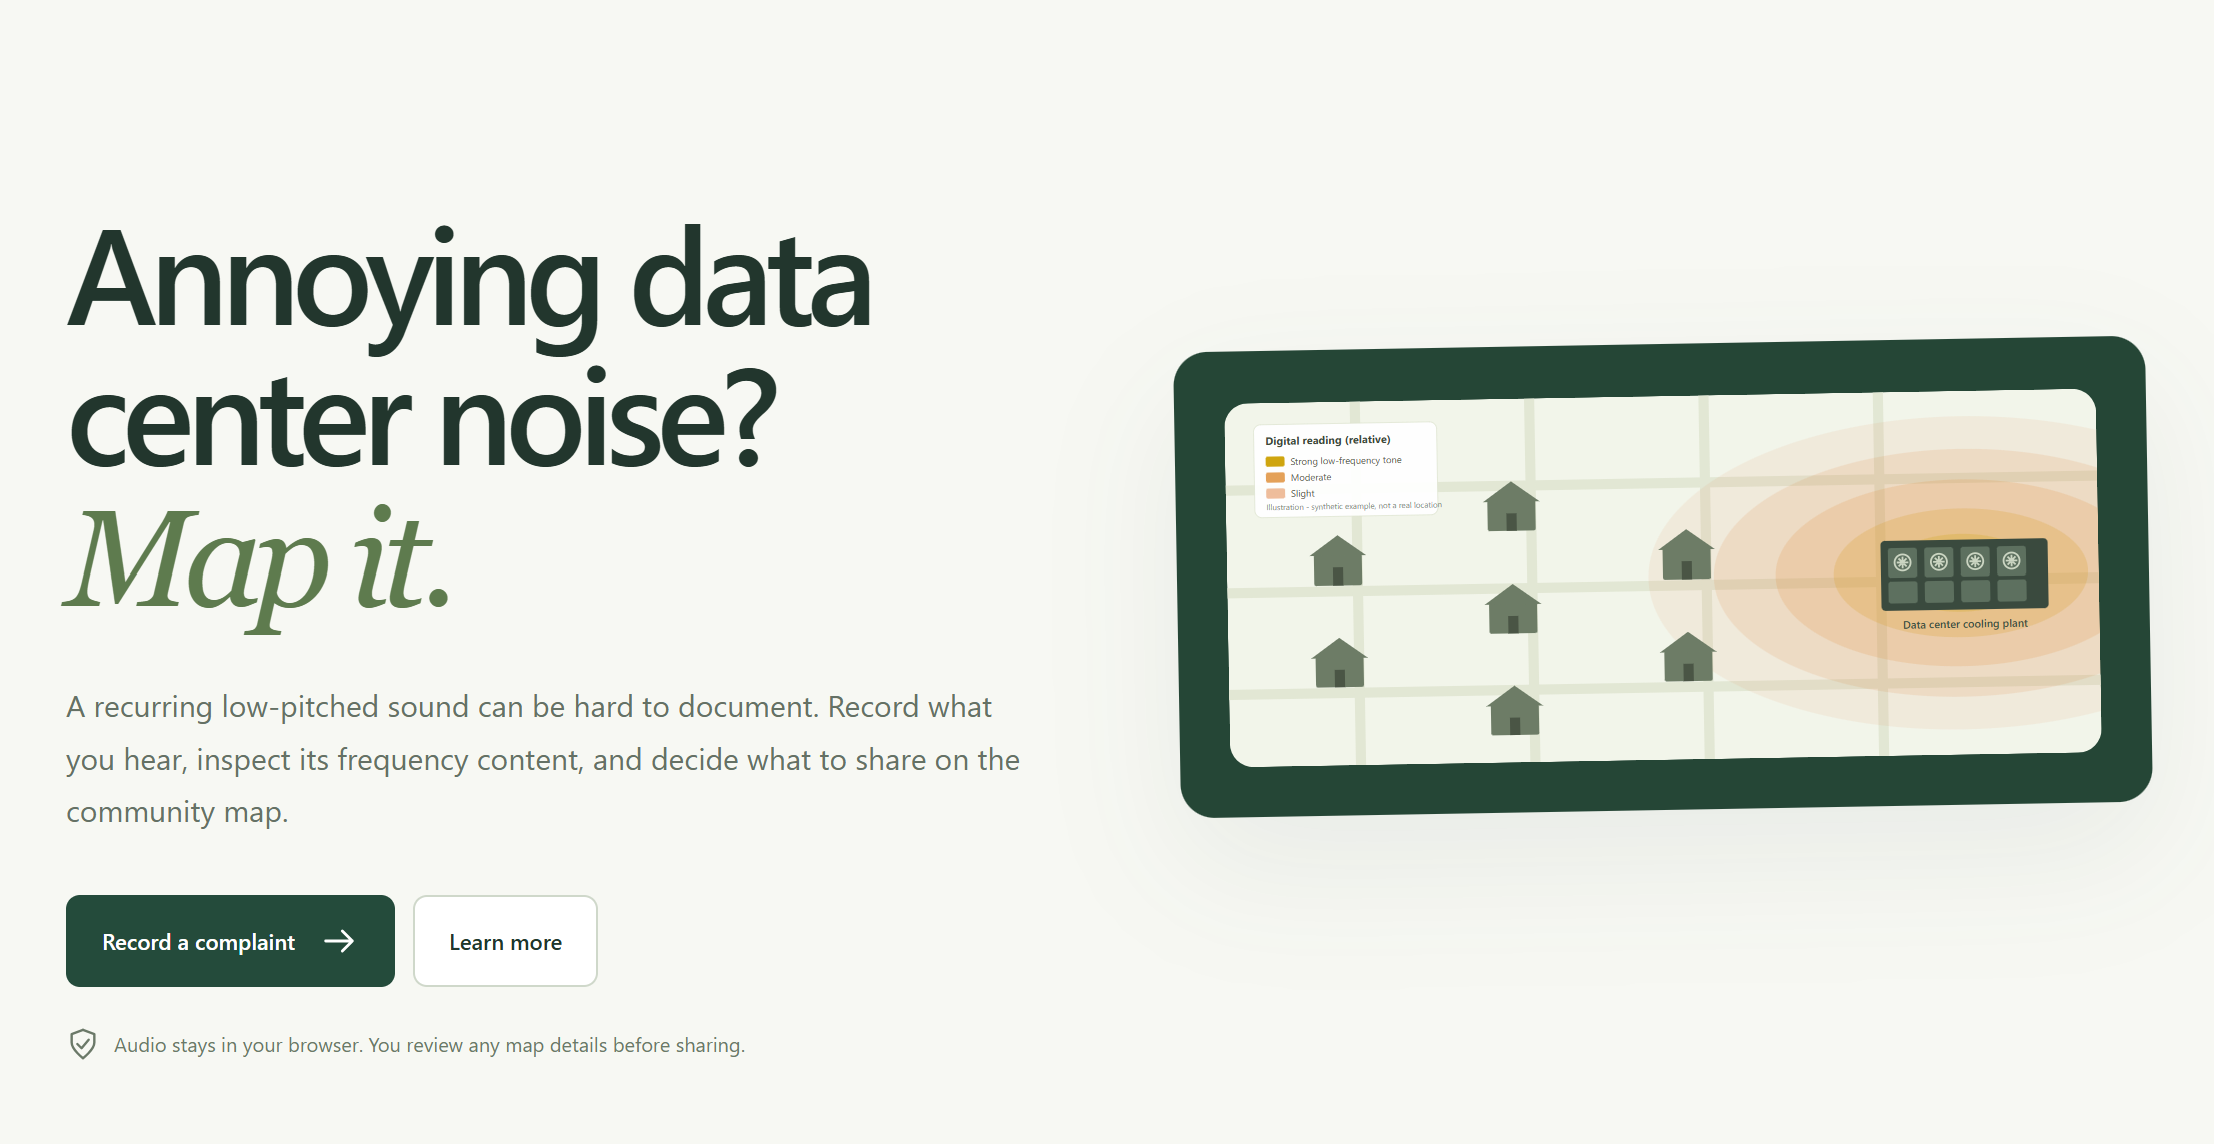
Users get a plain-language verdict (no tonal noise detected / tonal noise likely / sample unusable — with reasons like background noise, wind, or clipping), can compare consecutive captures, learn the science in one page written for two audiences (a neighbor who just wants clarity, a student who wants the mechanics), and log their reading on a community map of data-center sites — crowd-evidence in the style of Waze, but instrumented: each pin is a repeated physical observation, not a testimony.
How we built it
- TypeScript + React (Vite), a Web Audio capture pipeline, and a deterministic DSP engine in a Web Worker: FFT with Hann windows, IEC A/C weighting curves normalized at 1 kHz, frame persistence tests for the experimental peak check.
- A test-first engine: 74 unit tests including synthetic fixtures with known answers (a 63 Hz hum + harmonics reads ~+20 dB gap; a pure 1 kHz tone reads ~0 — a deliberate counterexample showing why a gap alone is not a tone detector).
- A standalone field lab for hardware validation, plus quality gates (silence/noise-floor/clipping checks, honest "sample unusable" states instead of confident numbers from bad input).
- Local-first map (Leaflet + OpenStreetMap) with explicit provenance labels; live demo works offline.
Challenges we ran into
- The dBFS ↔ SPL trap: our first spike read −150 dB because a dead input device's raw digital floor was being displayed as if it were sound pressure. Fixed with device selection, live input meters, and honest "digital level, uncalibrated" labeling everywhere.
- The calibration wall: absolute sound levels need lab calibration per device. Our answer: don't sell absolute levels — sell the difference (C−A), which cancels any constant volume offset, then validate cross-device agreement in the field.
- Field reality: two team members ran a 29-capture validation campaign across campus in one afternoon — exploratory, honestly labeled, but it measured three things live (airflow from fans masks the tone; the signature reads clearer at distance; human broadband noise collapses sensitivity). Every claim in the pitch is tagged with exactly what the data supports.
- Merging three humans + two AI agents on one repo mid-competition (scope decisions stayed human; agents proposed, humans disposed).
Accomplishments that we're proud of
- Our field exploratory test found a gap that TRIPLED (≈6 dB → ≈20 dB) with distance from an industrial AC source while loudness fell — matching the documented complaint pattern "audible over a mile away, but compliant at the fence." Consistent with our design physics.
- The industry's own noise-control literature admits the tonal hum data residents need is effectively unobtainable — we built the resident-side instrument for that gap, verified on consumer hardware.
- Prince William County's May 2026 ordinance (PWC 25-62: 73 dBC day / 68 dBC night) already codifies the A-vs-C approach into law — and Loudoun's noise-code rewrite is scheduled for 2027. Community instrumented evidence is the missing layer between 5,000 frustrated complaints and the scheduled rewrite.
What we learned
- Measurement is a protocol, not a gadget: stand still, stay quiet, stay out of the airflow, take three captures, keep the middle value, log the conditions. The method came from our own field data.
- Honesty scales: every number on screen carries its own limit ("uncalibrated," "exploratory," "screening only") — and that made the project more persuasive, not less.
- The airport asymmetry a judge handed us: nobody moved next to an airport and complains about planes. Data centers moved next to THEM. That frame changed how we pitch the whole problem.
The problem/solution, complete — and the real fix after the map
The honest objection: a complaint map doesn't make the hum quieter. True — and it's not supposed to. It's the evidence layer the whole solution chain runs on:
Residents → evidence → the legal machinery → fewer tons of noise at the source.
- Document (built today): instrumented, protocol-based readings turn "I hear a hum" into data with a method attached.
- Aggregate (built today): the map converts scattered complaints into a pattern the county can't average away.
- Trigger (the county's own process): repeated verified screening measurements are the thing that gets a licensed acoustical survey commissioned — the step residents can't afford alone.
- Regulate (already scheduled): Loudoun's noise-code rewrite lands in 2027. PWC's Ordinance 25-62 proves the mechanism exists in Virginia today: the same A-vs-C measurement logic, already written into law. Evidence from the map is exactly the input that rewrite will consume.
And past the map — actual mitigation, where our measurements become the tool:
- Walls and berms — already failing, measurably. Low-frequency sound diffracts around barriers like water around a rock; Loudoun's existing berms can't stop the 50–250 Hz tonal band. Our measurements would show that before spending another dollar.
- Distance and siting — the strongest controls. The signature reads clearer at distance while loudness falls; siting and setbacks are the highest-leverage fix, and instrumented data is how a county defends its setback rules.
- At the source — the fix the industry itself documents. Operators already retrofit fan blades to eliminate specific tones (AWS's own noise-control literature documents exactly this), often while improving fan efficiency. Localizing a tonal peak to a specific fan speed makes a retrofit work order possible — quieter AND cheaper to run.
- What gets worse: nothing at the source changes until the noise is legible. Every mitigation above runs on the same input: measured, repeated, honest data. That's the layer we built.

Log in or sign up for Devpost to join the conversation.