-
-
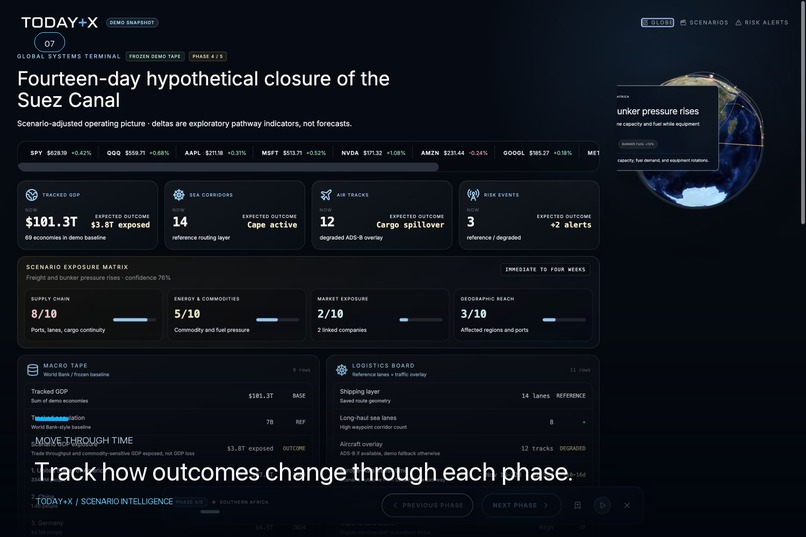
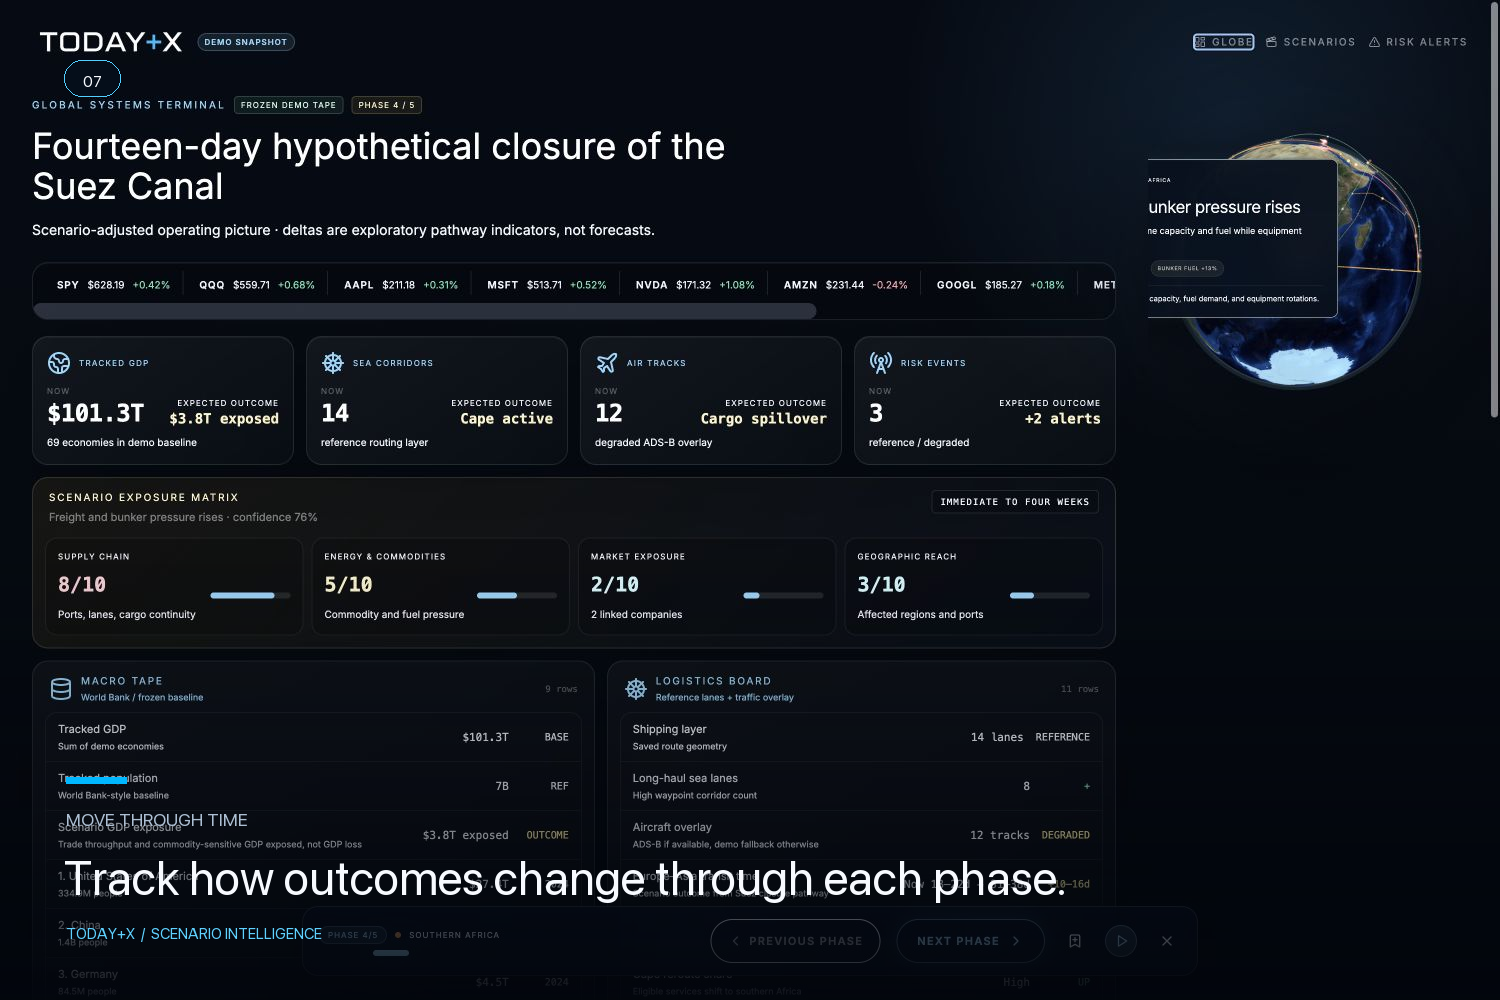
As the scenario moves forward, the dashboard updates to show how the pressure changes over time.
-
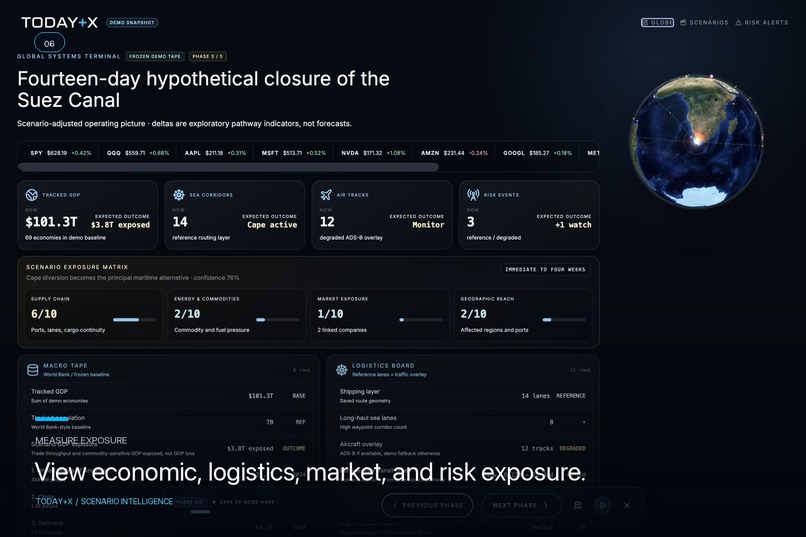
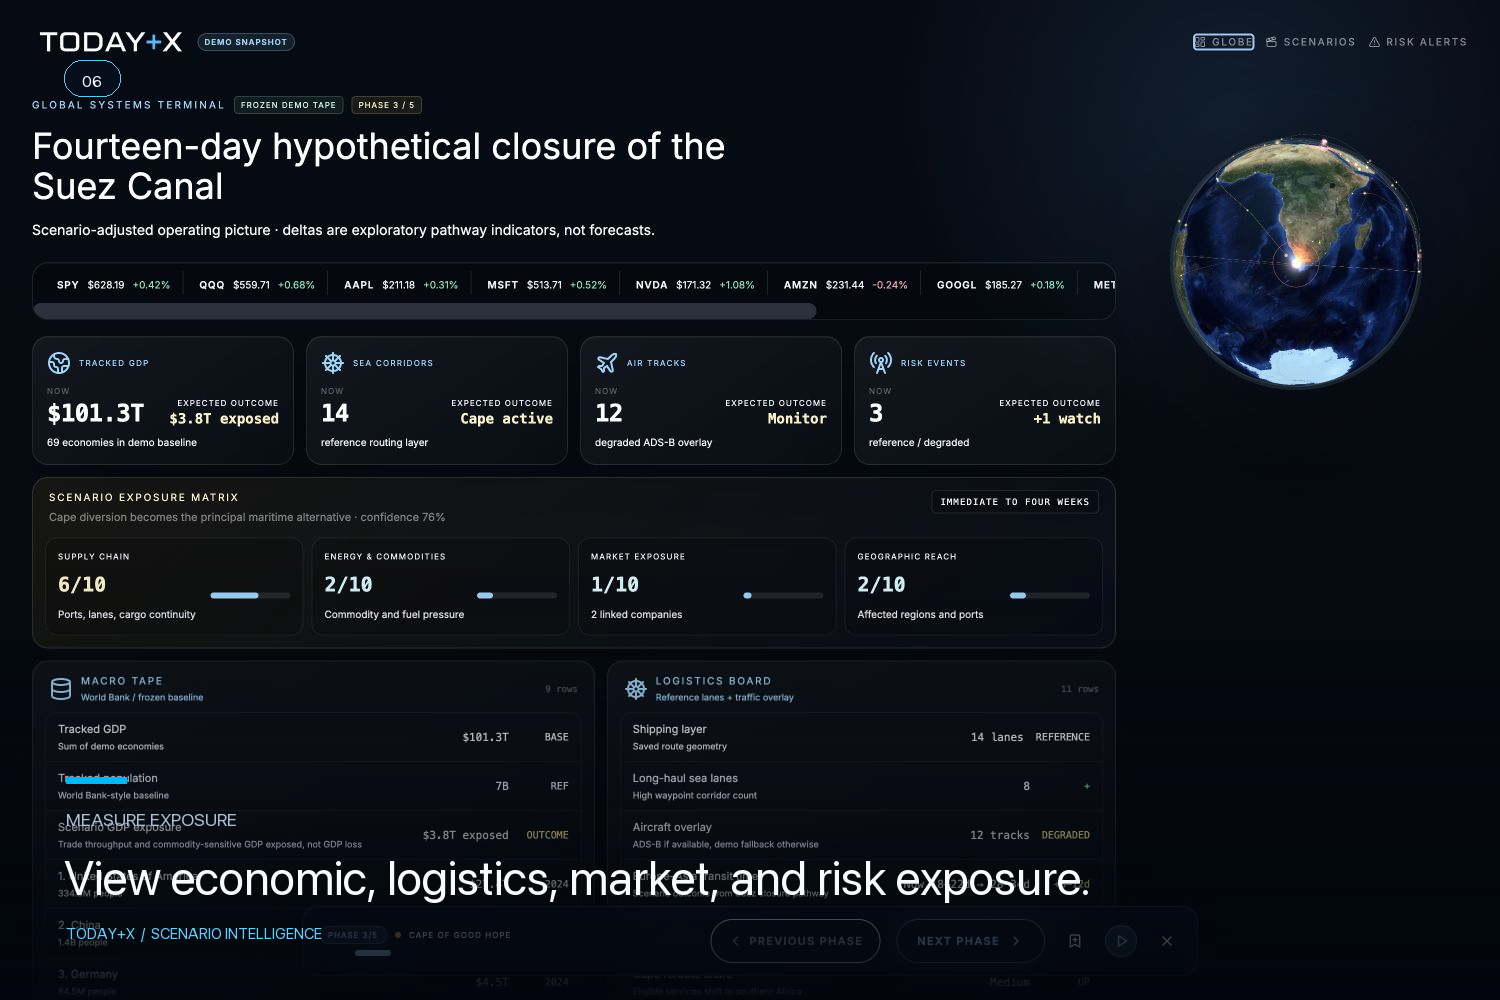
The dashboard brings economic, logistics, market, and risk exposure together in one view.
-
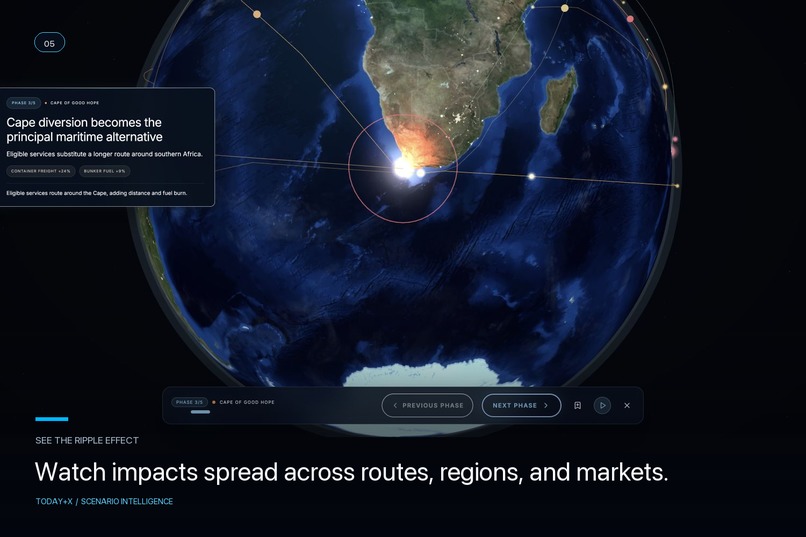
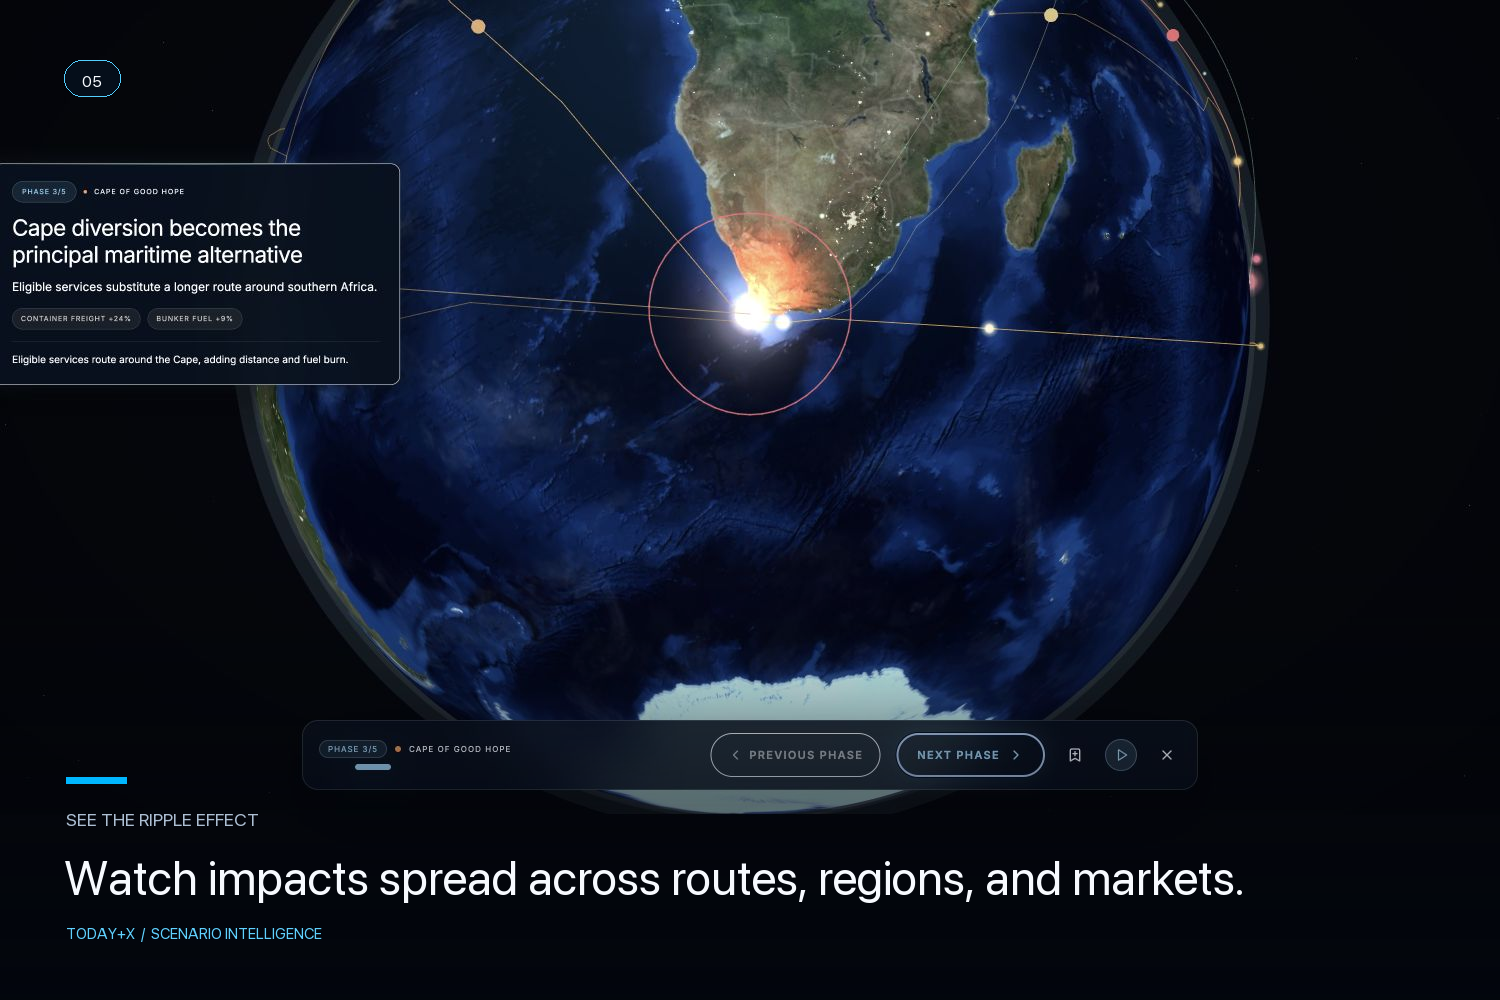
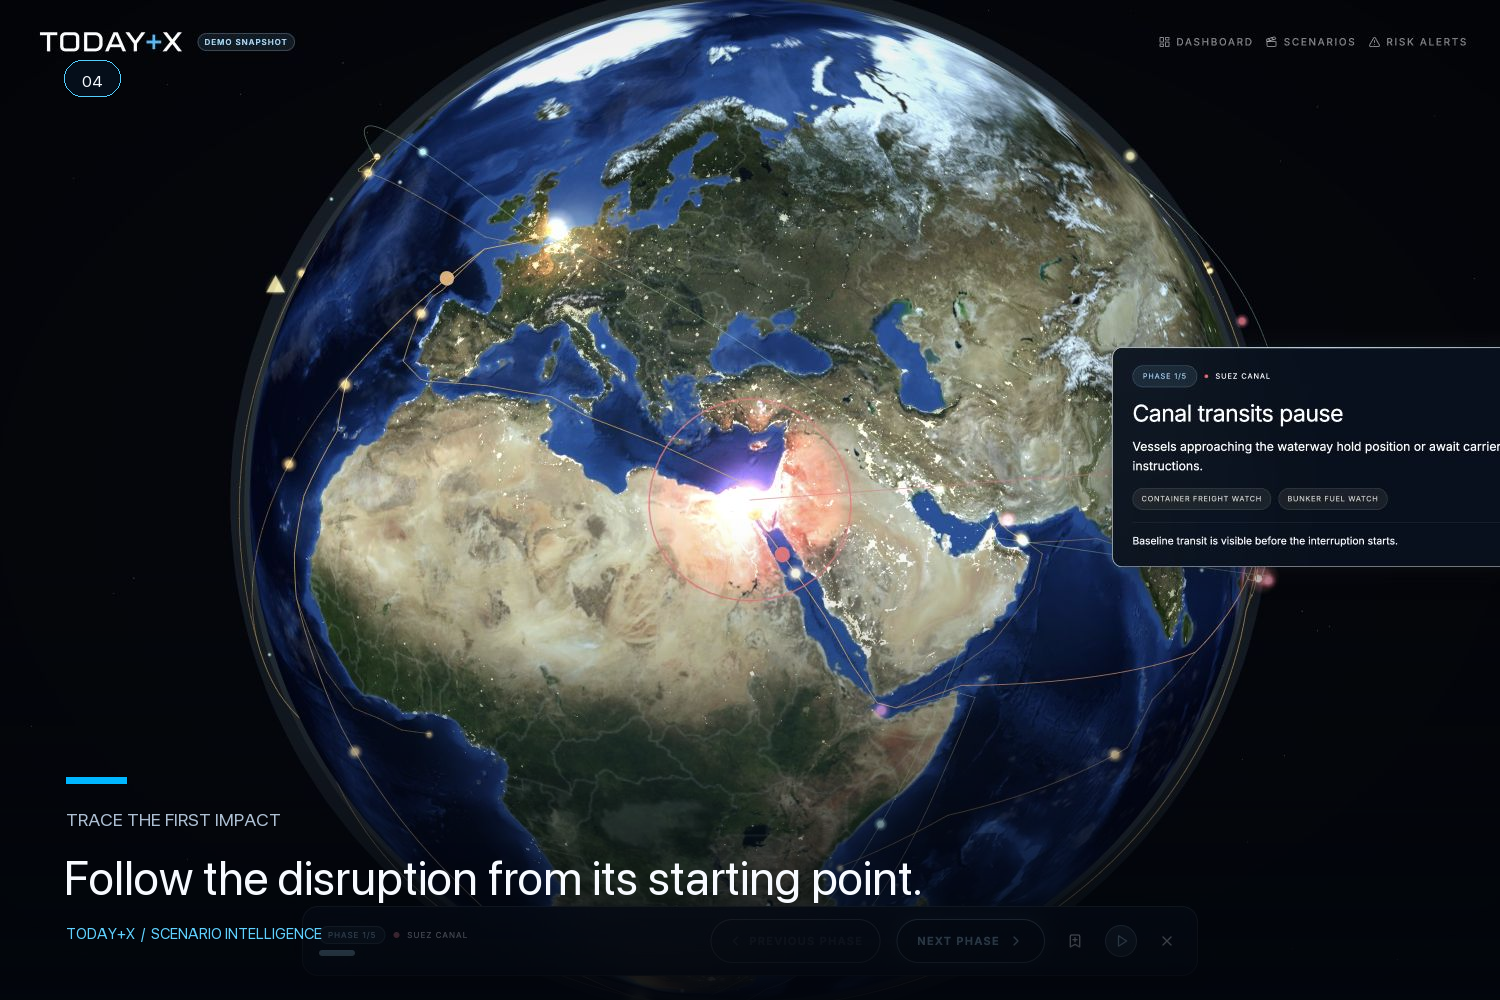
Here, a Suez closure redirects ships around Africa, increasing travel time, fuel use, and freight costs.
-
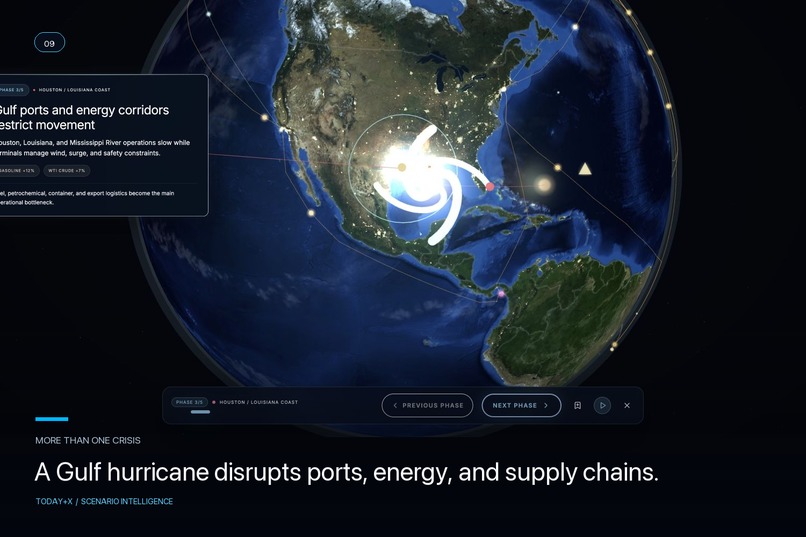
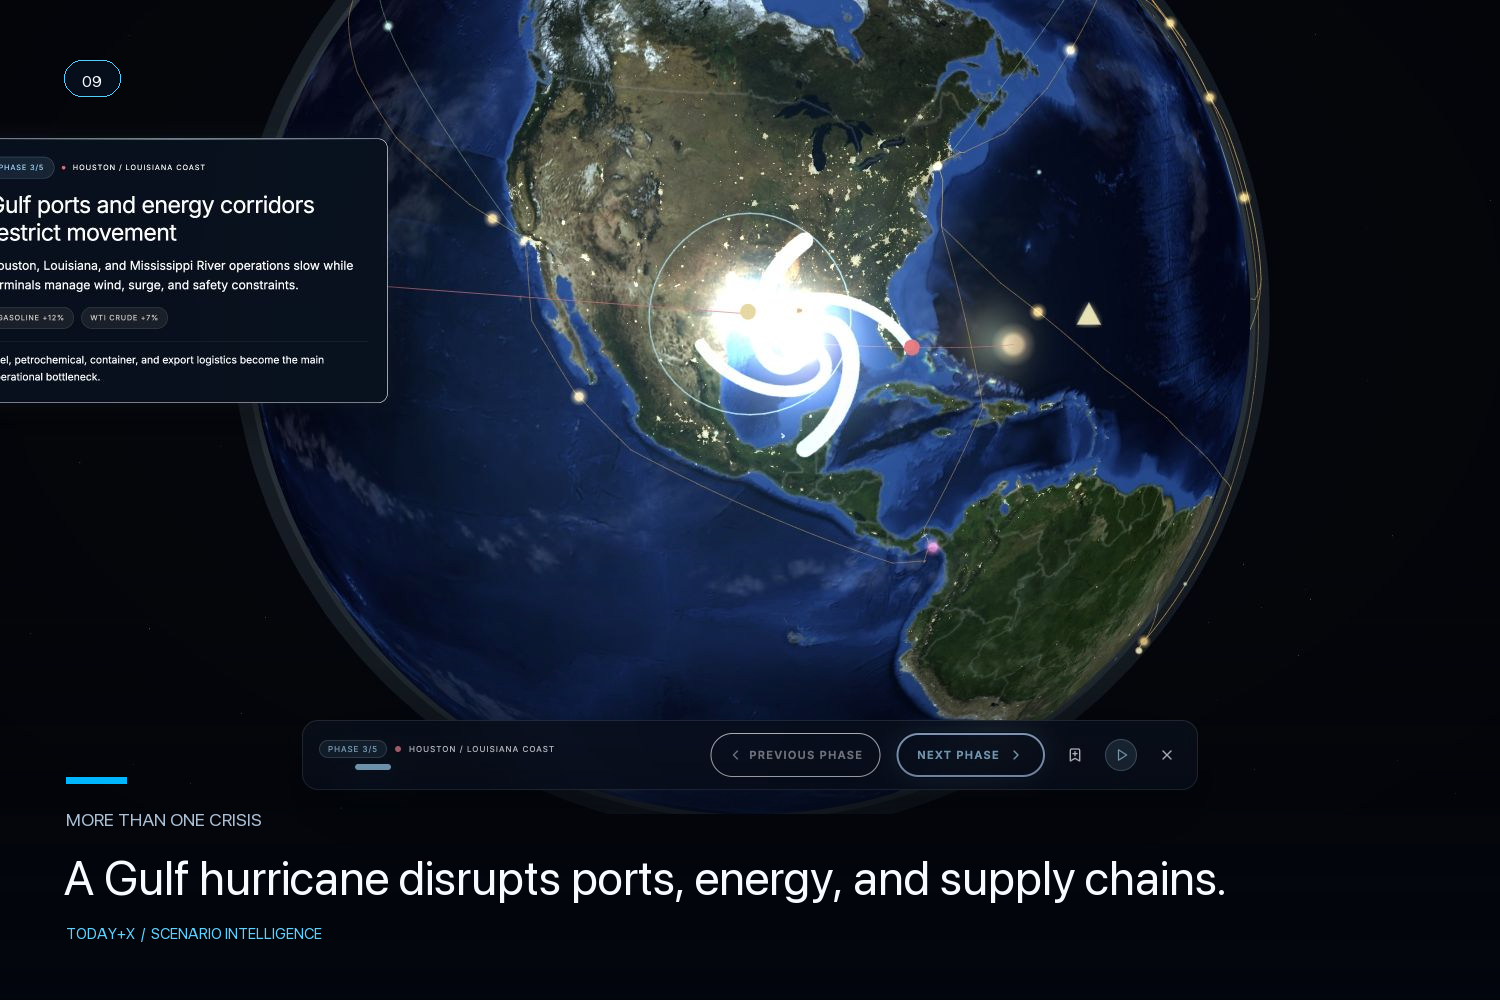
A Gulf hurricane shows how Today+X can connect severe weather to ports, energy, fuel prices, and supply chains.
-
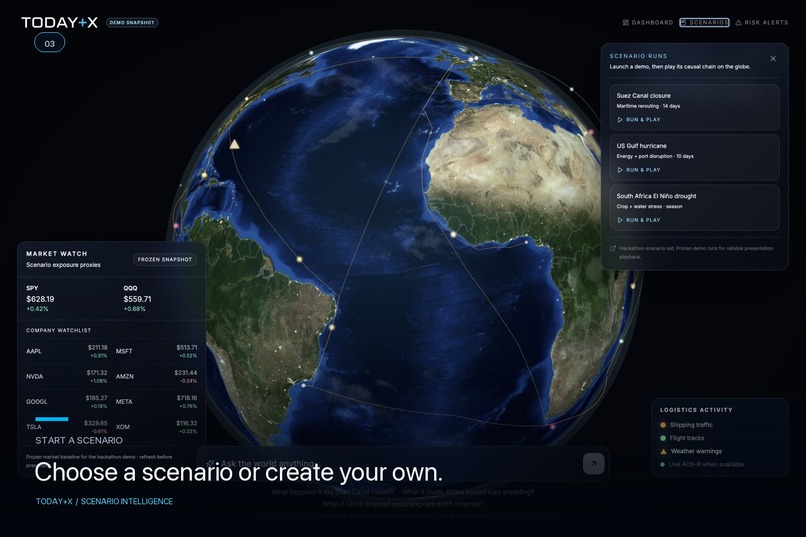
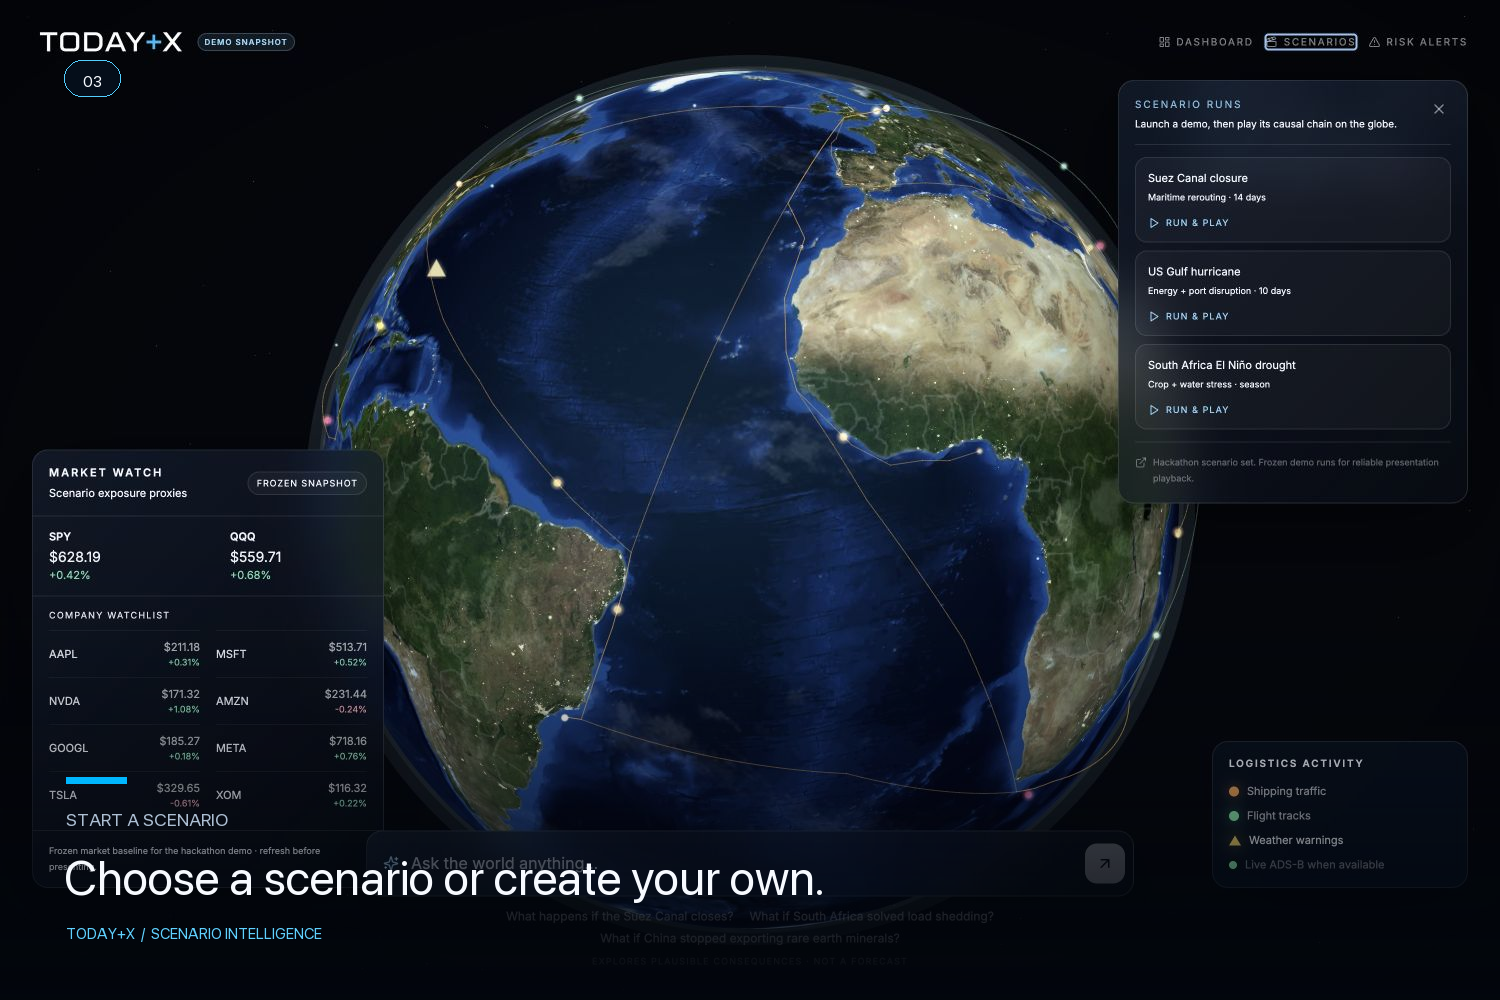
Choose one of our prepared scenarios or enter your own event to begin an analysis.
-
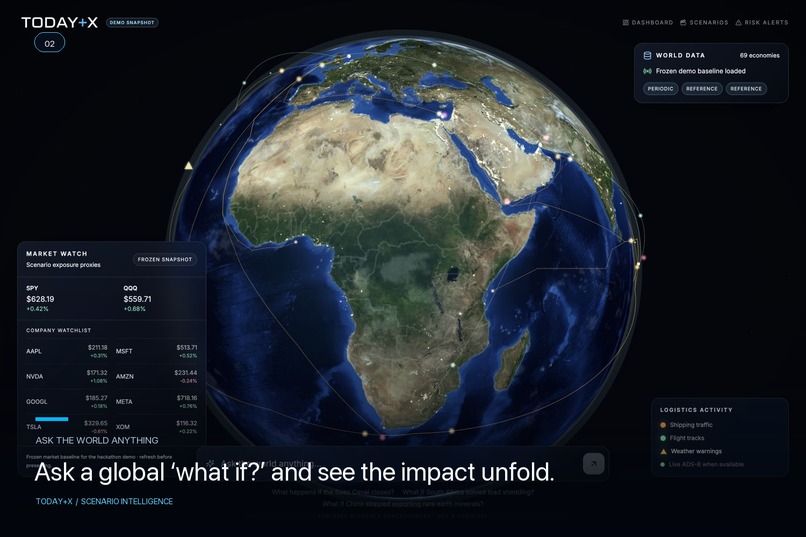
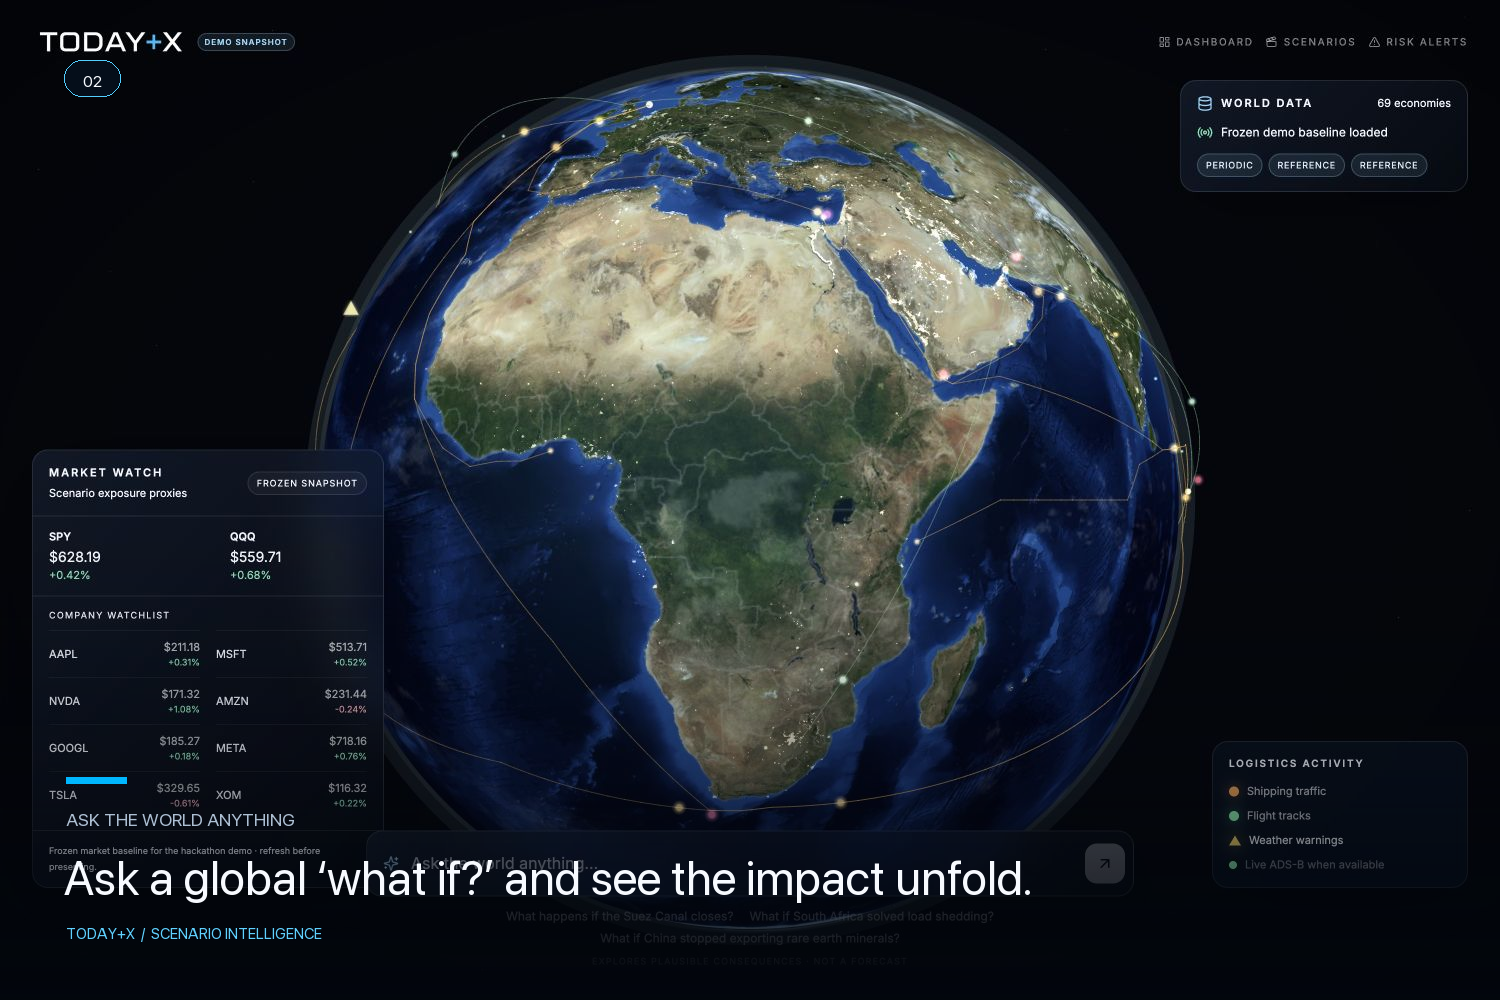
Ask any global “what if?” question and watch the possible effects appear across the globe.
-
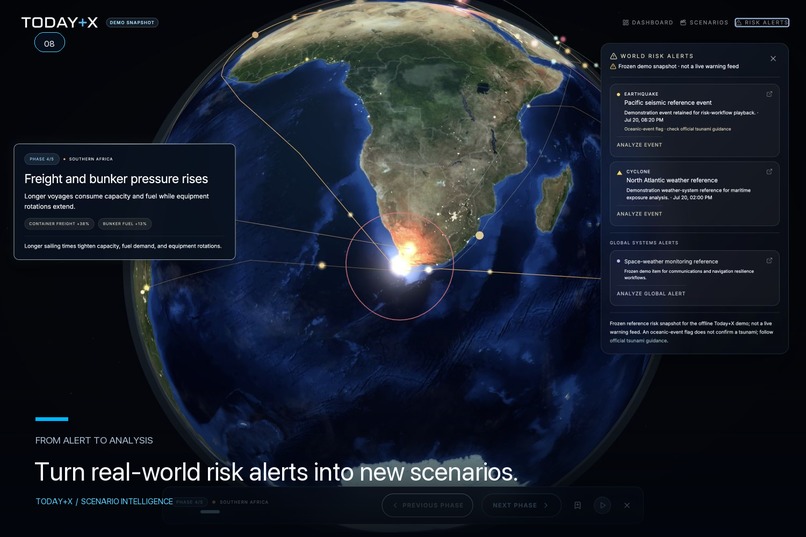
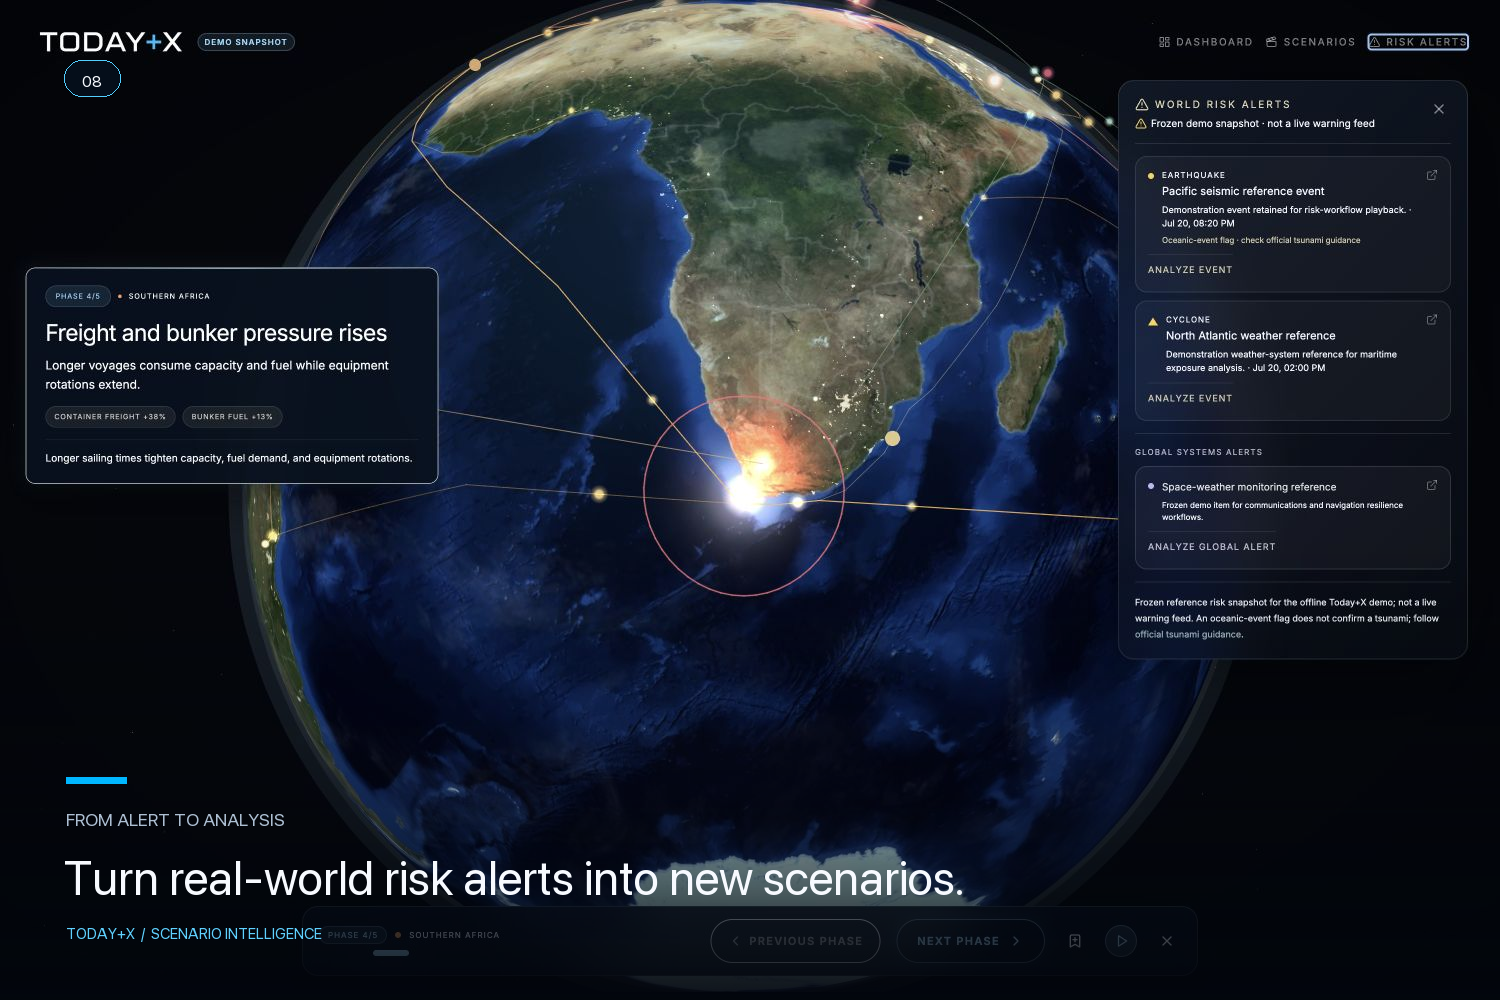
Risk alerts provide a starting point for exploring the wider effects of earthquakes, storms, and other events.
-
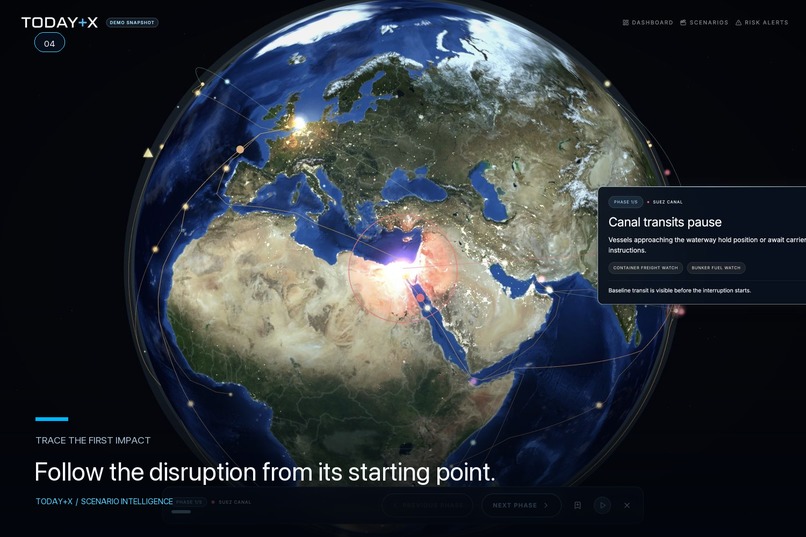
Each scenario starts at the source, then explains what could happen next and why.
-
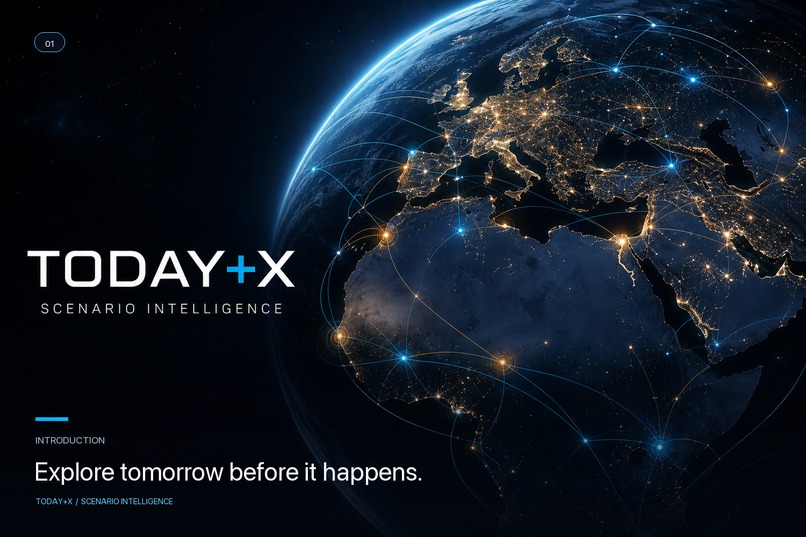
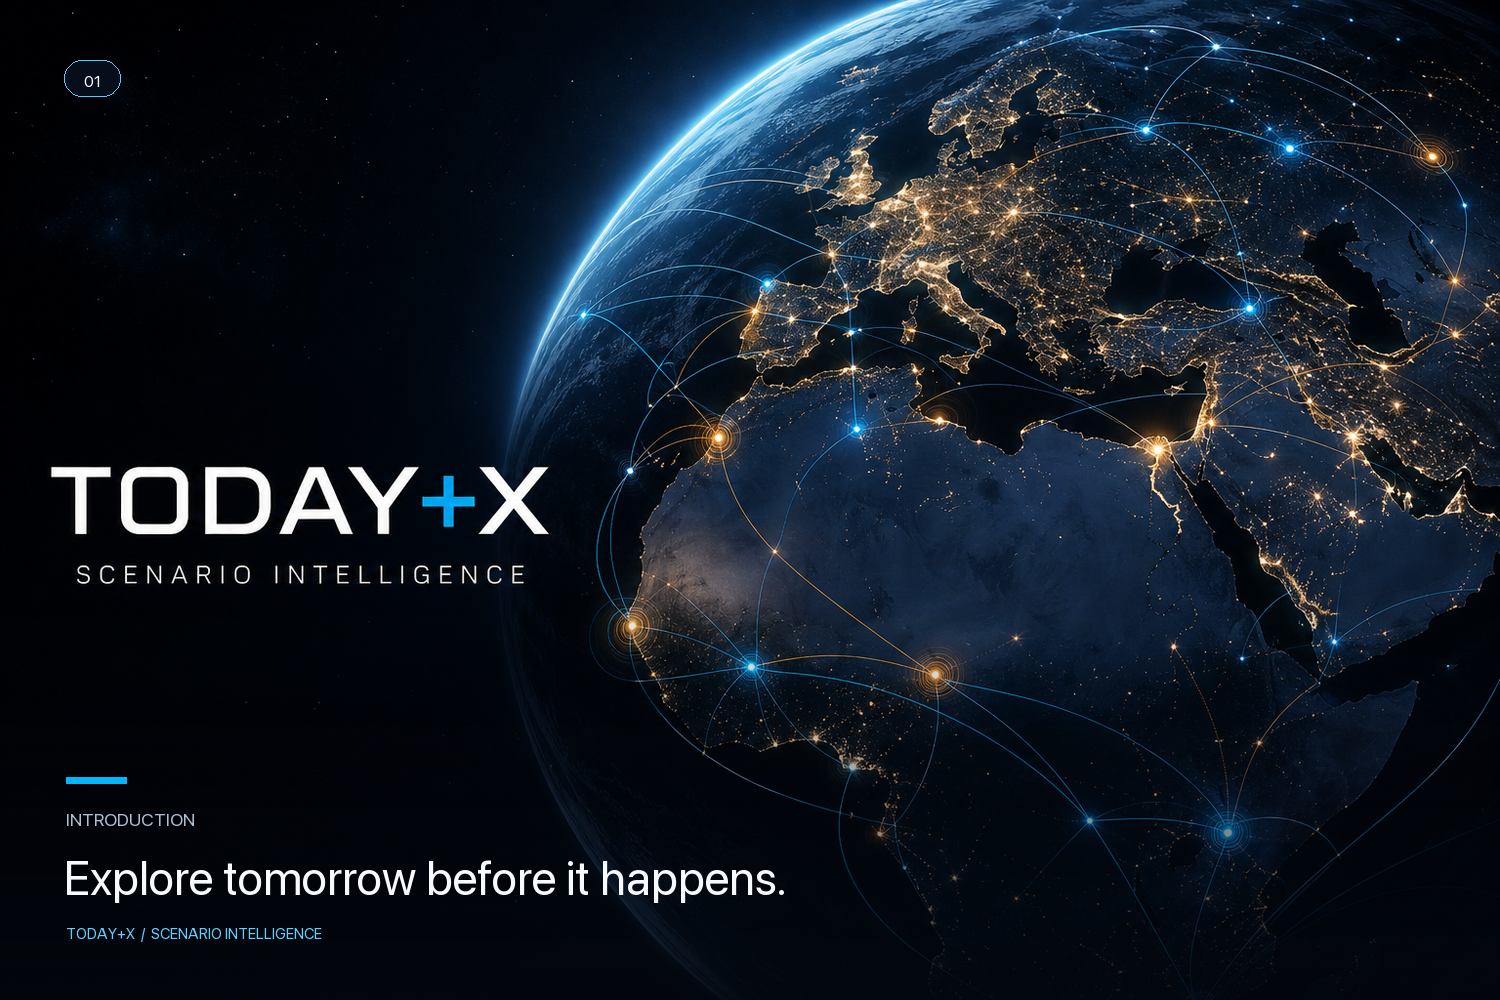
Today+X helps people explore how events happening today could shape the world tomorrow.
-
Hire me Please :) Built this on Part Time, and I love this. Have a Good Day :)
Inspiration
The world is full of consequential “what if?” questions:
- What happens if a major shipping route closes?
- How could an energy shock spread across markets?
- Which regions and industries might feel the effects first?
Traditional dashboards show what has already happened, while forecasts can hide uncertainty behind a single confident answer. We built Today+X to create a more transparent way to explore plausible futures—not as predictions, but as structured scenarios people can inspect, question, and understand.
What it does
Today+X transforms a natural-language question into an interactive, uncertainty-aware global scenario.
A user describes a hypothetical event, and Today+X uses AI to generate a structured chain of possible consequences. The result is visualized on a cinematic 3D globe through:
- Geographic impact points
- Connections between affected regions
- Step-by-step causal reasoning
- Impact severity and direction
- Confidence levels, assumptions, and uncertainty
- Scenario playback over time
The experience also brings together source-labelled world data, market signals, logistics activity, risk alerts, intelligence briefings, reusable scenarios, and saved analyses.
How we built it
Today+X uses a full-stack architecture designed around a strict scenario contract.
The frontend is built with Next.js, React, TypeScript, React Three Fiber, Three.js, Tailwind CSS, and Framer Motion. It renders the globe, scenario effects, data layers, dashboards, and playback controls.
The backend uses FastAPI, Python, Pydantic, and the OpenAI API. User prompts are converted into a versioned JSON scenario containing locations, causal links, reasoning steps, severity, confidence, assumptions, and uncertainty.
The model does not directly control the interface. Its output must conform to a strict schema and is validated again by the server before the browser receives it. This makes the AI output safer, testable, and predictable to render.
The architecture also supports Neo4j for bounded graph retrieval and is designed to incorporate provenance-aware relational data without giving the model unrestricted database access.
Challenges we ran into
One of the hardest challenges was converting open-ended AI reasoning into something geographically meaningful and visually consistent. Free-form text was not enough—the globe needed precise coordinates, links, intensities, timing, and confidence values.
We solved this by defining a shared, versioned scenario schema used by both the Python API and TypeScript frontend.
Another challenge was communicating uncertainty responsibly. Today+X deliberately avoids presenting generated scenarios as forecasts. Every analysis exposes assumptions and uncertainty so users can distinguish plausible reasoning from verified fact.
Building a detailed real-time 3D experience while keeping the interface responsive was also challenging. We had to balance globe rendering, animated scenario layers, live data requests, playback state, and multiple intelligence panels without overwhelming the user.
Accomplishments that we're proud of
We are especially proud that Today+X turns a single question into an explorable visual chain of consequences rather than returning another wall of AI-generated text.
We also built:
- A cinematic, interactive 3D Earth
- Strict, server-validated AI output
- Transparent reasoning and uncertainty
- Animated scenario playback
- Market, logistics, risk, and intelligence layers
- Saved briefings and a reusable scenario library
- A separate intelligence dashboard for deeper analysis
- Clear separation between sourced data and generated scenarios
What we learned
We learned that the most valuable AI experiences are not necessarily those that sound the most certain. They are the ones that reveal their structure.
Constraining model output made the product more reliable, not less capable. Separating evidence retrieval, AI reasoning, validation, and visualization also gave us an architecture that can evolve as new datasets and analytical capabilities are added.
Most importantly, we learned that complex global systems become easier to understand when consequences can be explored spatially and sequentially.
What's next for Today+X
Next, we want to expand Today+X with:
- Deeper provenance-aware knowledge graph retrieval
- More live economic, climate, logistics, and infrastructure data
- Side-by-side scenario comparison
- Collaborative briefings and shareable reports
- User-adjustable assumptions and intervention points
- Scenario branching and counterfactual exploration
- Historical backtesting against real-world events
Our goal is to make Today+X a transparent interface for asking better questions about an uncertain world.
Built With
- fastapi
- framer-motion
- neo4j
- next.js
- openai-api
- pydantic
- python
- react
- react-three-fiber
- tailwind-css
- three.js
- typescript


Log in or sign up for Devpost to join the conversation.