-
-
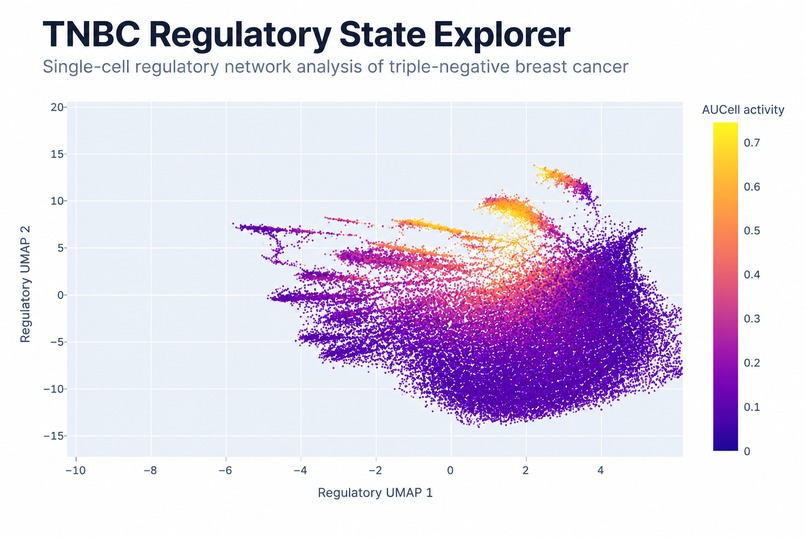
TNBC Regulatory State Explorer — single-cell regulatory landscape of MDA-MB-231 cells.
-
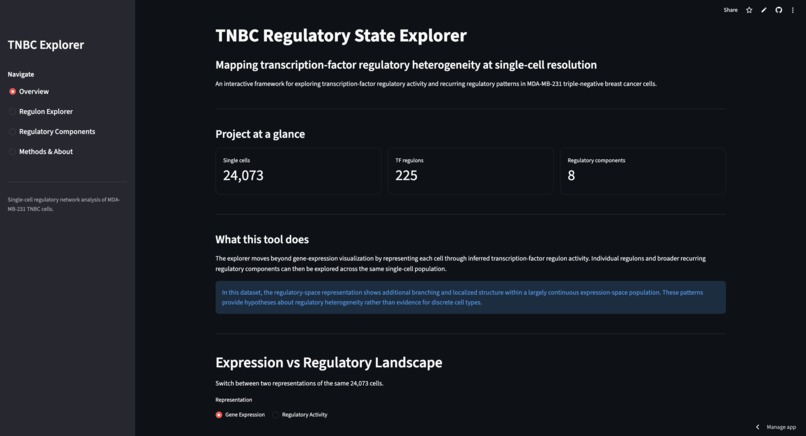
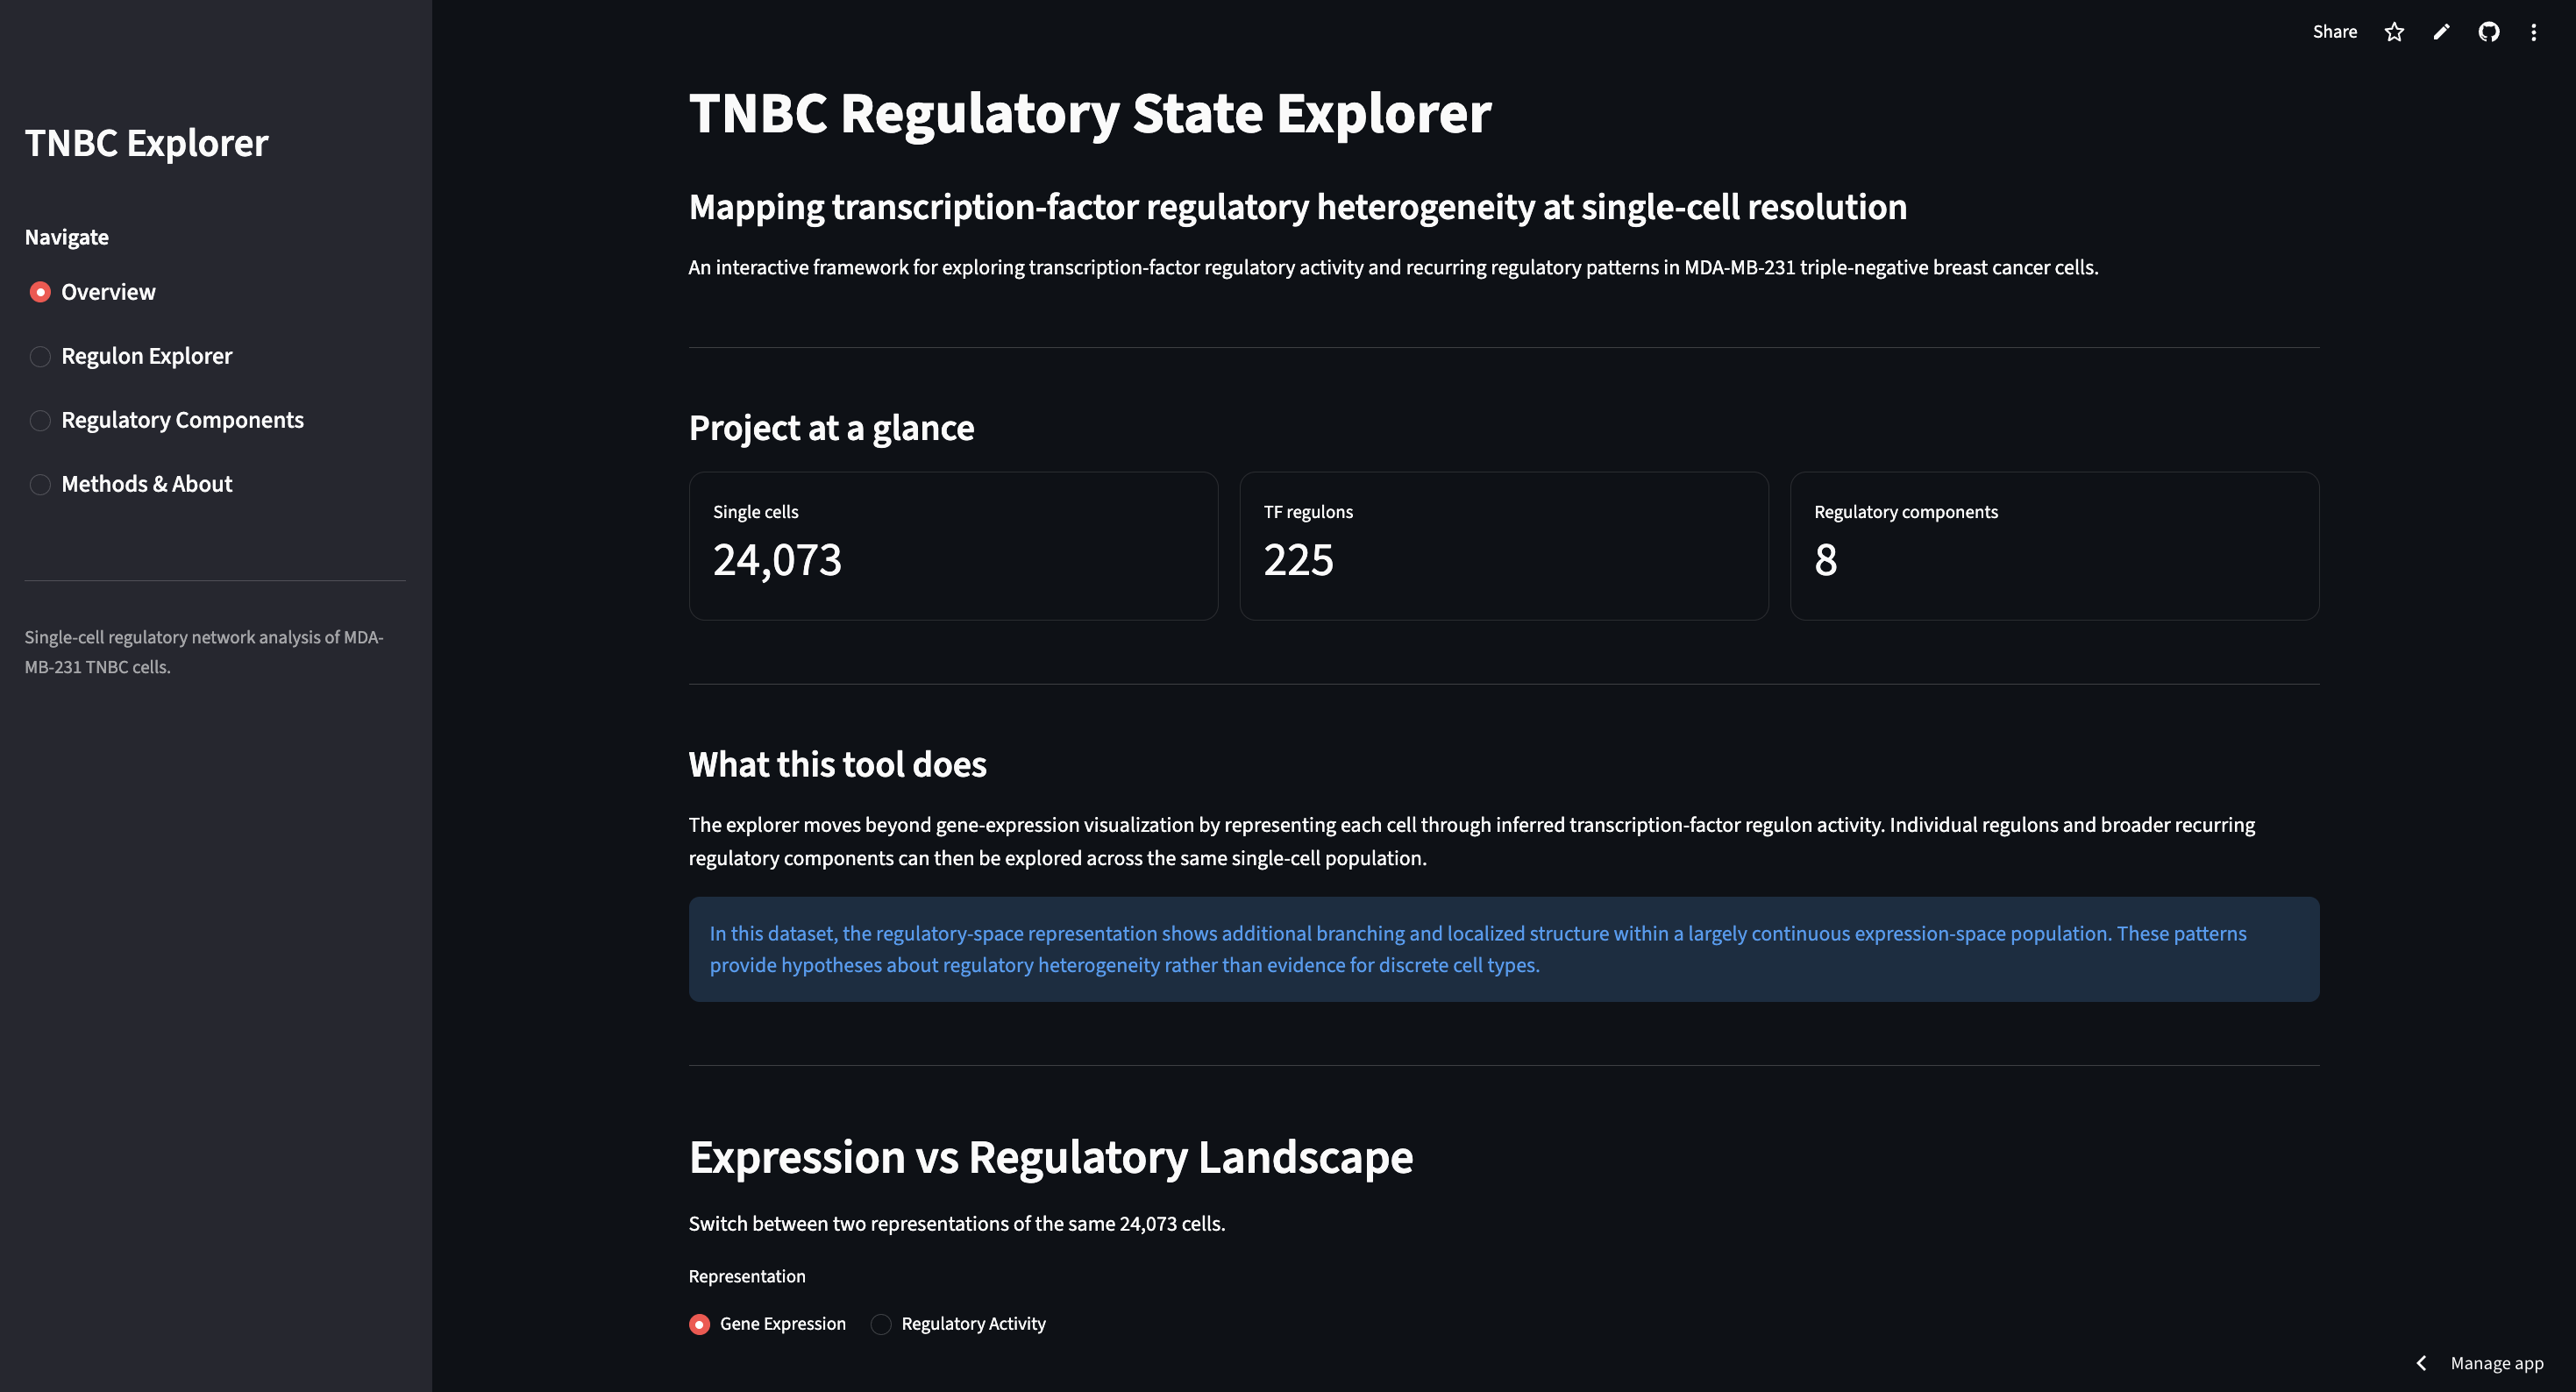
Interactive explorer for investigating transcription-factor activity and regulatory heterogeneity in TNBC.
-
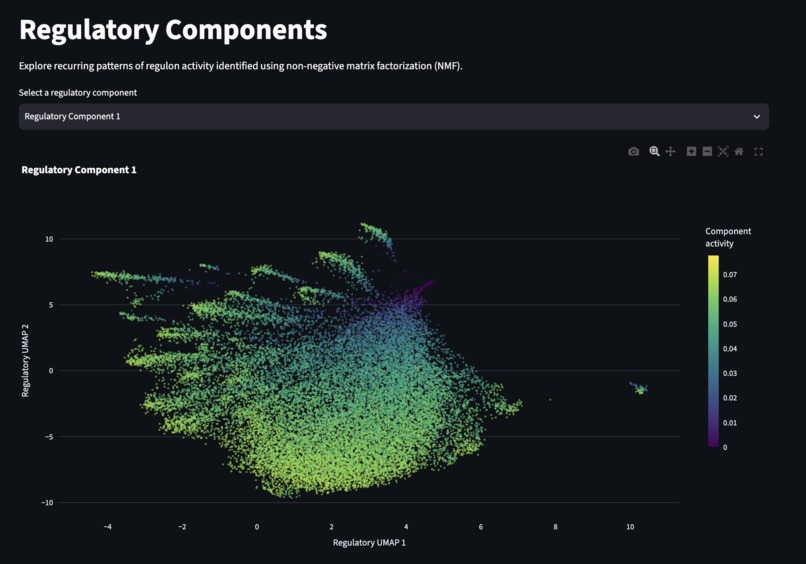
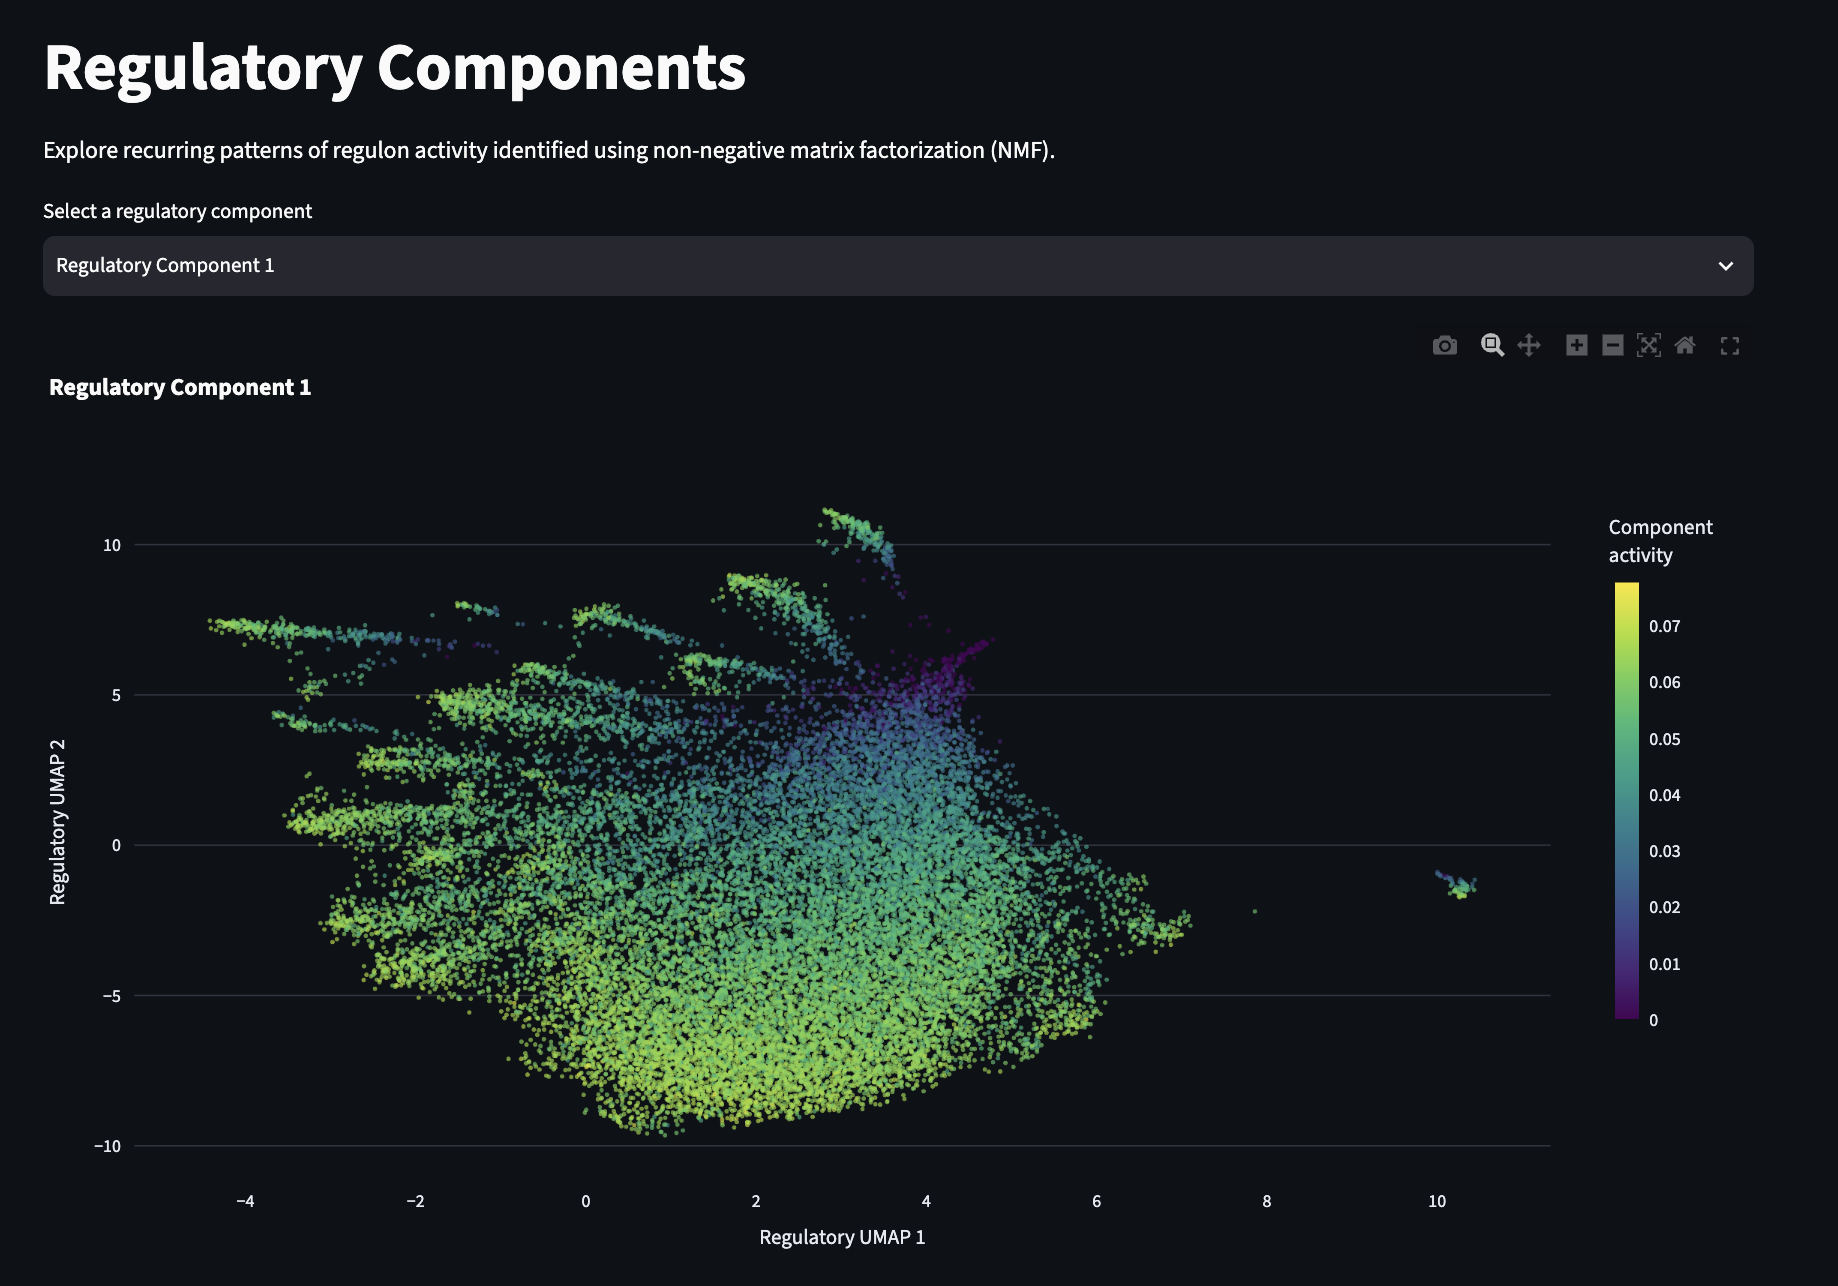
NMF-derived regulatory components reveal broad gradients and localized regulatory patterns.
-
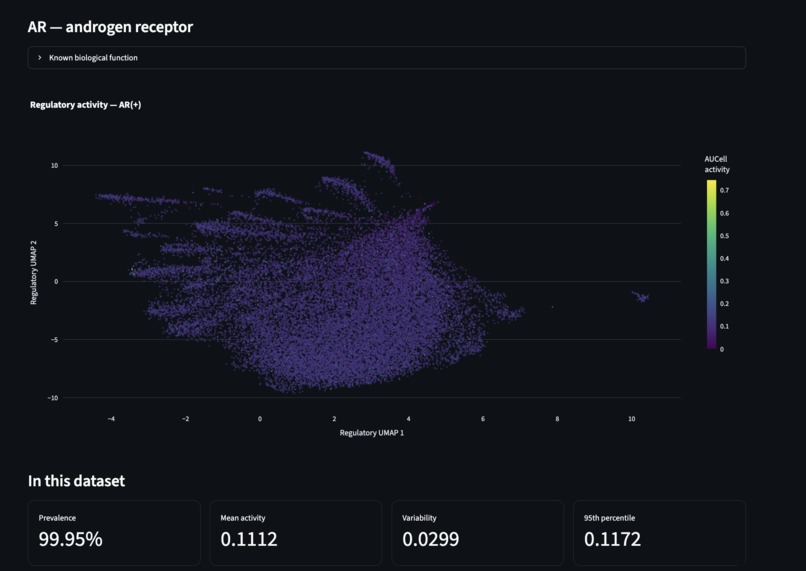
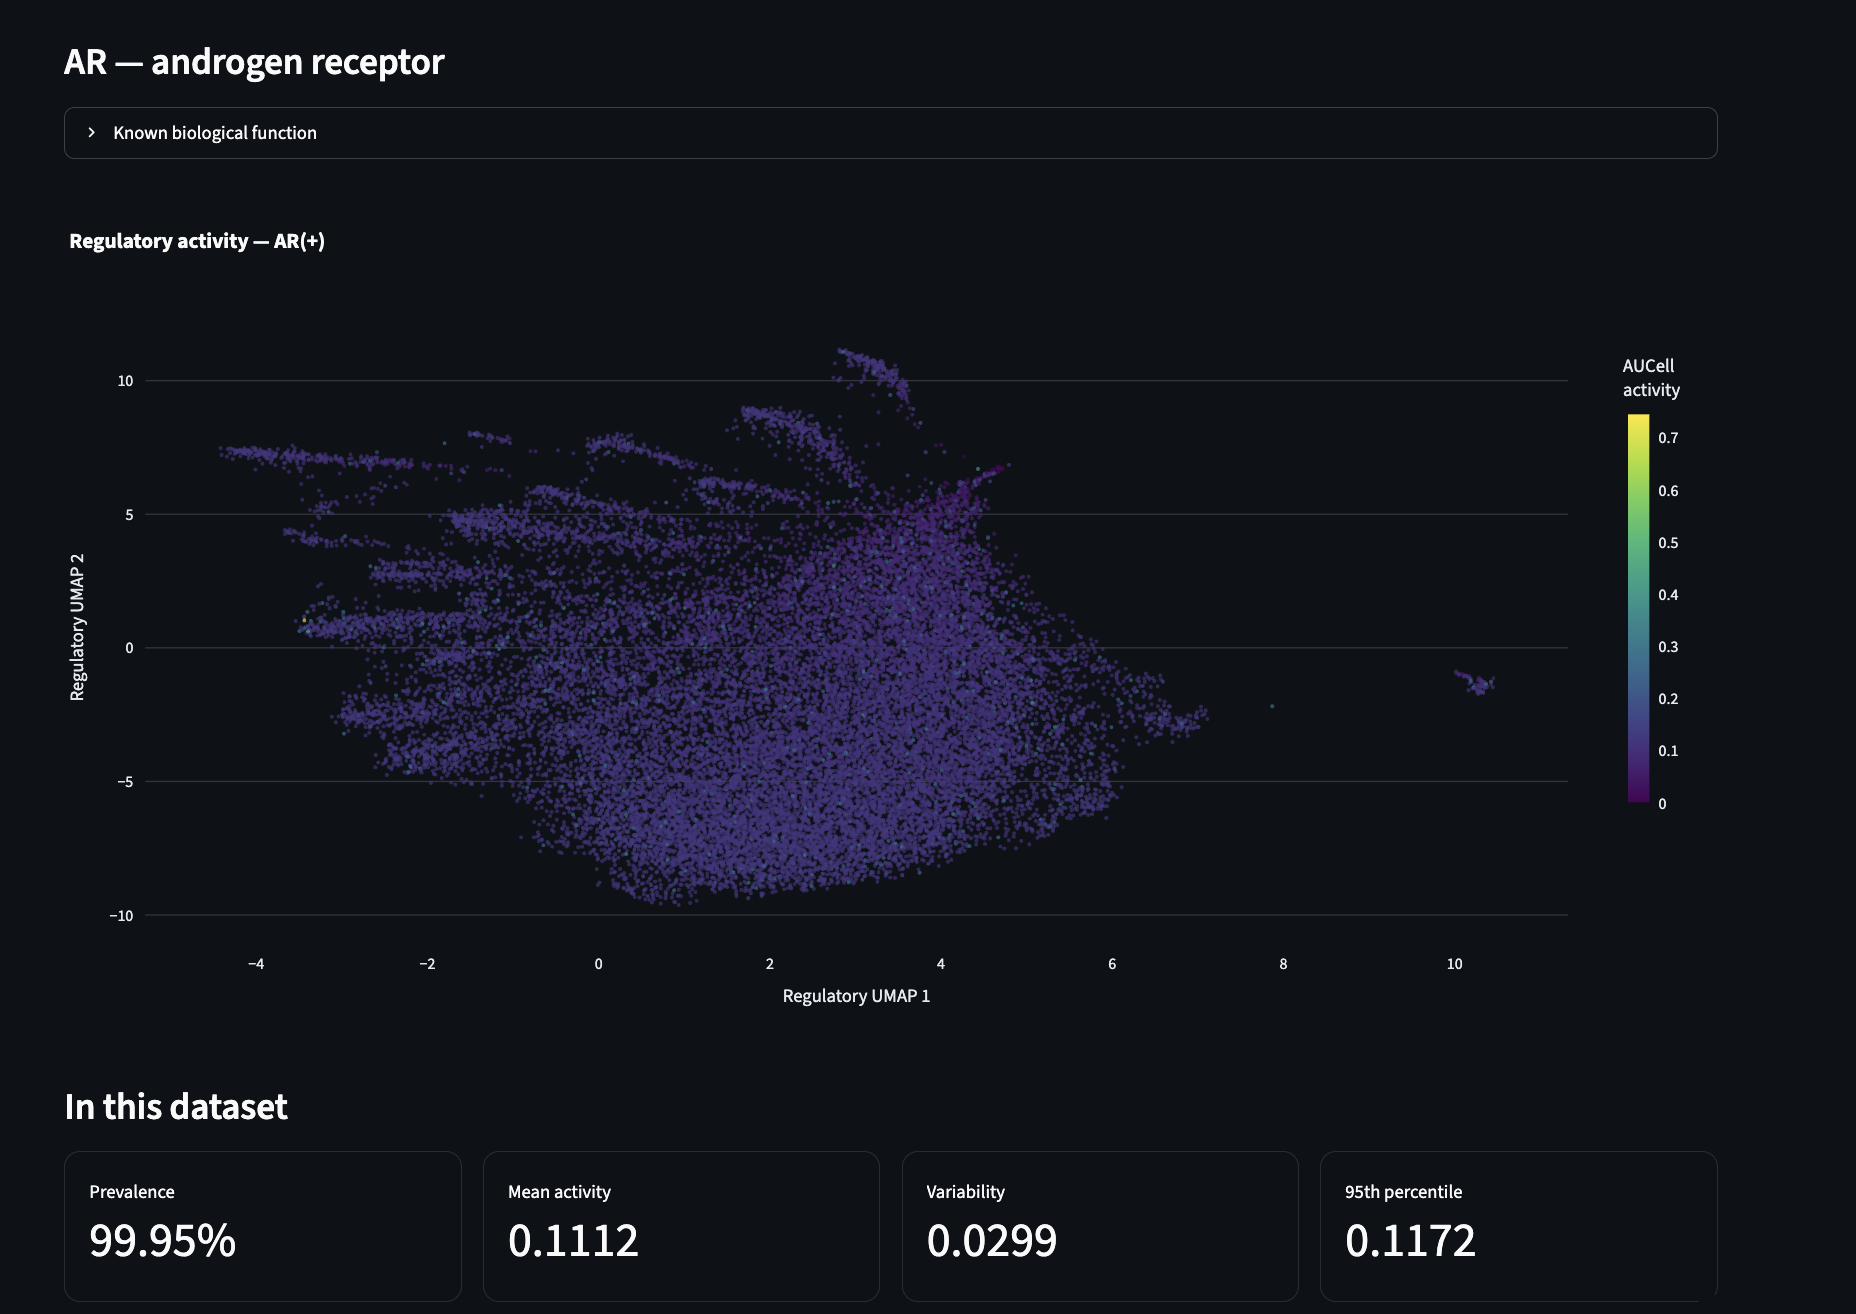
Explore the activity and prevalence of any of 225 inferred TF regulons across individual cells.
-
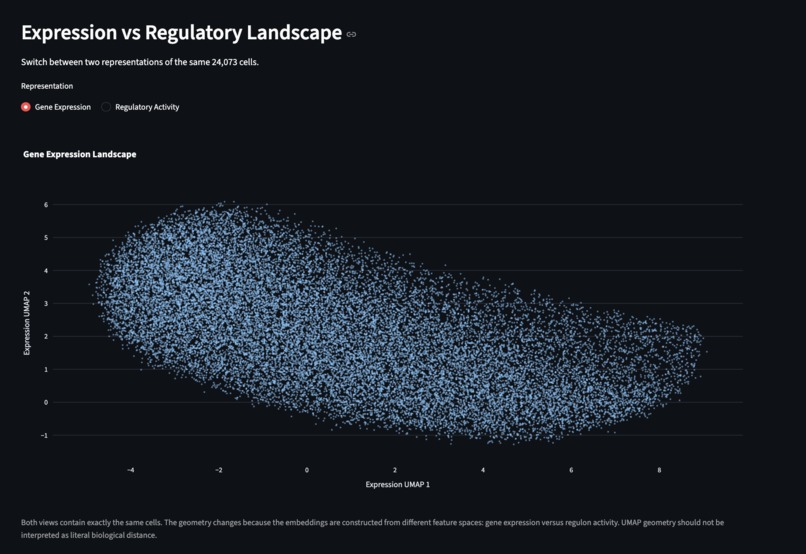
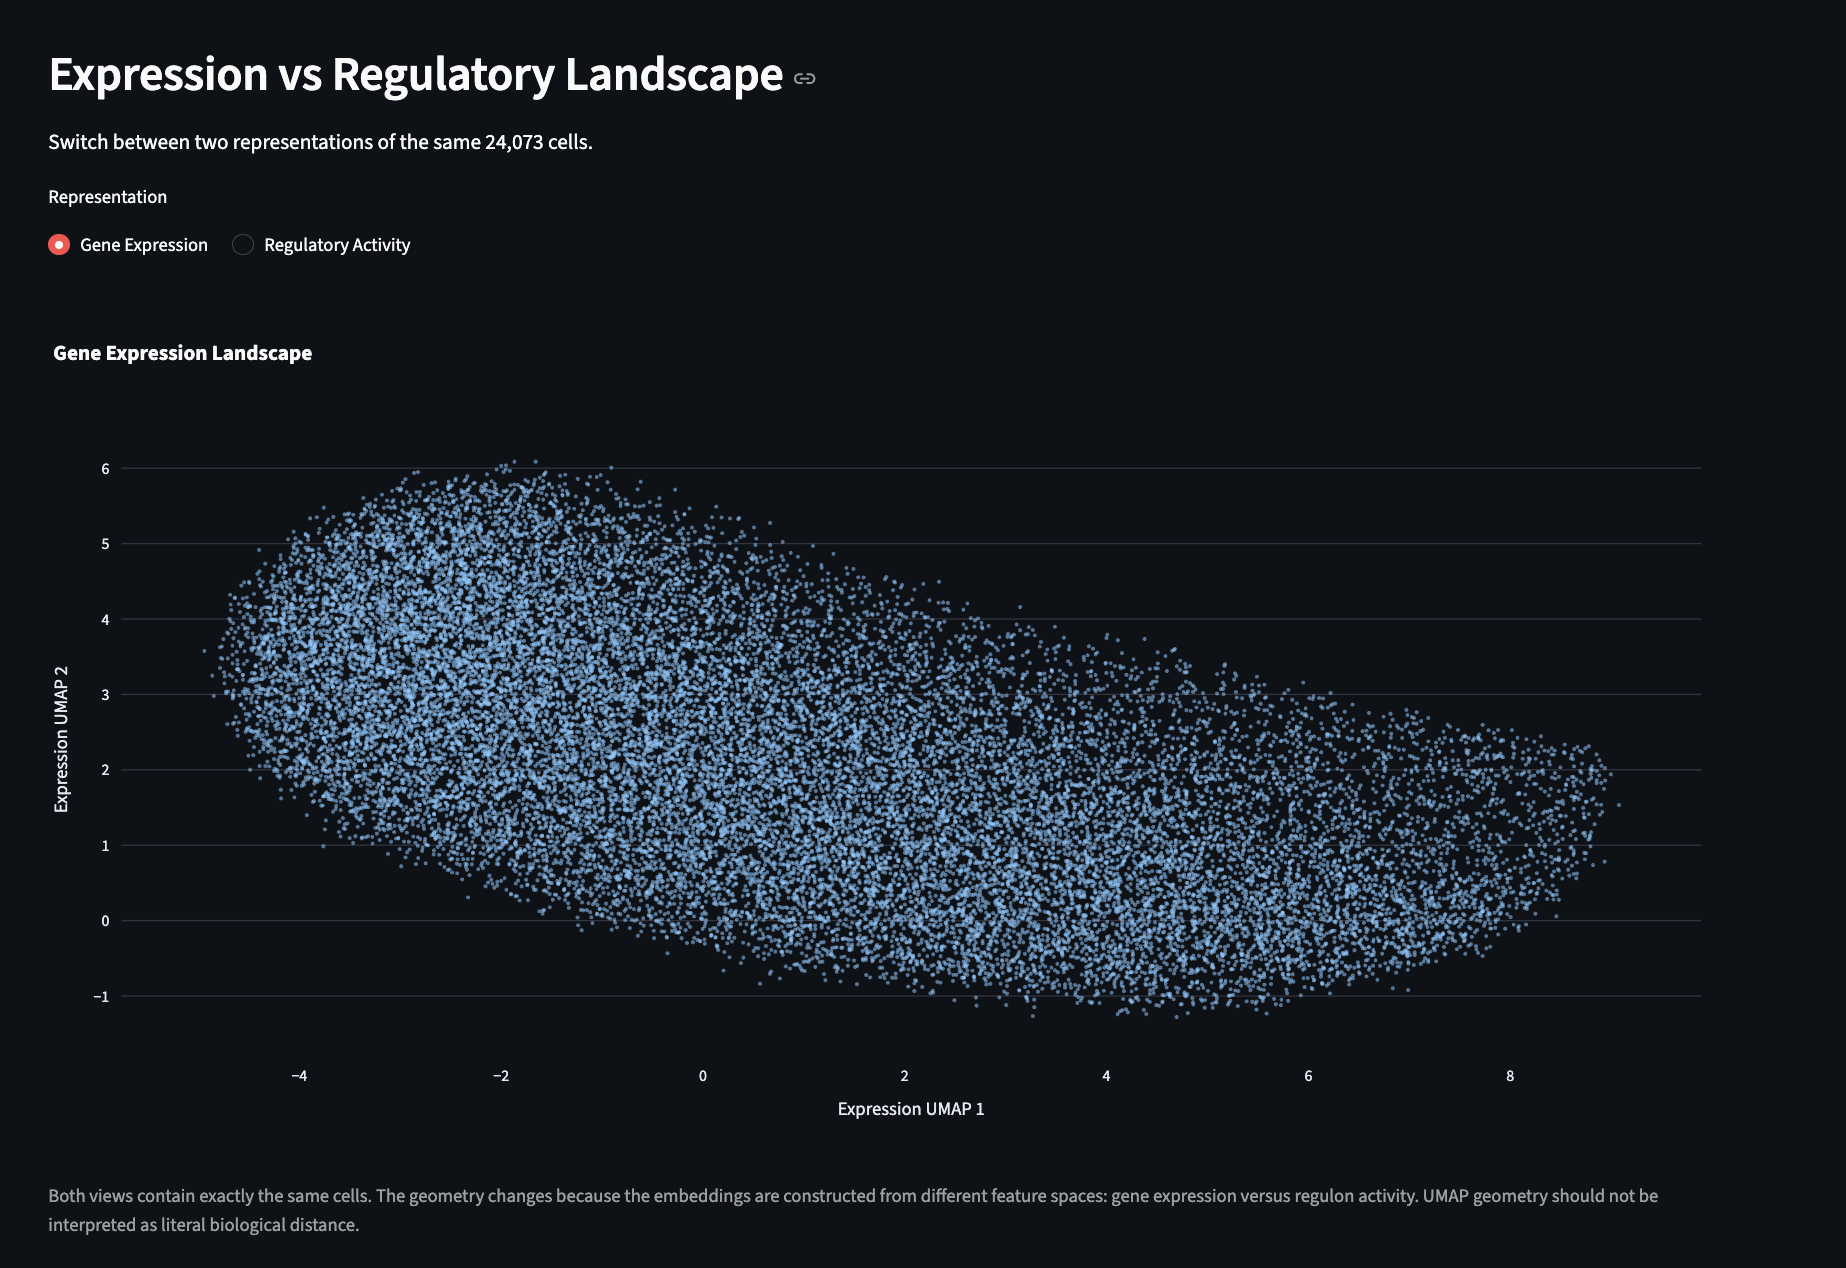
Expression-space view of the 24,073 MDA-MB-231 cells.
-
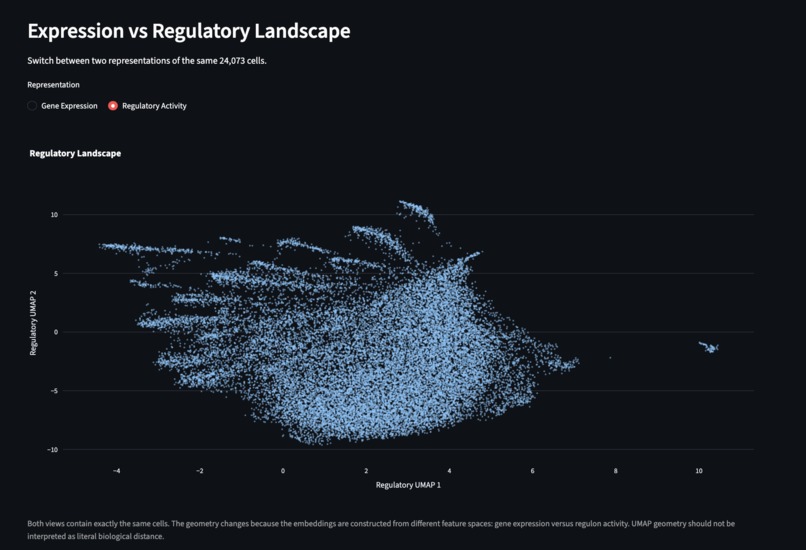
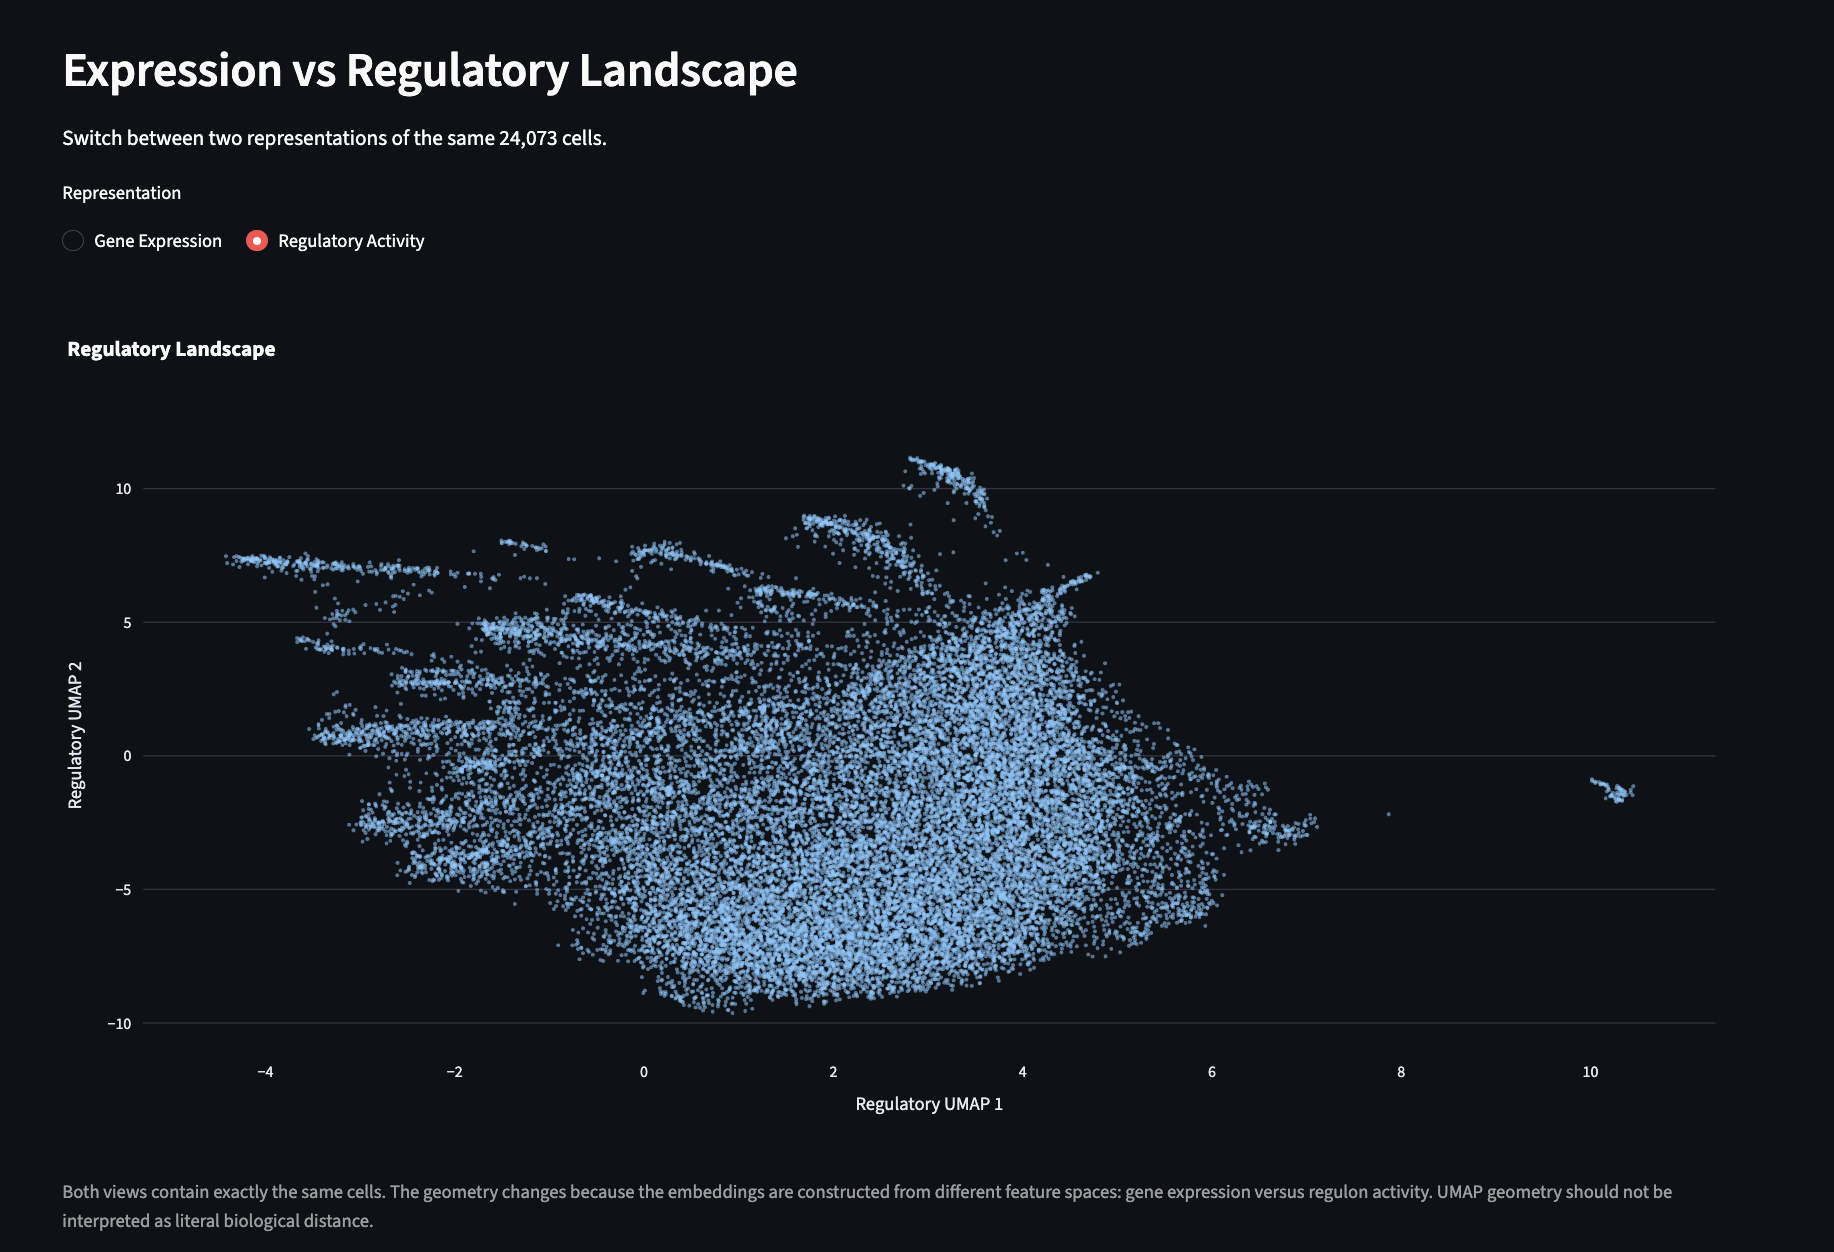
Regulatory-space view of the same cells reveals additional branching and localized structure.
Inspiration
This project started with something I observed at the bench.
While working with the MDA-MB-231 triple-negative breast cancer cell line, I was struck by how differently cells from the same line could appear and behave. I wanted to understand what might be happening beneath those differences and whether bioinformatics could help me look for an explanation.
I started exploring single-cell RNA-seq data from MDA-MB-231 cells. But looking at gene expression led me to a more interesting question: could some of this heterogeneity be understood through the transcription factors and regulatory programs underlying gene expression?
That question grew into TNBC Regulatory State Explorer — a project connecting an observation I made in the wet lab with single-cell computational biology.
What it does
TNBC Regulatory State Explorer lets researchers explore a cancer cell population through inferred transcription-factor regulatory activity, rather than gene expression alone.
The current implementation analyzes 24,073 MDA-MB-231 cells and reconstructs 225 motif-supported transcription-factor regulons.
The interactive application allows users to:
- compare the same cells in gene-expression and regulatory-activity space;
- explore the activity of any of 225 TF regulons across the regulatory landscape;
- examine regulon prevalence and activity statistics;
- access biological context for individual transcription factors;
- explore 8 NMF-derived regulatory components and their strongest contributing regulons;
- inspect functional enrichment associated with these components.
Instead of leaving the analysis as a collection of static plots and tables, I wanted to make the regulatory landscape directly explorable.
How I built it
After quality control, I analyzed 24,073 cells and 16,432 genes from an MDA-MB-231 single-cell RNA-seq dataset.
I used pySCENIC to reconstruct transcriptional regulatory programs. GRNBoost2 first inferred candidate transcription factor–target associations, and cisTarget motif enrichment was then used to refine these associations into motif-supported regulons. This resulted in 225 TF regulons.
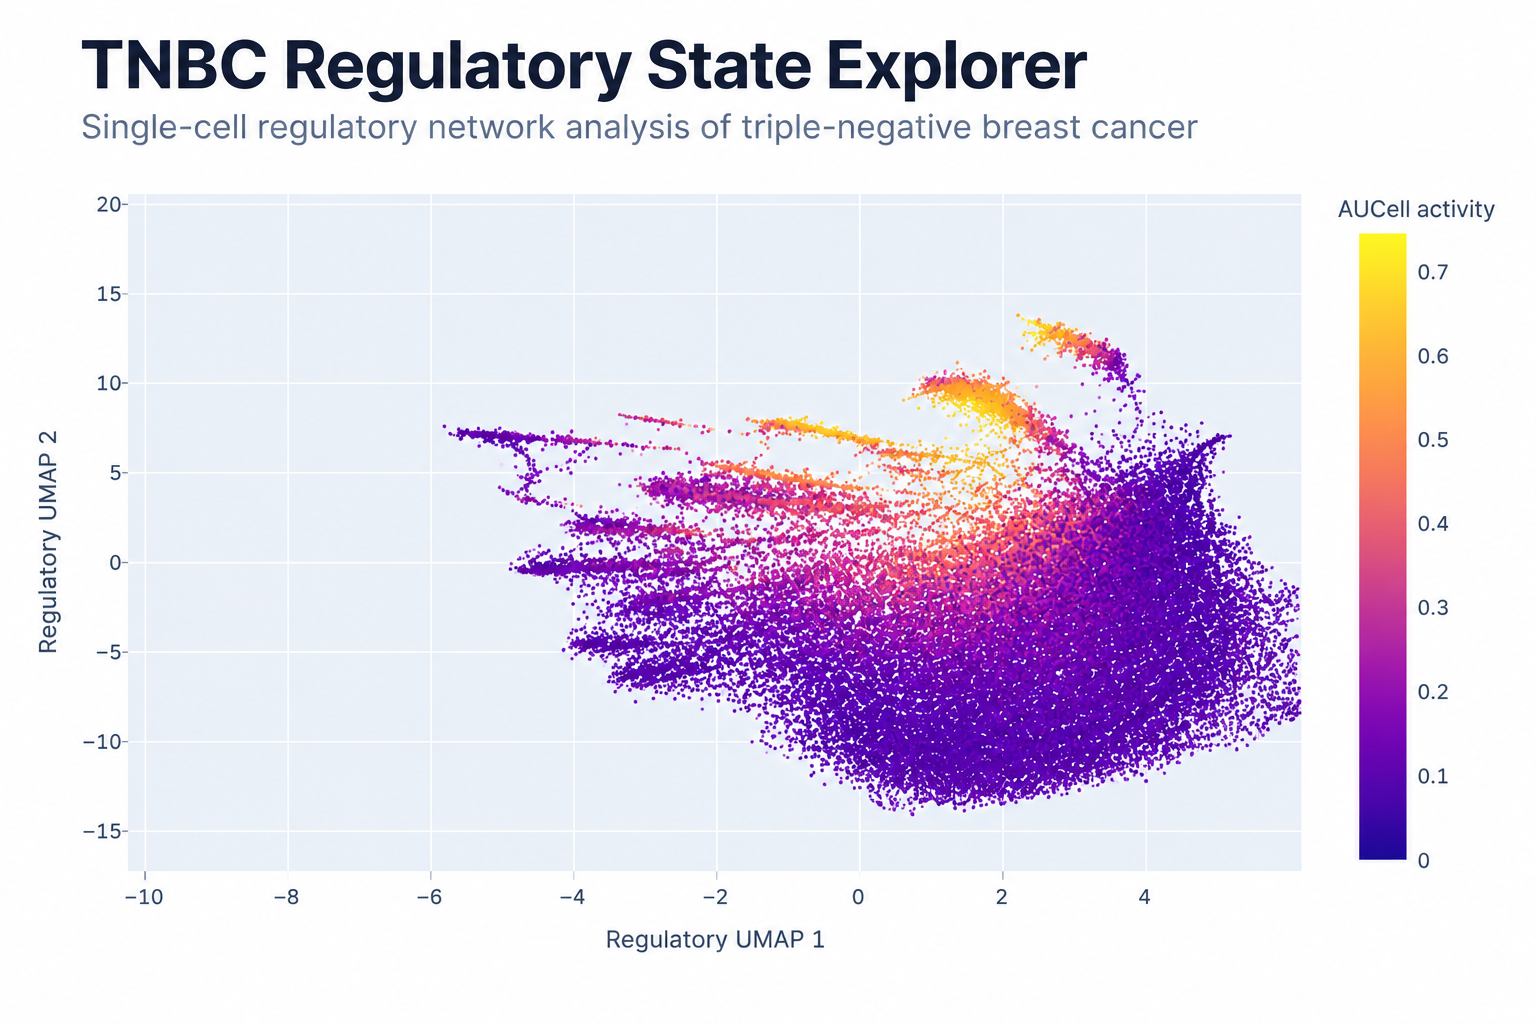
Next, I used AUCell to estimate the activity of every regulon in every individual cell. I analyzed this regulatory-activity representation using PCA and UMAP and compared it with the gene-expression representation of the same cells.
To summarize recurring patterns across the 225 regulons, I applied non-negative matrix factorization (NMF) and retained an 8-component exploratory representation. I also connected top-loading regulons to their motif-supported targets and performed functional enrichment using GO Biological Process, Reactome, and WikiPathways.
Finally, I built the interactive application using Streamlit and Plotly, with precomputed analysis outputs so the results can be explored directly in a browser.
Challenges I ran into
One of the biggest challenges was deciding not just what patterns I could find, but what the data actually justified concluding.
A distinct structure on a UMAP is not automatically a new biological cell state. Motif support does not prove direct TF binding, and AUCell activity is an inferred regulatory score rather than a direct measurement of transcription-factor protein activity.
Another challenge was reducing a landscape of 225 regulons without forcing the cells into arbitrary categories. I therefore treat the 8 NMF components as continuous and potentially overlapping regulatory axes, rather than eight discrete cell types.
There was also a practical engineering challenge: the single-cell outputs were too large to simply load into a web application as-is. I precomputed the analysis and compressed the necessary data to make the final explorer lightweight enough for interactive deployment.
Accomplishments that I'm proud of
The most interesting result was that the regulatory representation did not simply reproduce the gene-expression view of the same cells.
While the expression-space representation formed a largely continuous population, the regulatory representation showed more pronounced branching and localized patterns alongside broad regulatory gradients. This does not establish new cell types, but it highlights regulatory structure that can be prioritized for further investigation.
I also found strongly heterogeneous regulon prevalence: some regulatory programs were detected across almost the entire population, while others appeared only in small subsets of cells. NMF provided a complementary view, capturing both broad multi-regulon patterns and more localized regulatory axes.
Most importantly, I was able to take the project through the entire workflow — from raw single-cell data, to regulatory-network inference, to biological interpretation, and finally to a working interactive application where another researcher can explore the results.
What I learned
This project brought together two sides of biology that I had previously experienced more separately: working with cancer cells experimentally and analyzing biological systems computationally.
I learned how looking at regulatory programs can provide a different perspective on the same single-cell population. At the same time, I learned how important it is to distinguish an interesting computational pattern from a validated biological mechanism.
Building the explorer also changed how I thought about the final product of an analysis. Instead of stopping at figures and notebooks, I wanted to turn the results into something another researcher could actually interact with and use to generate new hypotheses.
What's next for TNBC Regulatory State Explorer
The most important next step is independent validation.
I plan to apply the same framework to additional TNBC cell lines and patient-derived single-cell datasets to determine which regulatory patterns reproduce across biological systems. Reproducible regulatory states or candidate transcription factors could then be prioritized for experimental validation.
The current version is a research and hypothesis-generation tool, not a diagnostic or clinical tool. My longer-term goal is to develop it from a single-dataset demonstration into a broader framework for investigating regulatory heterogeneity in cancer.

Log in or sign up for Devpost to join the conversation.