⚡ GridWise
Know when the Texas grid will be stressed, and what to do about it.
Inspiration
Texas runs its own power grid. ERCOT serves about 90% of the state's load and is mostly cut off from the rest of the country, so when supply gets tight, Texas can't just import power from its neighbors. In February 2021, Winter Storm Uri left more than 4.5 million homes and businesses without power, some of them for days.
The strange part is that the data that could warn people already exists. ERCOT, the EIA and weather services publish demand, wind, solar and price data every hour. But it's raw, technical and scattered, and almost nobody outside the energy industry can read it. Meanwhile, on hot summer evenings demand peaks just as solar fades, and wholesale prices can jump 50–100× in a few hours. Families on time-of-use or variable-rate plans and EV owners feel that on their bills.
We built GridWise around a simple idea: what if everyone in Texas had a 48-hour weather forecast for the grid? Not just "the grid might be tight," but when it will be tight, why, and what to do about it: run the dryer after 10 pm, pre-cool the house before 4, charge the EV overnight.
GridWise turns grid reliability from something people only notice during an outage into an everyday decision they can act on.
What it does
GridWise is an AI-powered grid intelligence platform. It forecasts when ERCOT will be under strain and when real-time prices will spike, 24–48 hours ahead, then turns that forecast into plain-English advice.
The core metric is net load = demand − wind − solar, the part of demand that gas plants have to cover. Net load, more than total demand, is what drives strain and price spikes.
| Feature | What you see | |
|---|---|---|
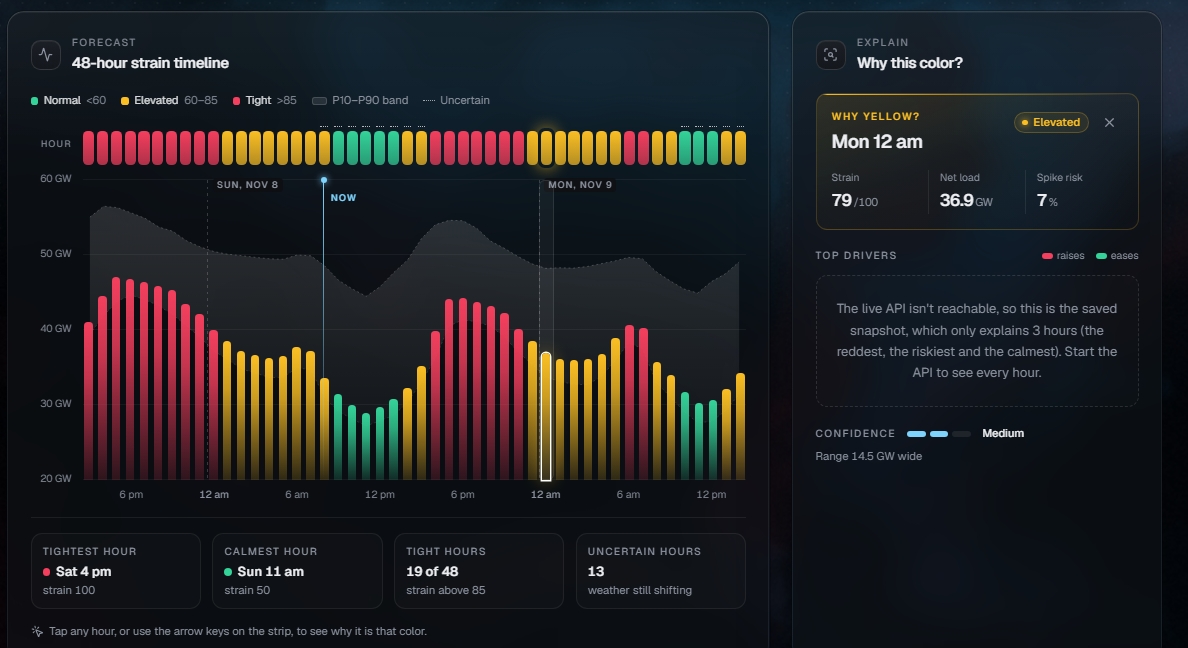
| 🚦 | Strain timeline | The next 48 hours colored green / yellow / red by a 0–100 strain index, with a P10–P90 confidence band |
| 💸 | Price-spike risk | The probability each hour that real-time prices go above $100/MWh |
| 🕐 | Best hours card | The cheapest, lowest-stress windows to run appliances or charge an EV |
| 🤖 | Gemini advice + chat | A daily plain-English plan, plus a chat box: "I need 40 kWh in my car by 7 am. When should I charge?" |
| ❓ | "Why Red?" | Every red hour lists its top 3 drivers (heat, low wind, solar fade), backed by SHAP |
| 📋 | Report card | Yesterday's forecast graded against what actually happened: error, spike hits, band coverage |
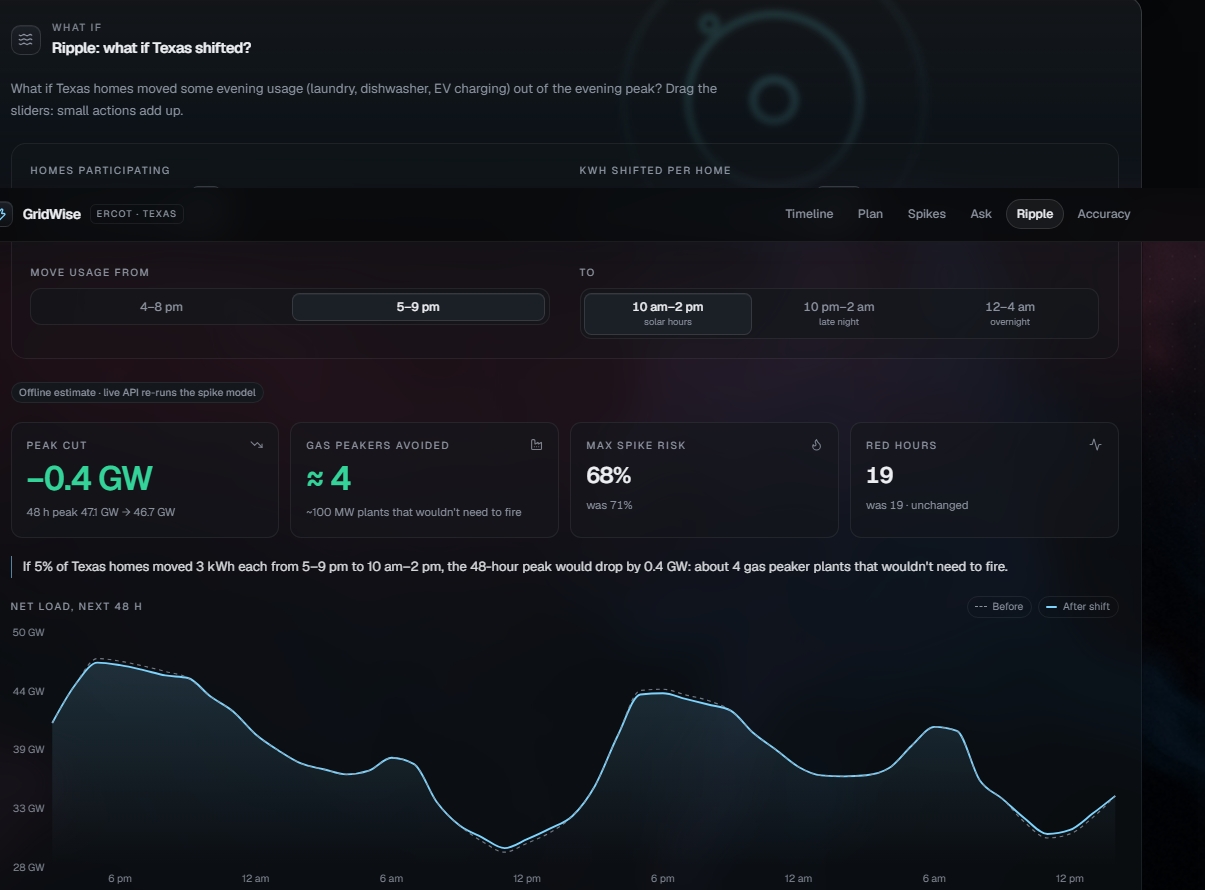
| 🌊 | Ripple simulator | "What if 5% of Texas homes shifted 3 kWh from 4–8 pm to 10 pm–2 am?" Watch the red zone shrink, re-scored by the real models |
| 🔎 | Genie Q&A | Ask the grid's history in plain English: "What was the most strained hour of summer 2025?" |
In practice, GridWise answers:
- When will the grid be stressed tomorrow?
- How likely is a price spike, hour by hour?
- Why is a given hour red?
- What should I do differently, and how much would it help if lots of people did it too?
How we built it
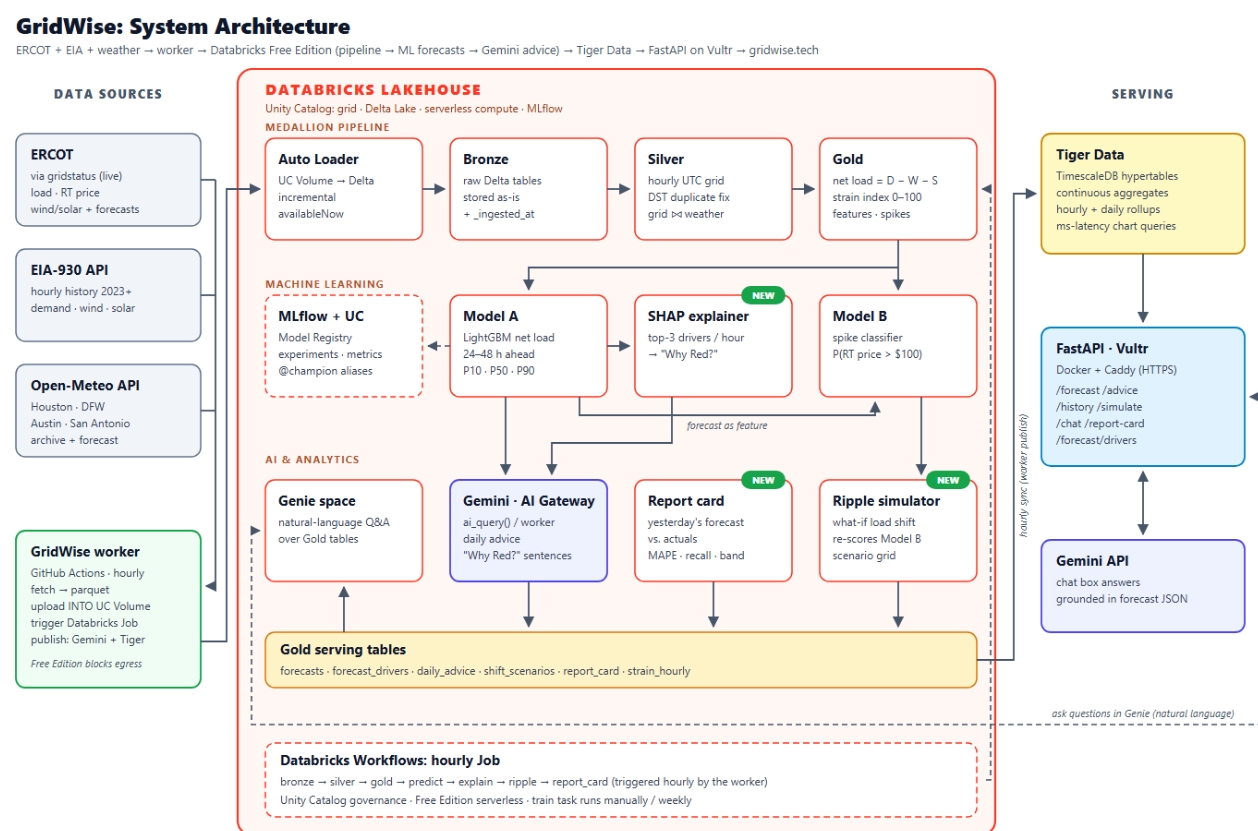
GridWise is a full lakehouse-to-dashboard system with automated hourly data refreshes, real ML models and an AI layer on top.
Ingestion (Python): a worker pulls ERCOT data through gridstatus, EIA-930 hourly demand / wind / solar history, and Open-Meteo weather for Houston, Dallas–Fort Worth, Austin and San Antonio. It lands raw parquet in a Unity Catalog Volume. We backfilled everything from 2023 to today: 33.9k hours of EIA data, 134.6k price rows and 134.5k weather rows.
Lakehouse (Databricks): Auto Loader → Bronze (raw, stored as-is) → Silver (one row per UTC hour, DST-safe, deduped, grid and weather joined) → Gold (net load, strain index, spike events, model features: lags, rolling means, holidays, population-weighted temperature, heat index, cooling and heating degree days).
Machine learning (MLflow + Unity Catalog):
- Model A: three LightGBM quantile regressors that forecast net load 1–48 hours ahead as P10 / P50 / P90.
- Model B: a LightGBM price-spike classifier (
rt_price > $100/MWh). - Model D: a demand forecast we use as our headline accuracy number.
- SHAP TreeExplainer explains every forecast hour, which powers "Why Red?".
AI layer: Gemini writes the daily advice and the "Why Red?" sentences inside the pipeline, and powers the dashboard chat. A Databricks Genie space answers natural-language questions over the Gold tables.
Orchestration: a 9-task Databricks Job runs the whole chain: bronze → silver → gold → predict → explain → ripple → advice → report card.
Serving: forecasts sync to Tiger Data (TimescaleDB hypertables and continuous aggregates). A FastAPI backend serves them, and a Next.js 15 / React 19 dashboard shows them using Tailwind v4, Recharts, Framer Motion and TanStack Query. In production it runs in Docker Compose behind Caddy for automatic HTTPS on a Vultr VM, with the domain on GoDaddy.
The pipeline works like this:
- Pull live ERCOT, EIA and weather data every hour
- Clean it into one row per UTC hour, safe across DST changes
- Compute net load and the strain index
- Forecast net load (P10/P50/P90) and spike probability for the next 48 hours
- Explain each hour's drivers with SHAP
- Precompute 210 Ripple load-shifting scenarios, re-scored by the real models
- Have Gemini turn it all into a plain-English daily plan
- Sync to Tiger Data and serve it to the dashboard
Novelty
GridWise isn't just a chart of ERCOT data, it isn't just a model, and it isn't just a chatbot. What's new is how we combine forecasting, explainability, simulation and AI advice into one loop that runs every hour.
Net load, not just demand. Most consumer energy tools look at total demand. We forecast net load, the gap gas plants have to fill once wind and solar are subtracted, because that's what actually predicts strain and price spikes.
Explainable alerts. Every red hour comes with its top 3 SHAP drivers in plain English, plus a confidence band. Users aren't asked to trust a black box.
Ripple: collective action you can measure. Ripple doesn't just say "shifting load helps." It moves real megawatts out of the forecast curve, re-runs Model B on the result and recomputes the strain index, so you see the change in peak MW, spike probability and red hours that the models actually produce.
A forecast that grades itself. The daily report card scores yesterday's forecast against reality (error, spike recall, band coverage), so the system stays accountable.
AI that's grounded in the numbers. Gemini doesn't make up advice. It writes from the structured forecast, the drivers and the best-hour windows the models produced.
Mathematical models
Formula 1: Net load
NetLoad(t) = Demand(t) − Wind(t) − Solar(t) [MW]
This is the target for Model A and the input to the strain index.
Formula 2: Strain index (0–100)
Strain is the percentile rank of net load against all history for the same local calendar month, so July is compared to other Julys and January to other Januarys:
Strain(t) = 100 × PercentRank( NetLoad(t) | all hours in month(t) )
For forecasts, the P50 net load is mapped through stored per-month percentile breakpoints (gold.strain_reference), and a +15 boost is added when spike probability is above 0.5 (capped at 100).
| Level | Strain index | Share of hours, by design |
|---|---|---|
| 🟢 Green | < 60 | ~60% |
| 🟡 Yellow | 60–85 | ~25% |
| 🔴 Red | > 85 | ~15% |
The Gold notebook checks those shares in every month.
Implementation: pipeline/03_gold.py (gold.strain_hourly, gold.strain_reference), ml/05_predict.py.
Formula 3: Probabilistic forecast (quantile loss)
Model A trains one LightGBM booster per quantile q ∈ {0.10, 0.50, 0.90} using pinball loss:
L_q(y, ŷ) = max( q·(y − ŷ), (q − 1)·(y − ŷ) )
This gives a P10–P90 band that should contain the actual value about 80% of the time. On the held-out test set it does: 80.7% coverage.
Implementation: ml/04_train.py.
Formula 4: Ripple load shift
EnergyShifted (MWh/day) = (pct / 100) × Homes × kWh_per_home / 1000
ShiftMW                 = EnergyShifted / window_hours
Homes = 9,000,000 (about ERCOT's residential meter count). ShiftMW is removed from every hour of the peak window (for example 4–8 pm) and added to every hour of the off-peak window (for example 10 pm–2 am), so energy is conserved exactly. Then:
NetLoad_after(t)  = NetLoad(t) + Δ(t)
SpikeProb_after   = ModelB( features with NetLoad_after )
PeakReduction     = max(NetLoad) − max(NetLoad_after)
PeakersAvoided    ≈ max(0, PeakReduction) / 200 MW
The notebook checks energy conservation, and checks that re-scoring the unshifted curve reproduces the original forecast exactly. It also flags a rebound when the moved load becomes the new peak.
Implementation: ml/08_ripple.py → gold.shift_scenarios (210 scenarios), gold.shift_scenario_curves (10,080 hourly rows).
Formula 5: Report card
MAPE         = (100 / n) × Σ |y − ŷ| / y
SpikeRecall  = true spikes caught / all true spikes
BandCoverage = share of hours where P10 ≤ y ≤ P90
Implementation: ml/07_report_card.py.
Results
| Metric | Result |
|---|---|
| Demand forecast, test MAPE | 3.45% |
| Net-load forecast, test MAPE | 11.8% (36% better than the baseline) |
| P10–P90 band coverage | 80.7% (target 80%) |
| Price-spike recall | 0.81 |
| Gold feature table | 33.8k clean hourly rows, 2023 → today |
| Ripple | 210 precomputed scenarios, each re-scored by Model B |
Net load is much harder to forecast than demand. Wind and solar swing a lot from hour to hour, so beating the baseline by 36% on net load was one of our biggest wins.
Architecture
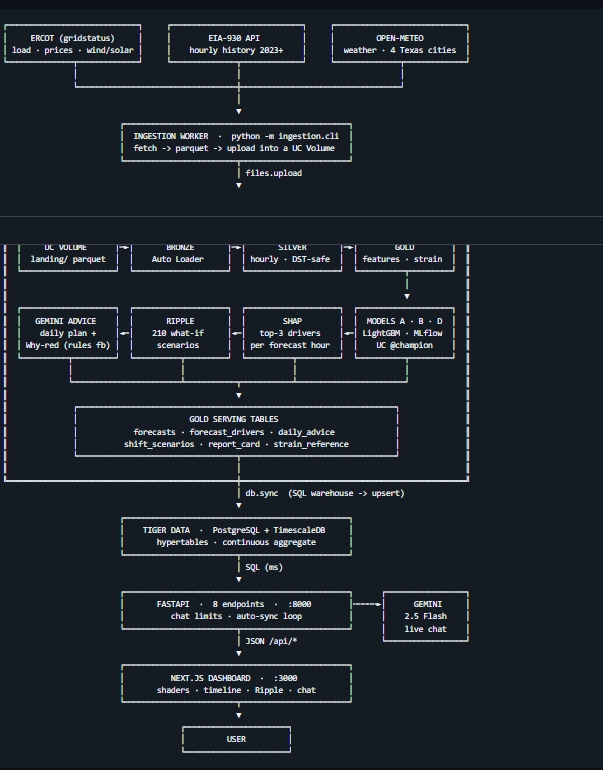
GridWise has four layers, so each one can change without rebuilding the others.
Data layer: ERCOT (gridstatus), EIA-930 and Open-Meteo, landed hourly into Unity Catalog Volumes.
Lakehouse and ML layer (Databricks):
- Bronze → Silver → Gold Delta tables
- MLflow-tracked models registered in Unity Catalog (
@championaliases) - SHAP explanations, Ripple scenarios, report card
- Gemini advice generation and a Genie space for Q&A
- A 9-task Job that runs the whole chain
Serving layer: Tiger Data (TimescaleDB) hypertables and continuous aggregates for fast time-series reads. FastAPI exposes endpoints for health, forecast, explanations, advice, simulation, report card, history and chat.
Experience layer: a Next.js dashboard with the strain timeline, spike risk, best-hours card, "Why Red?", Ripple sliders, report card and Gemini chat.
Key design principles
1. Explainability first. If an hour is red, you should see why. Every alert has drivers, a confidence band and a track record.
2. Action over analysis. A strain index alone doesn't change behavior. "Run the dryer after 10 pm" does. Every forecast ends with something you can do.
3. Honest uncertainty. We show P10–P90 bands, flag low-confidence hours, and publish our own report card, including the days we got it wrong.
4. Correctness at the edges. ERCOT reports in Central time, so every November the 1 am hour happens twice and every March 2 am doesn't exist. A naive join drops or double-counts those hours. We keep the original local time with its UTC offset, convert to UTC before aggregating, and show the check in the Silver notebook.
Challenges we ran into
- Time zones and DST. Getting one clean row per hour across three sources with different time conventions took much longer than we expected.
- Net load is hard to predict. Demand follows temperature nicely. Net load also depends on wind and clouds, which change quickly. Getting it under 12% MAPE took careful feature design and a strict rule that no future information leaks into training.
- Keeping Ripple honest. It would have been easy to fake a "red zone shrinks" animation. We made every scenario go back through the real spike model, and we added checks for energy conservation and exact reproduction of the unshifted forecast.
- Free Edition limits. We fit a 9-task Databricks Job, a Genie space and model serving into Free Edition quotas, with a rules-based fallback so advice still works if Gemini isn't reachable.
- Hackathon time pressure. We shipped ingestion, a medallion lakehouse, three models, an AI layer, a time-series database, an API and a polished dashboard in one weekend.
Accomplishments that we're proud of
We built the full chain:
live grid data → clean lakehouse → probabilistic forecast → explanations → collective-action simulation → AI advice → dashboard
We're especially proud of:
- a 3.45% demand MAPE and a well-calibrated 80.7% P10–P90 band
- Ripple, a what-if simulator re-scored by real models instead of a canned animation
- forecasts that grade themselves every day
- getting DST right, which most grid projects get wrong
- a dashboard that feels like a real product, not a hackathon demo
What we learned
- Good AI products earn trust, not just attention. People act on forecasts they understand. Showing confidence bands and drivers made a bigger difference than any single model tweak.
- The right metric matters more than the fanciest model. Moving from demand to net load changed what the whole system was really measuring.
- LLMs work best on top of structured models. Gemini is great at explaining a forecast and terrible at making one. Splitting those jobs made both better.
- The boring work is the real work. Time zones, deduplication and data contracts are what make the flashy parts possible.
Business impact
GridWise turns grid reliability into a consumer product and a demand-response tool.
- Households on time-of-use or variable-rate plans save money by shifting laundry, dishwashers and pool pumps.
- EV owners charge in the cheapest, cleanest hours.
- Retail electricity providers can offer customers smarter plans and lower their own exposure to price spikes.
- Smart-home and EV-charging companies can use our forecasts to schedule devices automatically.
- Utilities and demand-response programs can use Ripple to estimate how many participants they need to make a measurable dent in the peak.
Small shifts by many homes add up. Ripple shows that, and GridWise gives people the information to do it.
Built with
- Data & ingestion: Python, gridstatus, EIA-930 API, Open-Meteo
- Lakehouse: Databricks, Delta Lake, Auto Loader, Unity Catalog, Databricks Jobs
- ML: LightGBM (quantile regression and classification), MLflow, SHAP
- AI: Google Gemini, Databricks Genie
- Database: Tiger Data (TimescaleDB)
- Backend: FastAPI
- Frontend: Next.js 15, React 19, TypeScript, Tailwind CSS v4, Recharts, Framer Motion, TanStack Query
- Infra: Docker Compose, Caddy, Vultr, GoDaddy domain, GitHub Actions
What's next for GridWise
- Smart-device integration: automatically schedule thermostats, EV chargers and pool pumps around red hours
- Push alerts: "Tomorrow 5–8 pm is red, here's your plan" by text or notification
- Bill estimates: connect to real retail rate plans so advice comes with a dollar amount
- Zone-level forecasts: break ERCOT down by load zone (Houston, North, South, West)
- Better weather inputs: add forecast-grade wind and solar irradiance features to tighten the net-load band
- Beyond Texas: extend the same pipeline to CAISO, PJM and other grids
Why GridWise
GridWise isn't just another energy dashboard.
It's a 48-hour forecast for the Texas grid that tells you when it will be stressed, why, and what to do about it, and shows how much it helps when lots of people do it together.
Built With
- databricks
- docker
- eia
- fastapi
- gemini
- openmeteo
- postgresql
- tiger
- timescaledb
- typescript


