Inspiration
The DL challenge describes an aerospace contractor whose printed titanium brackets fail strength tests. I focused on a practical question for a quality engineer: is the printing process changing, or is it consistent but too close to the minimum strength requirement?
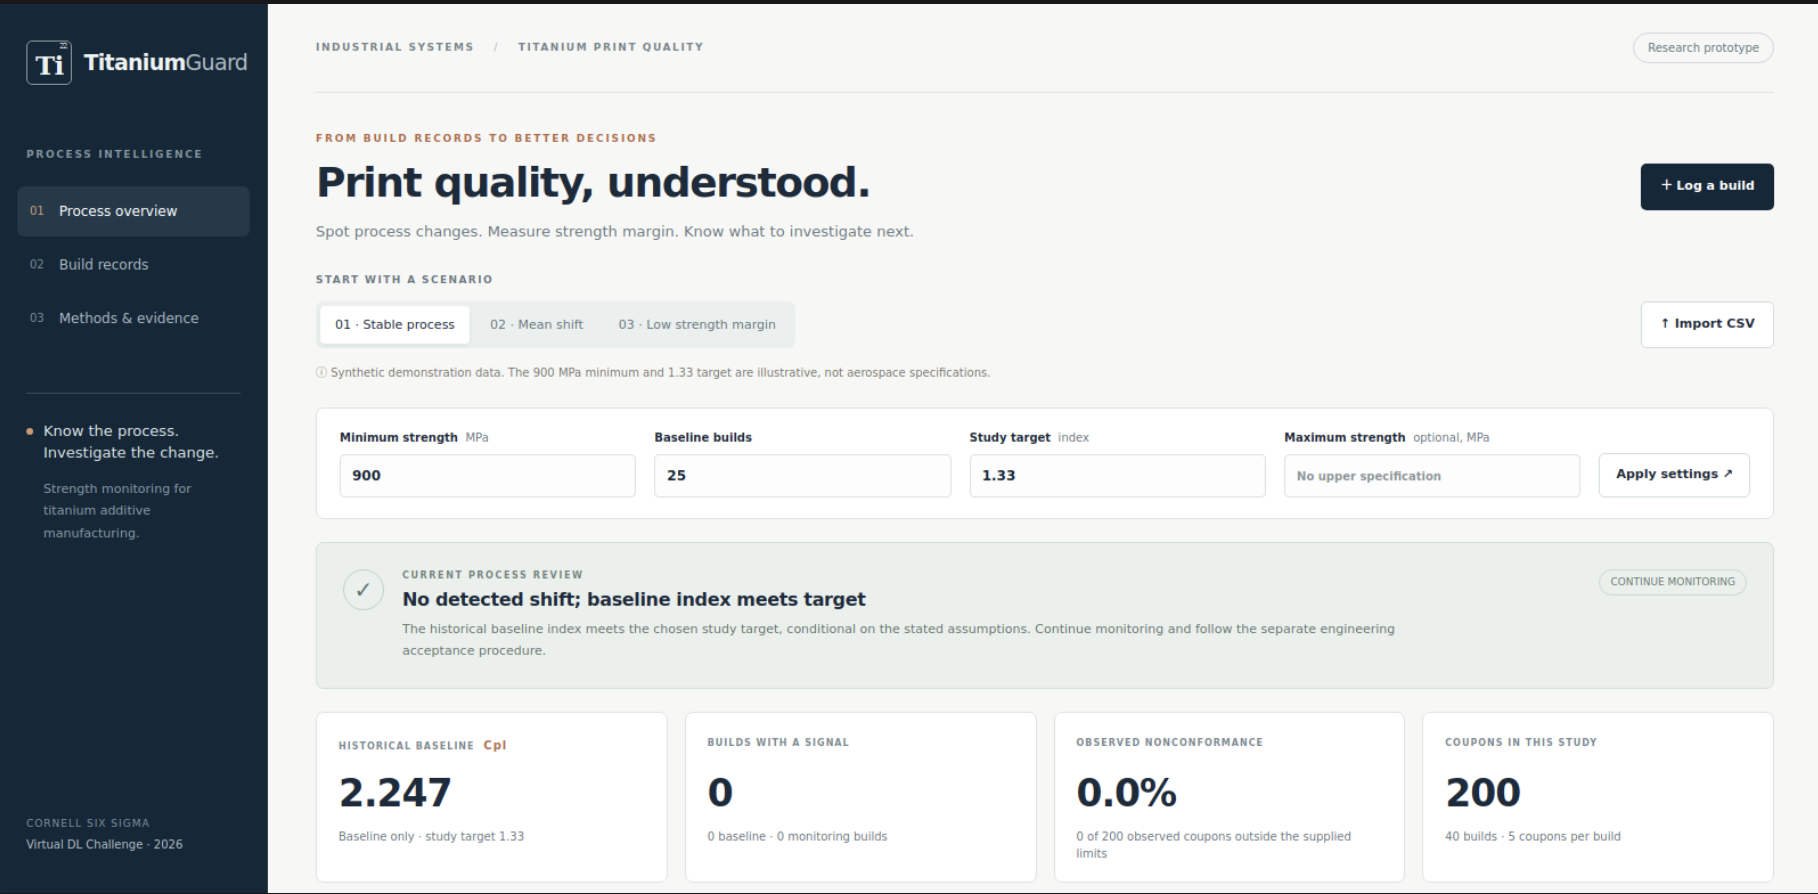
TitaniumGuard uses tensile-test coupons to monitor process strength and keeps build conditions alongside the results for investigation.
What it does
TitaniumGuard is a web dashboard with a Python analysis API. Users can upload a CSV or enter a complete build. The four required CSV columns are build ID, build time, specimen ID and strength in MPa. Optional fields include oxygen readings, laser power, scan speed, machine, powder lot and heat treatment.
The app estimates X-bar and R control limits from a baseline and keeps them fixed when checking later builds. It reports Cpl for a minimum-only strength requirement, or Cp/Cpk when both specification limits are provided. Performance indices based on overall standard deviation are reported separately.
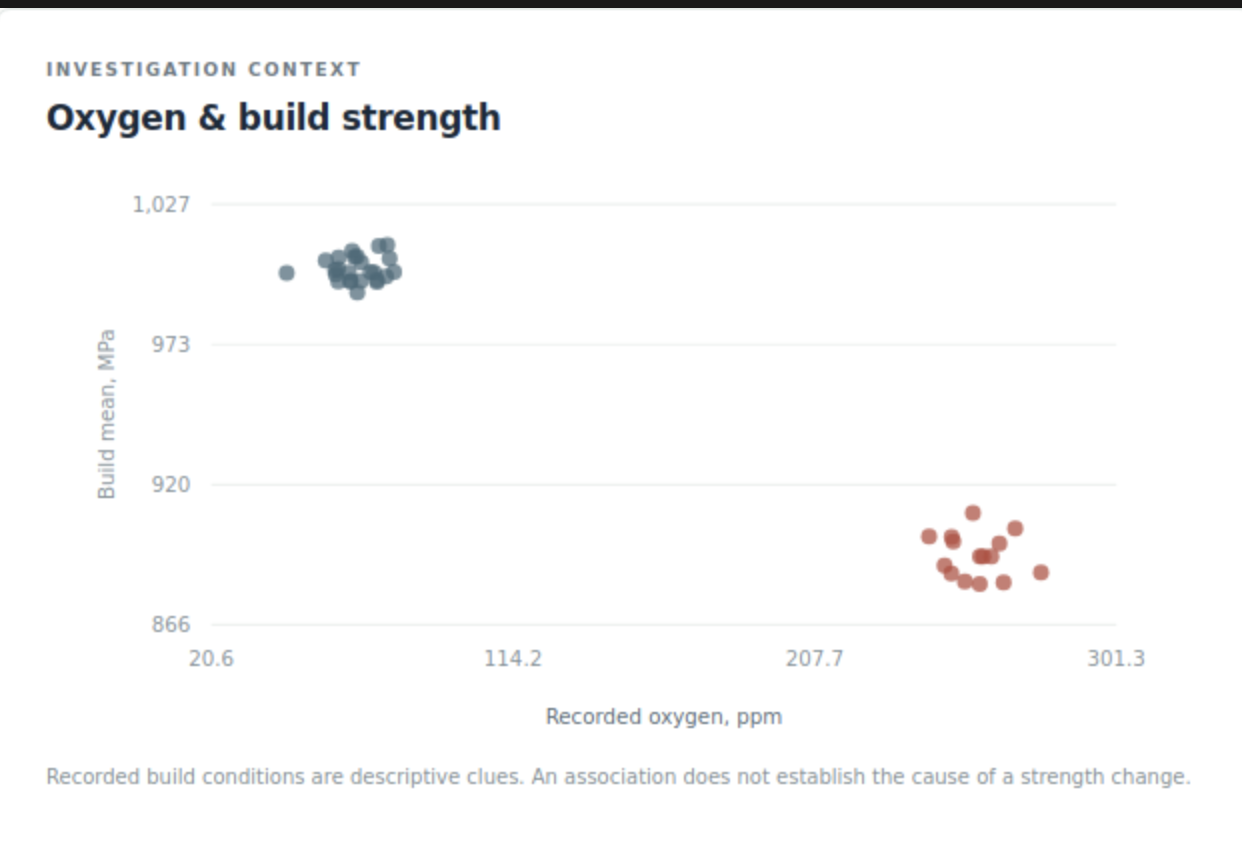
Users can inspect flagged builds, compare oxygen readings with average build strength, and export CSV data and JSON analysis. Records stay in the current browser tab until exported.
How I built it
The project adapts the official FastAPI starter. Python functions perform the statistical calculations, and an HTML/CSS/JavaScript interface displays the results. The application is deployed on the course Posit Connect server.
ChatGPT/Codex assisted with design, implementation, synthetic data generation, tests and documentation. I have personally reviewed the project. The public repository includes source references, a data codebook, reproducible datasets and verification results.
Challenges
One challenge was preventing an abnormal monitoring period from changing its own control limits. Another was using a one-sided capability index when only a minimum strength is specified.
Input validation was also important. Incomplete subgroups, duplicate specimen IDs and invalid settings produce errors instead of silently changing the analysis.
Accomplishments
The prototype demonstrates three scenarios using synthetic datasets, each containing 40 builds with five coupons per build. The first 25 builds form the baseline.
- Stable process: baseline Cpl is approximately 2.247, with no flagged builds.
- Mean shift: 15 builds are flagged beginning at build 26. The historical baseline Cpl remains approximately 2.247, but it does not describe the changed process.
- Low margin: baseline Cpl is approximately 0.418, with no flagged builds.
The verified test suite contains 109 tests: 71 numerical/schema tests and 38 API tests. The demonstration also shows CSV import, complete-build entry and CSV/JSON export.
What I learned
The project highlights why stability and capability must be considered separately. A process can have no control-chart signals and still have insufficient strength margin. A high historical capability index also cannot establish capability after a process shift.
The oxygen plot illustrates another distinction: associated changes provide clues for investigation, but do not prove causation.
What's next
The next step is to validate measurement quality, the sampling plan and coupon-to-bracket representativeness with a contractor. Further development could add persistent storage and corrective-action records.
All demonstration data are synthetic. The 900 MPa minimum and 1.33 target are teaching settings, not aerospace standards. This prototype supports process investigation; it does not authorize part release or certify airworthiness.

Log in or sign up for Devpost to join the conversation.