-
-
Main Dashboard
-
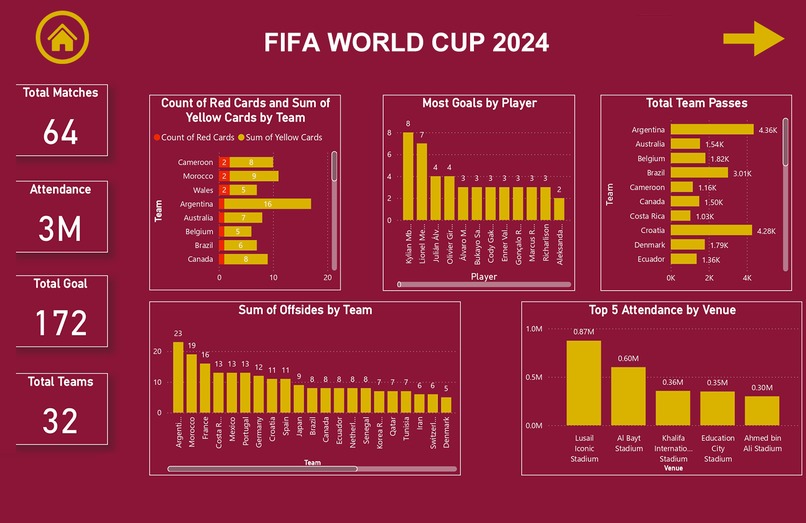
World Cup Overview
-
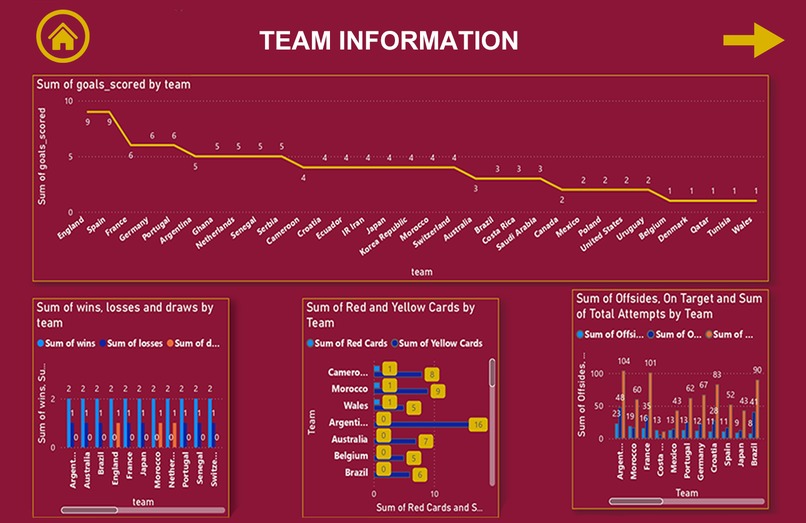
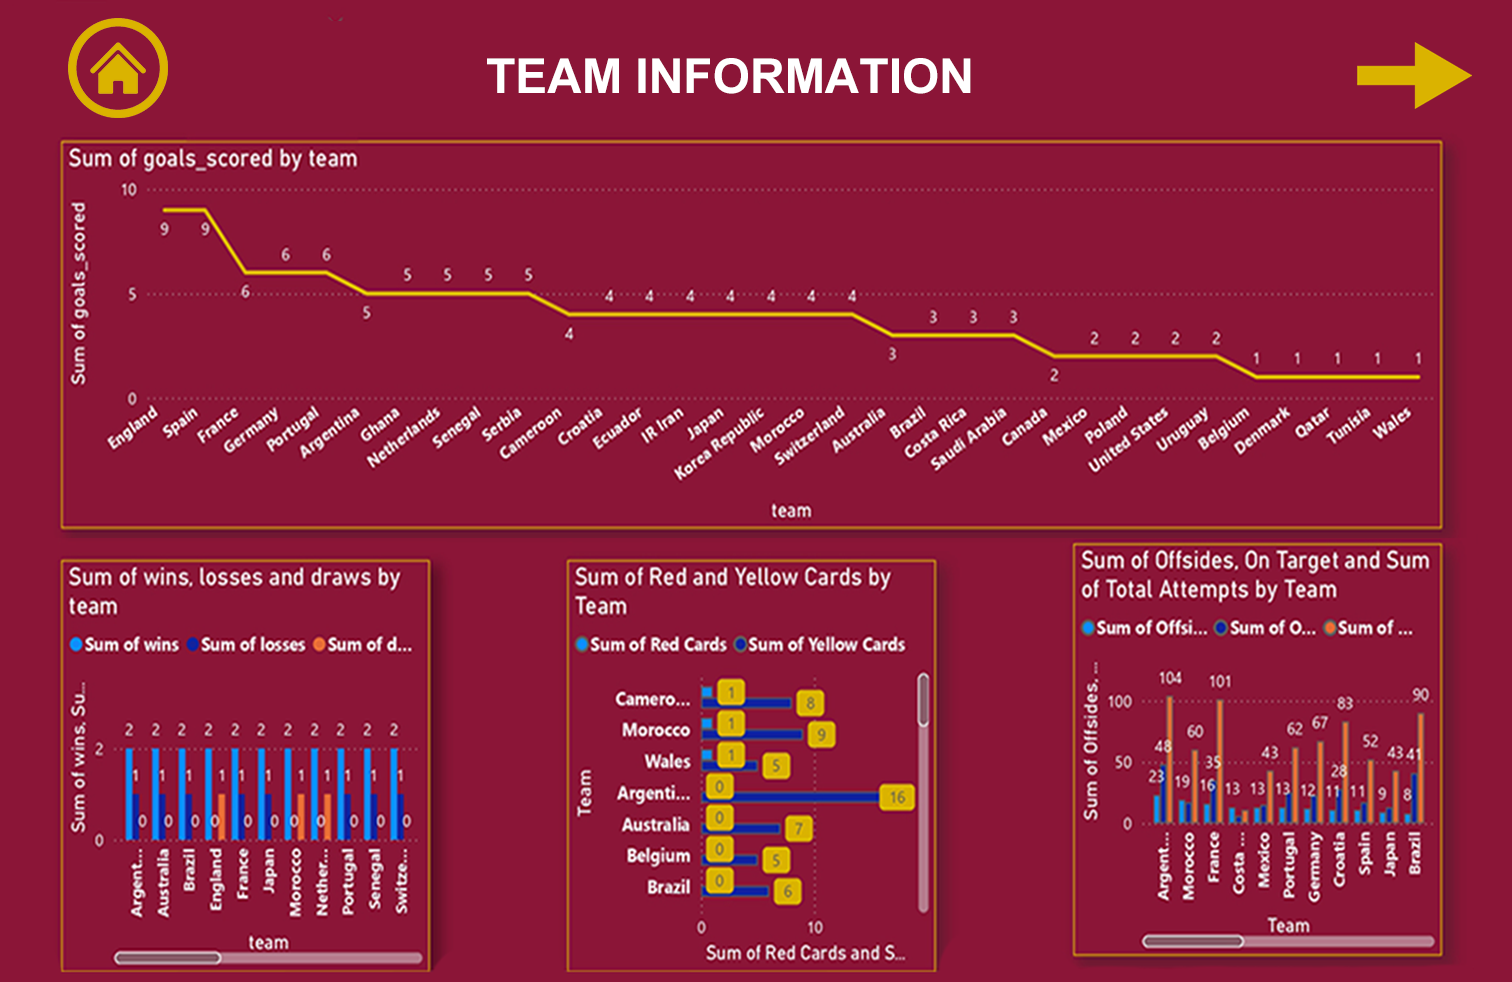
Team Information
-
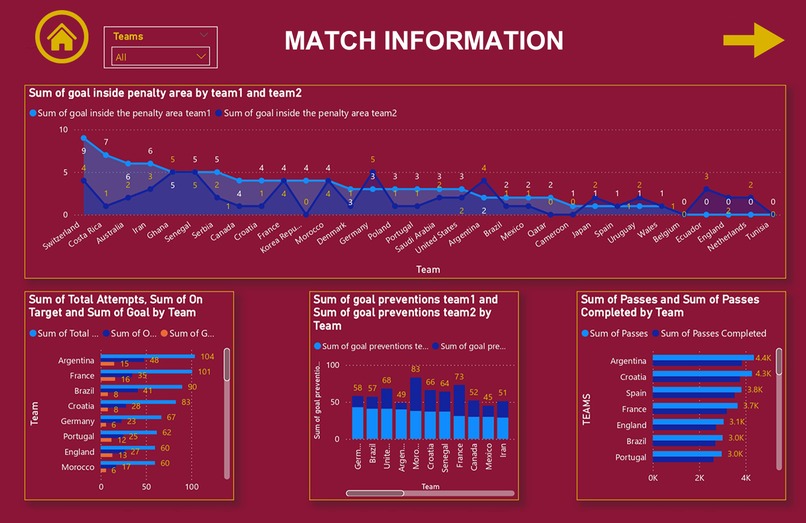
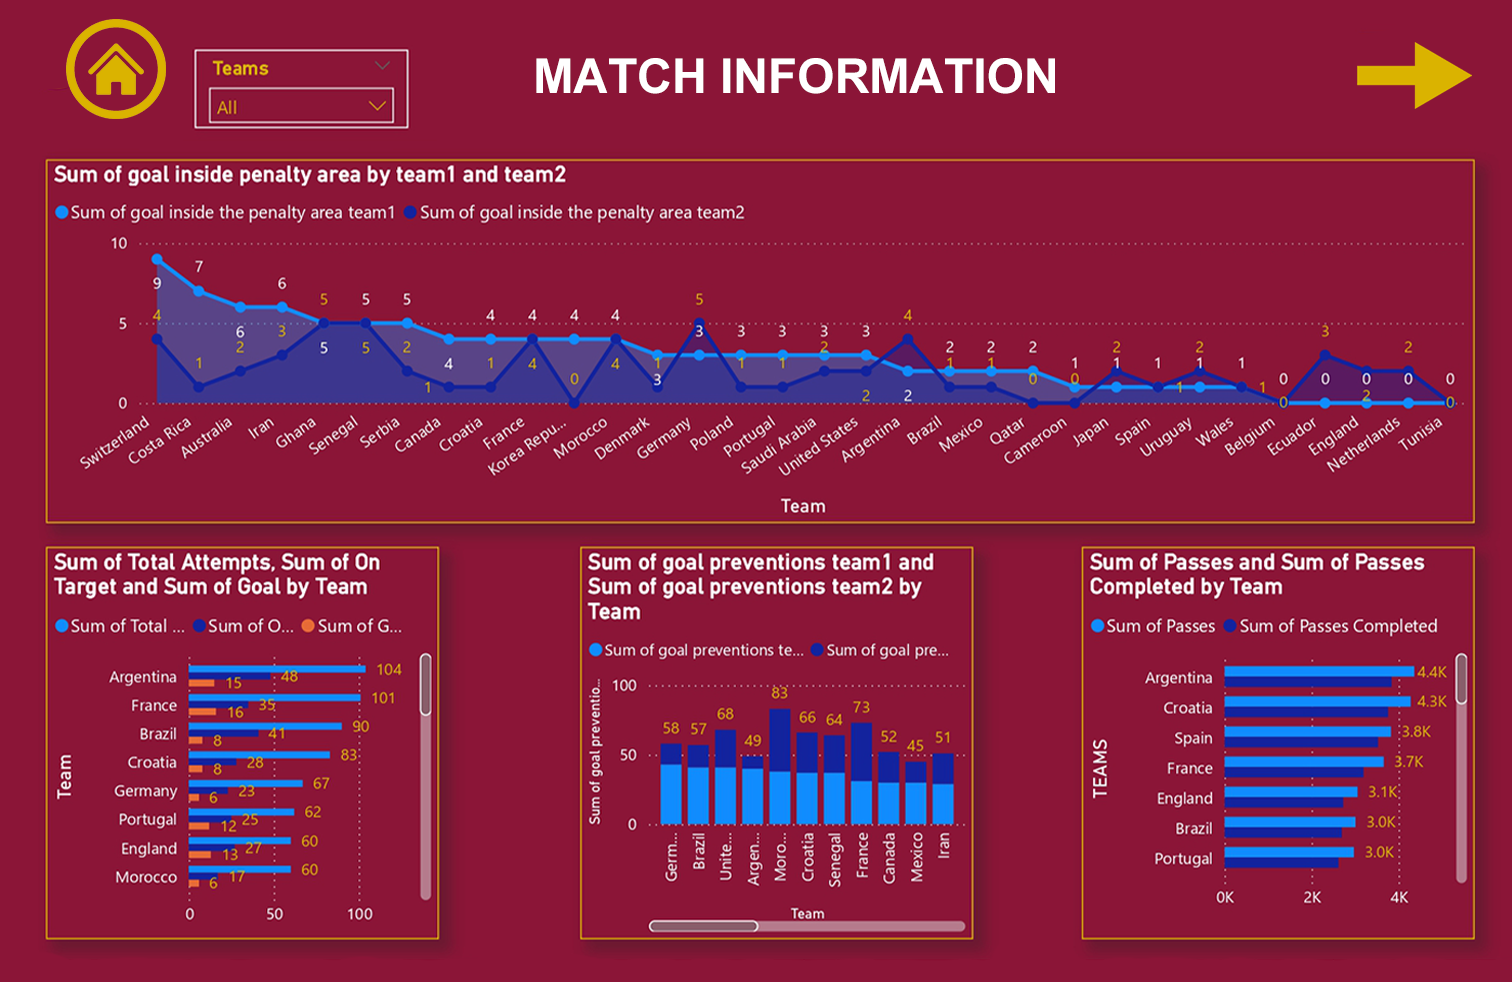
Match Information
-

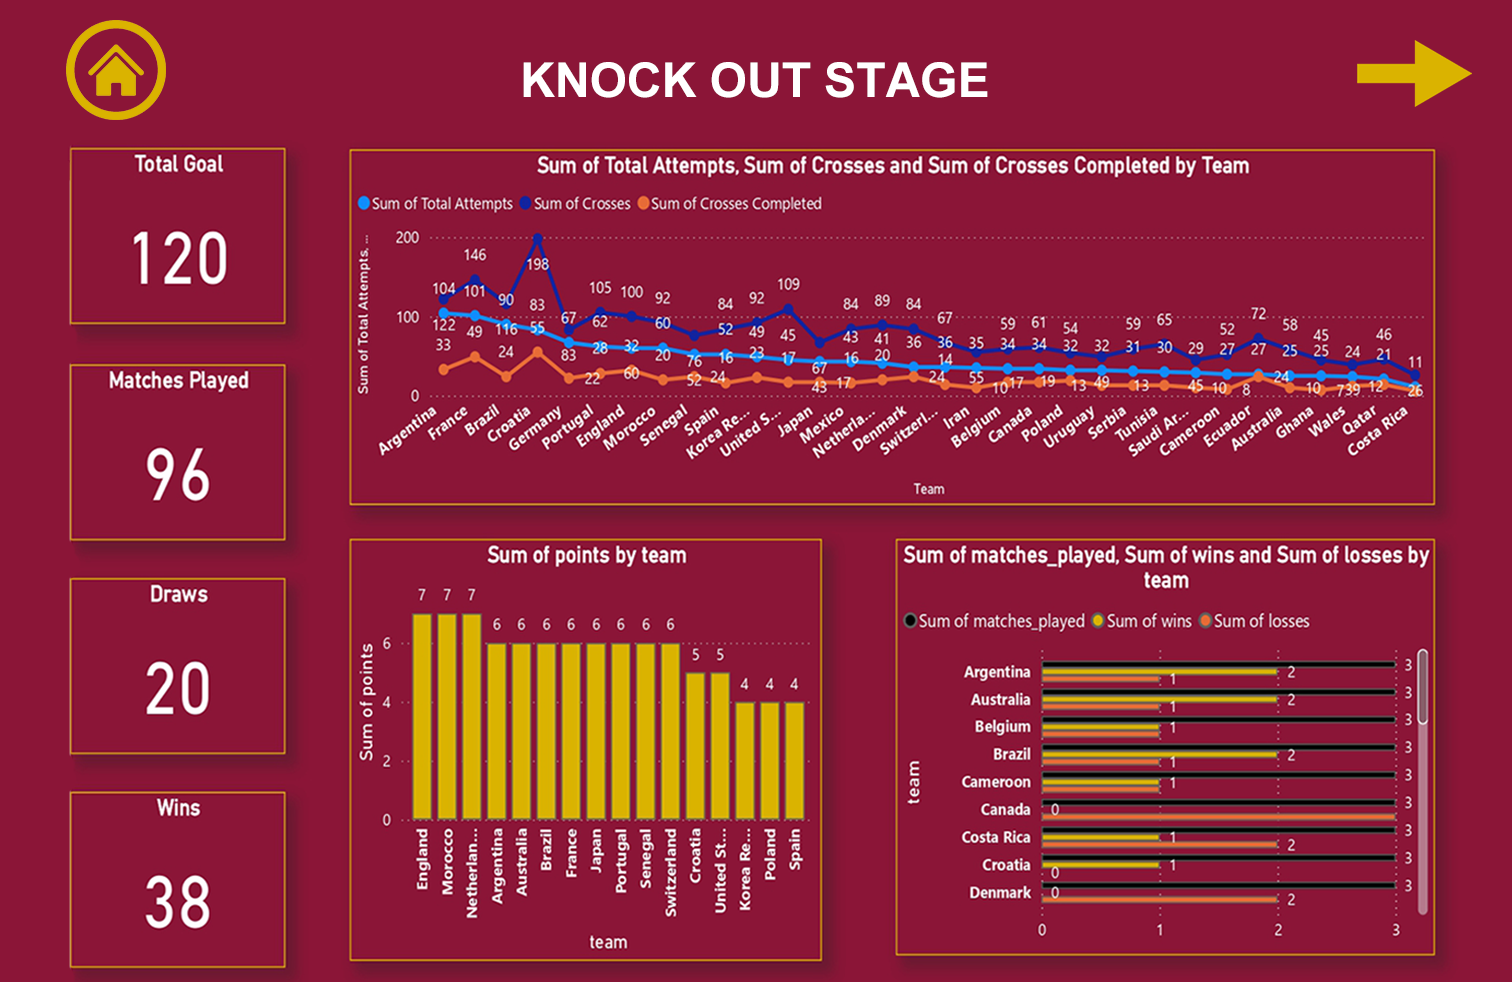
Knock-out Stage
-
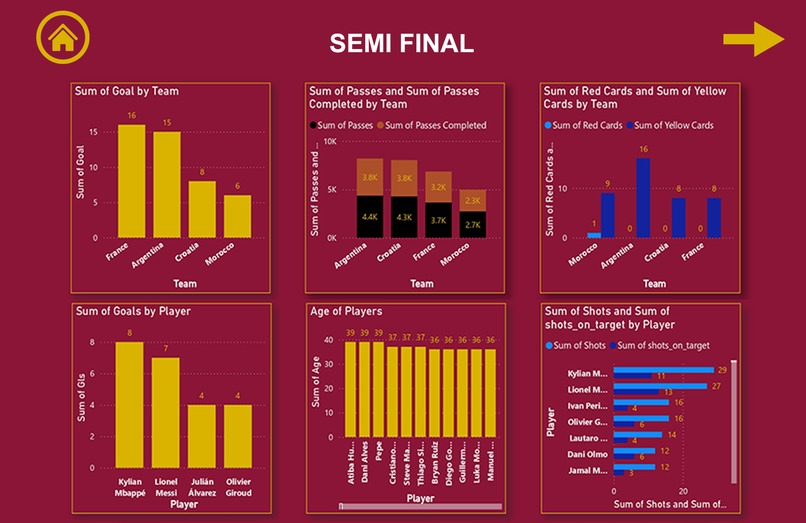
Semi Final
-
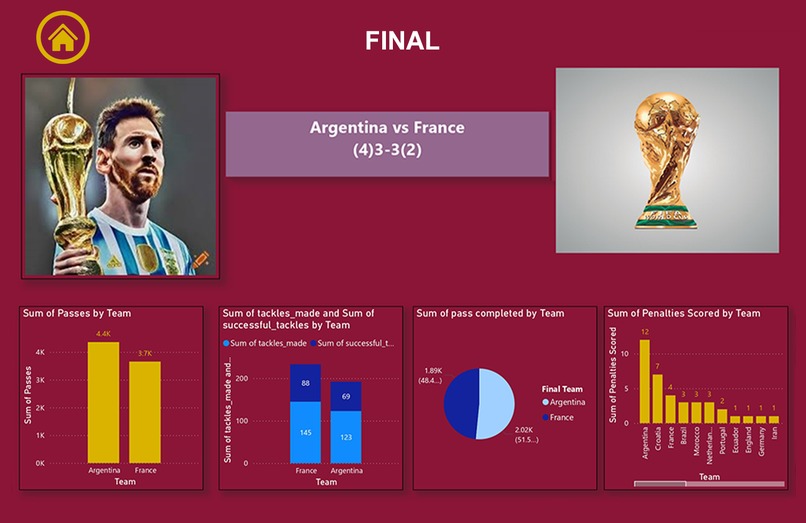
Final


Inspiration: We wanted to create a platform that simplifies understanding complex datasets by visualizing them in an engaging and user-friendly way. Inspired by platforms like PowerBI, we aimed to build something intuitive yet powerful to analyze and present statistical insights.
What it does: StatSpectra is a front-end project designed to provide detailed statistical insights about events or projects in an interactive and visually appealing manner. For our demo, we focused on the FIFA World Cup 2022, presenting stats like goals scored, teams, matches, attendance, disciplinary records, individual performances, and much more through dynamic graphs and charts.
How we built it: We utilized modern front-end technologies such as HTML, CSS, and JavaScript, alongside libraries like Chart.js and D3.js, to create interactive visualizations. The user interface was designed to be intuitive, ensuring that users can easily navigate through the wealth of data.
Challenges we ran into: One of the main challenges was deciding how to structure and display vast amounts of data without overwhelming the user. Another difficulty was ensuring that our visualizations were both accurate and visually appealing, which required extensive tweaking of graphs and layouts.
Accomplishments that we're proud of: We are proud of creating a platform that is not only functional but also visually impressive. Successfully integrating various datasets into cohesive, meaningful visualizations was a significant milestone for our team. The positive feedback from peers and mentors was also a rewarding achievement.
What we learned: This project deepened our understanding of data visualization techniques and the importance of user experience in front-end design. We also learned how to effectively collaborate as a team under tight deadlines and adapt to unforeseen challenges.
What's next: Moving forward, we plan to add features like real-time data updates, customizable dashboards, and support for more datasets. Additionally, we hope to explore integrating machine learning for predictive analytics and improving the scalability of the project.
Built With
- canva
- figma


Log in or sign up for Devpost to join the conversation.