Inspiration
🌍 Time Machine Dashboard
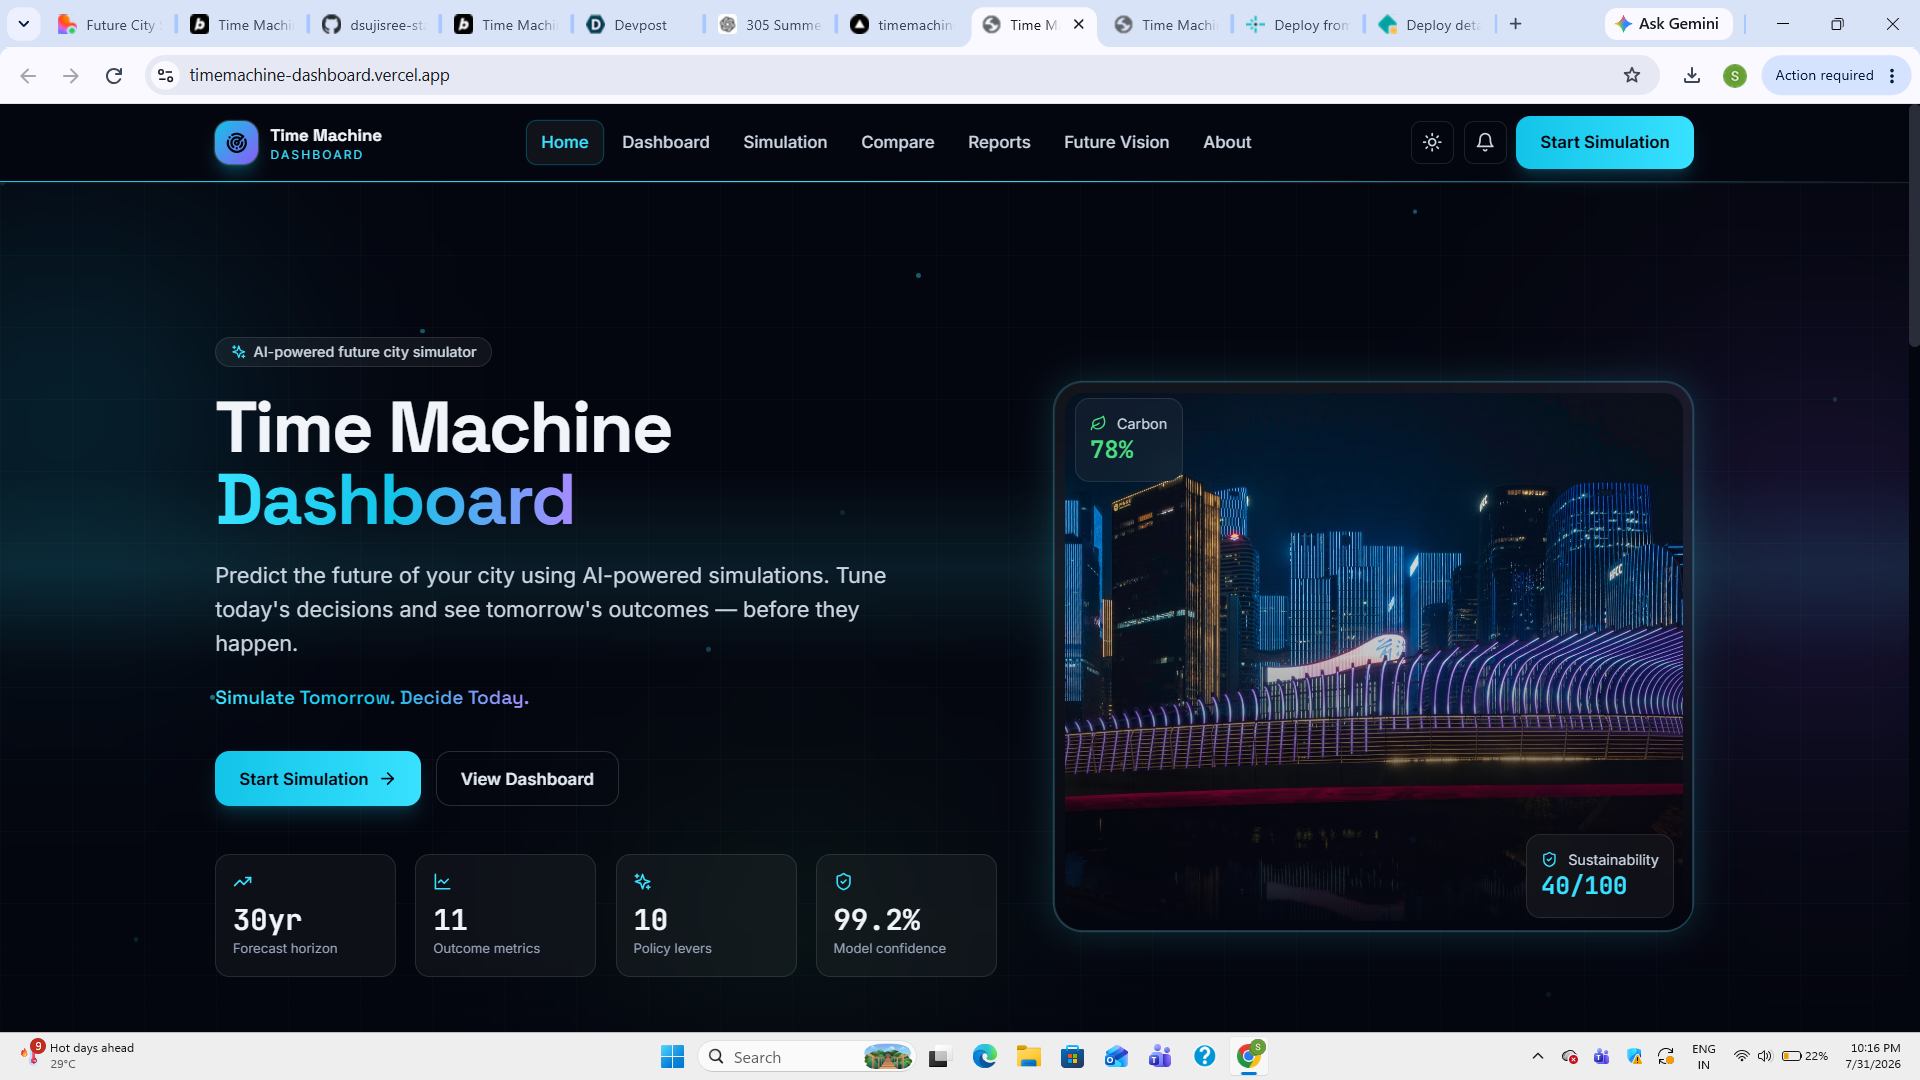
Simulate Tomorrow. Decide Today.
Inspiration
Cities around the world are growing rapidly, but many important decisions are still made without understanding their long-term impact. Population growth, climate change, energy consumption, traffic, and urban development all influence the future of our cities.
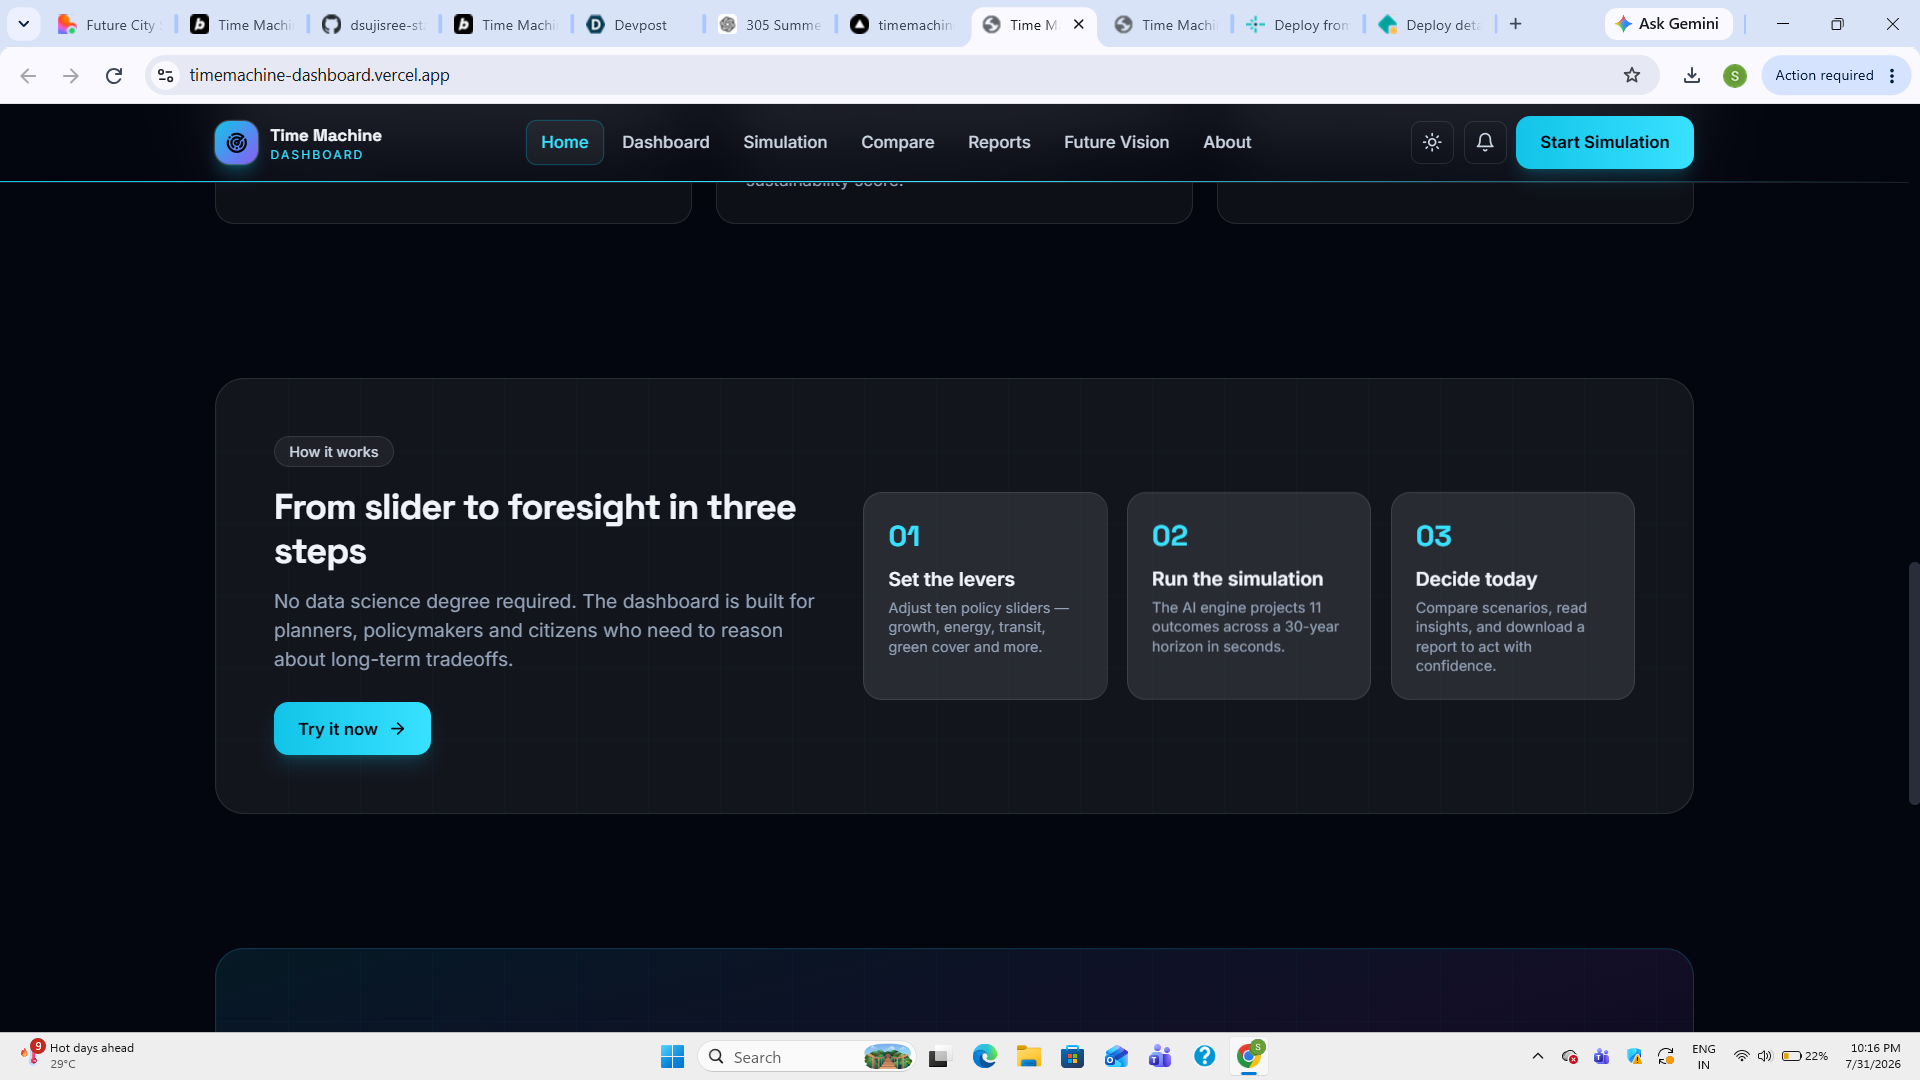
We wanted to create a platform that allows anyone—from students and researchers to city planners—to simulate different future scenarios and understand how today's choices may affect tomorrow. Our goal was to make future planning more visual, interactive, and AI-driven.
What it does
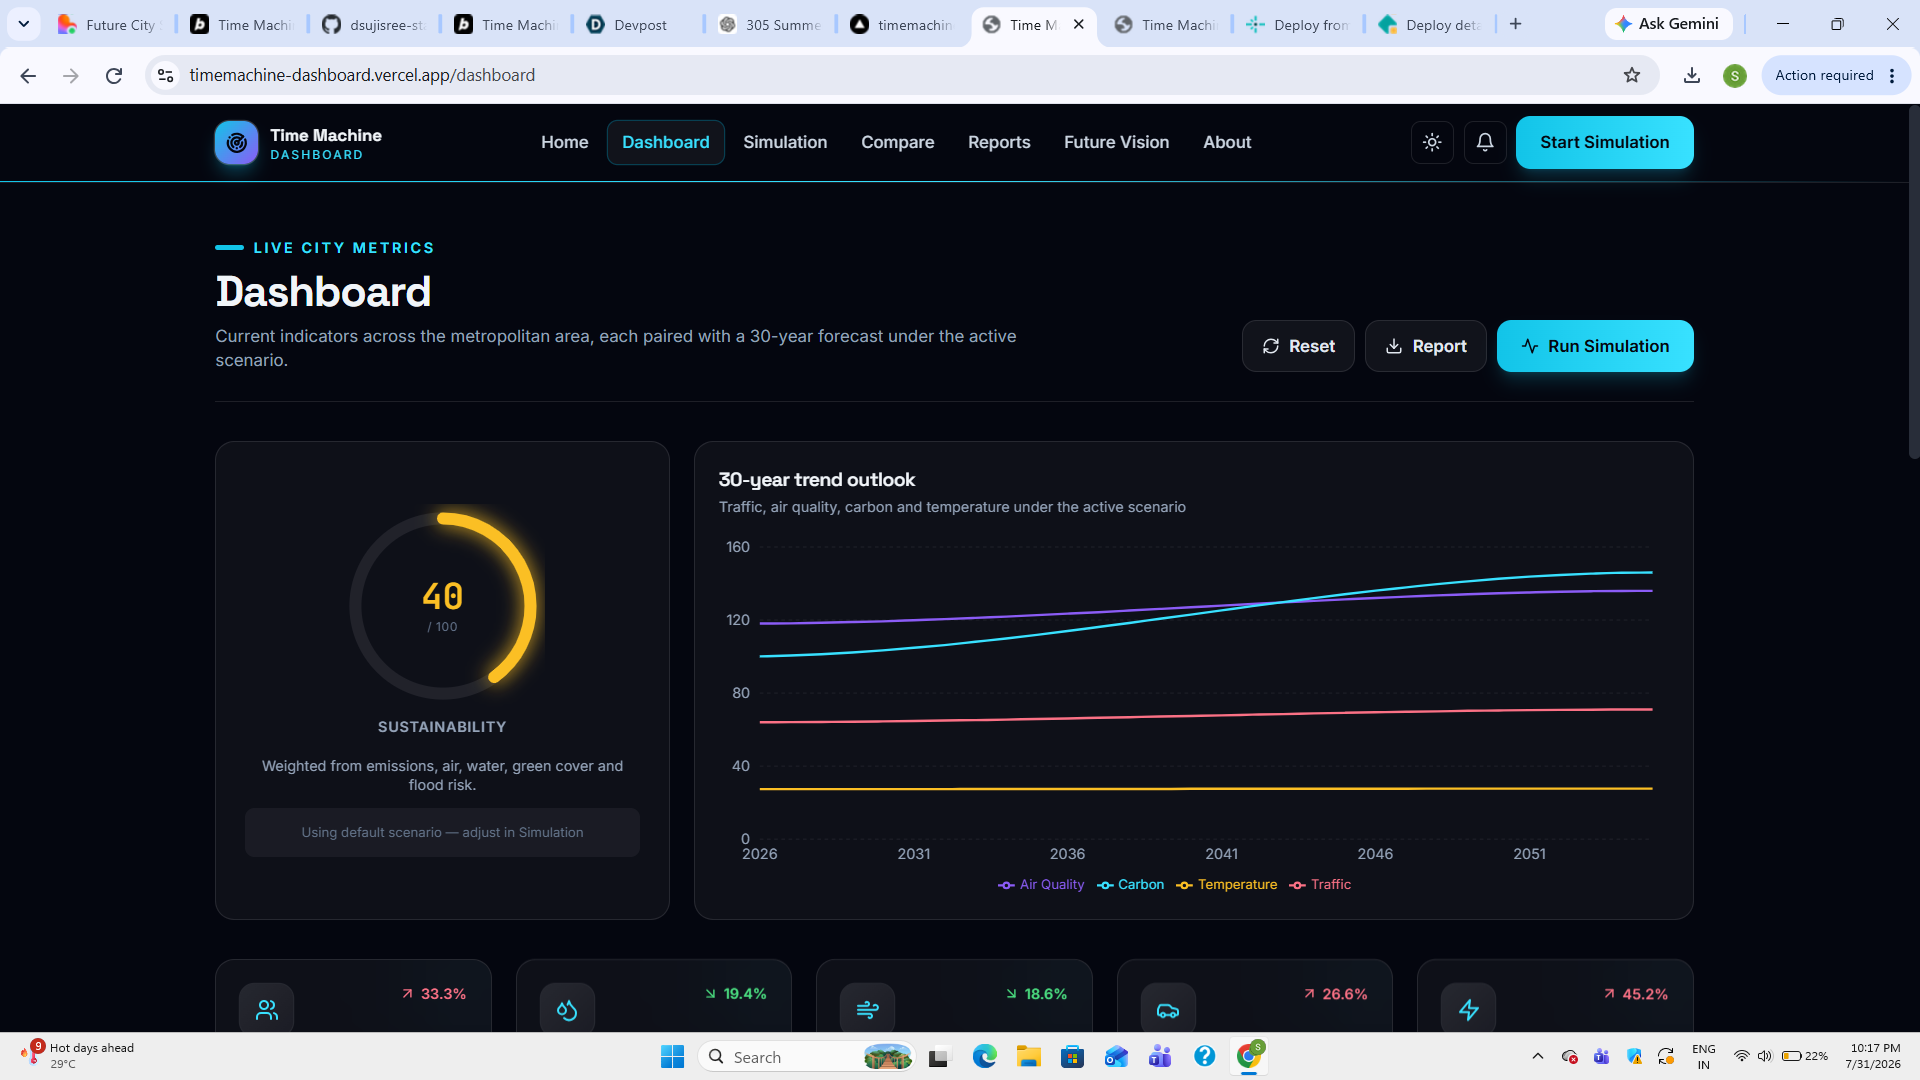
Time Machine Dashboard is an AI-powered future simulation platform that allows users to:
- Select a city
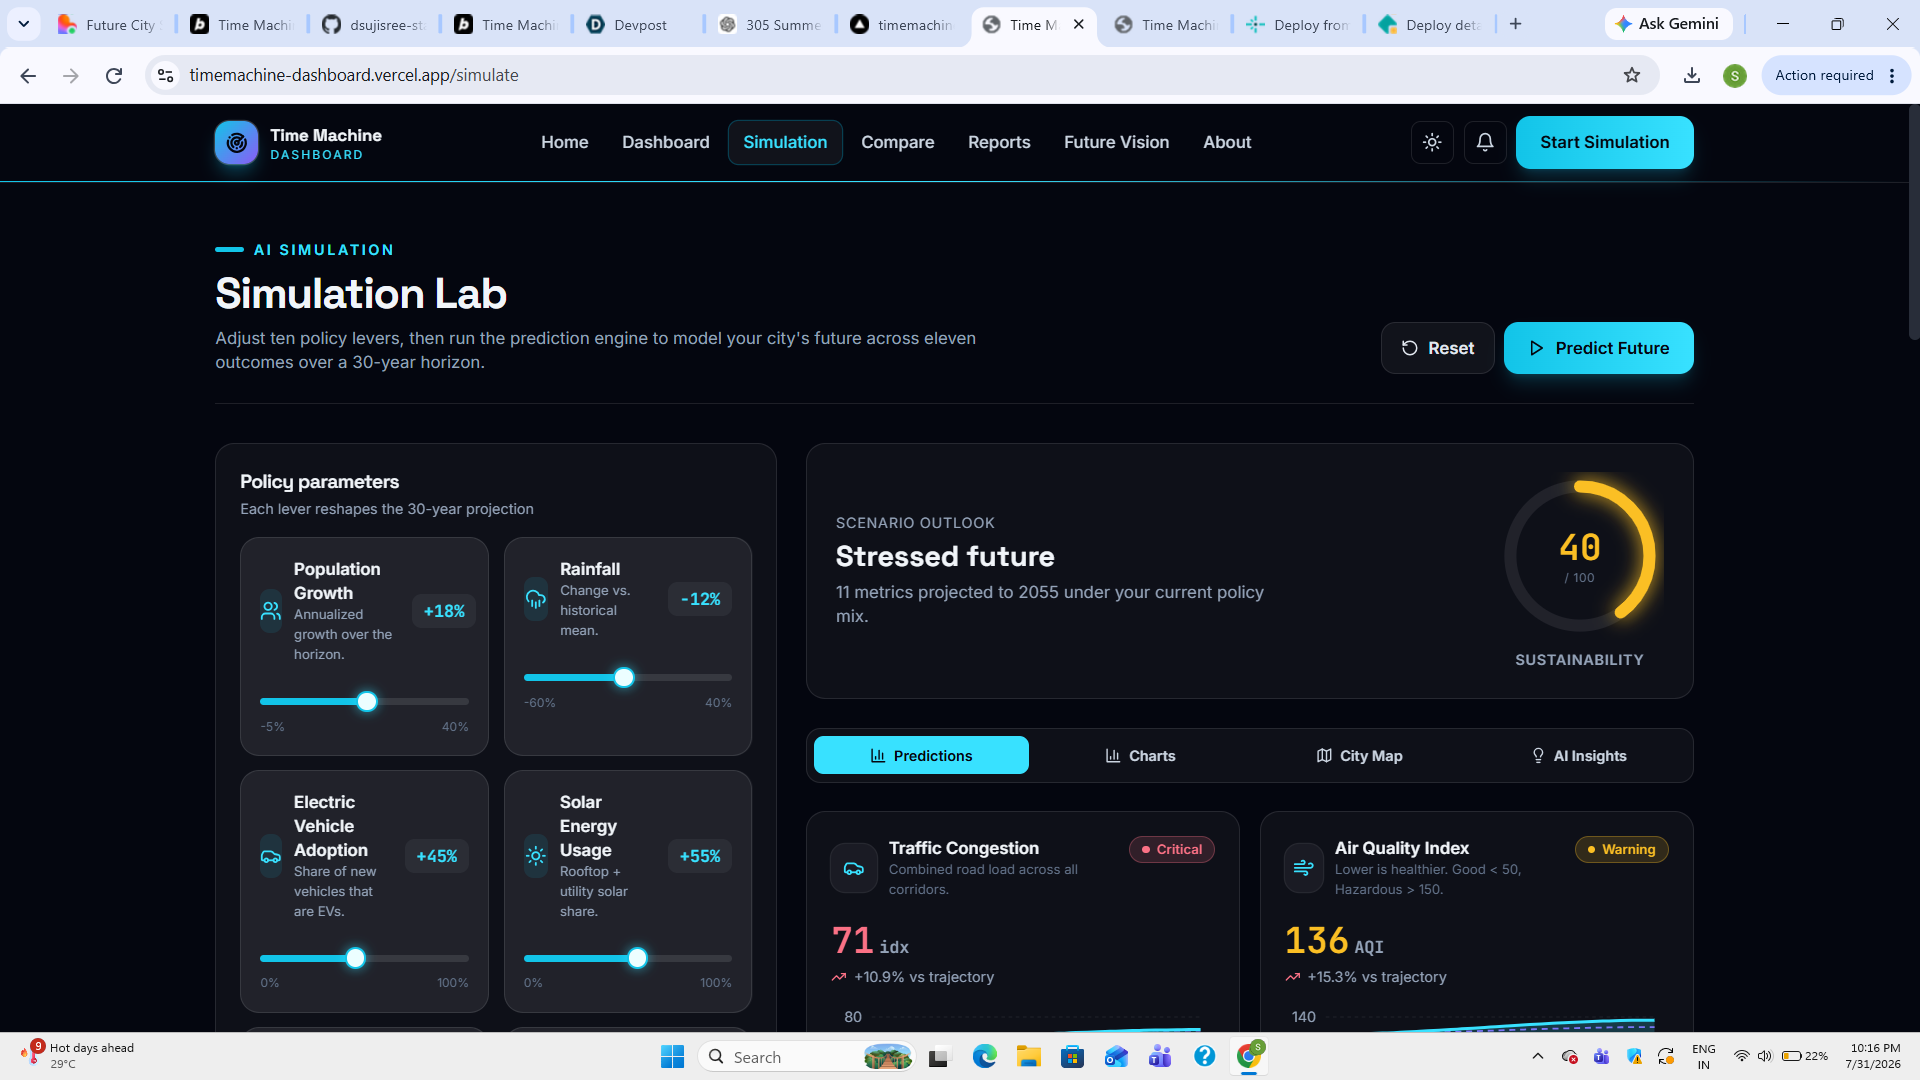
- Modify future parameters such as:
- Population Growth
- Rainfall
- Electric Vehicle Adoption
- Solar Energy Usage
- Green Cover
- Industrial Growth
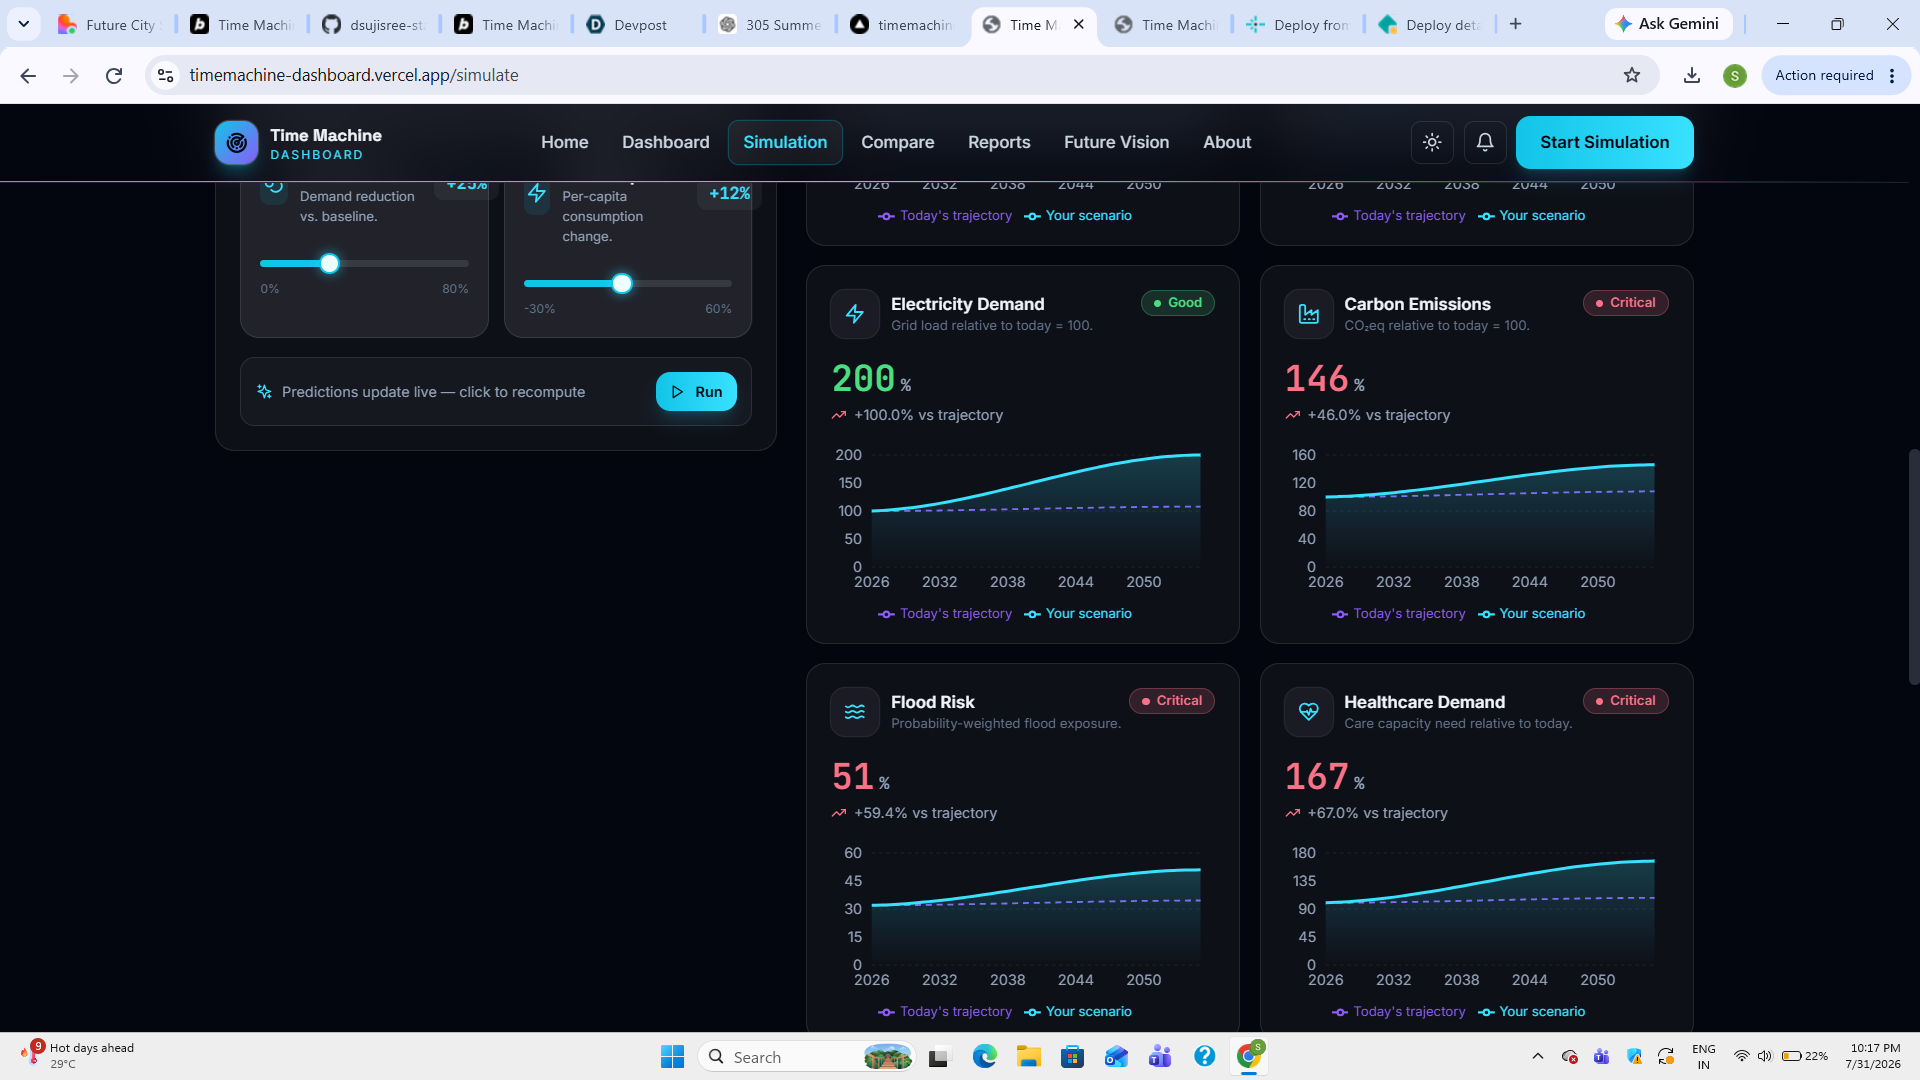
- Predict how these changes may affect:
- Traffic Congestion
- Air Quality
- Water Demand
- Electricity Demand
- Carbon Emissions
- Temperature
- Flood Risk
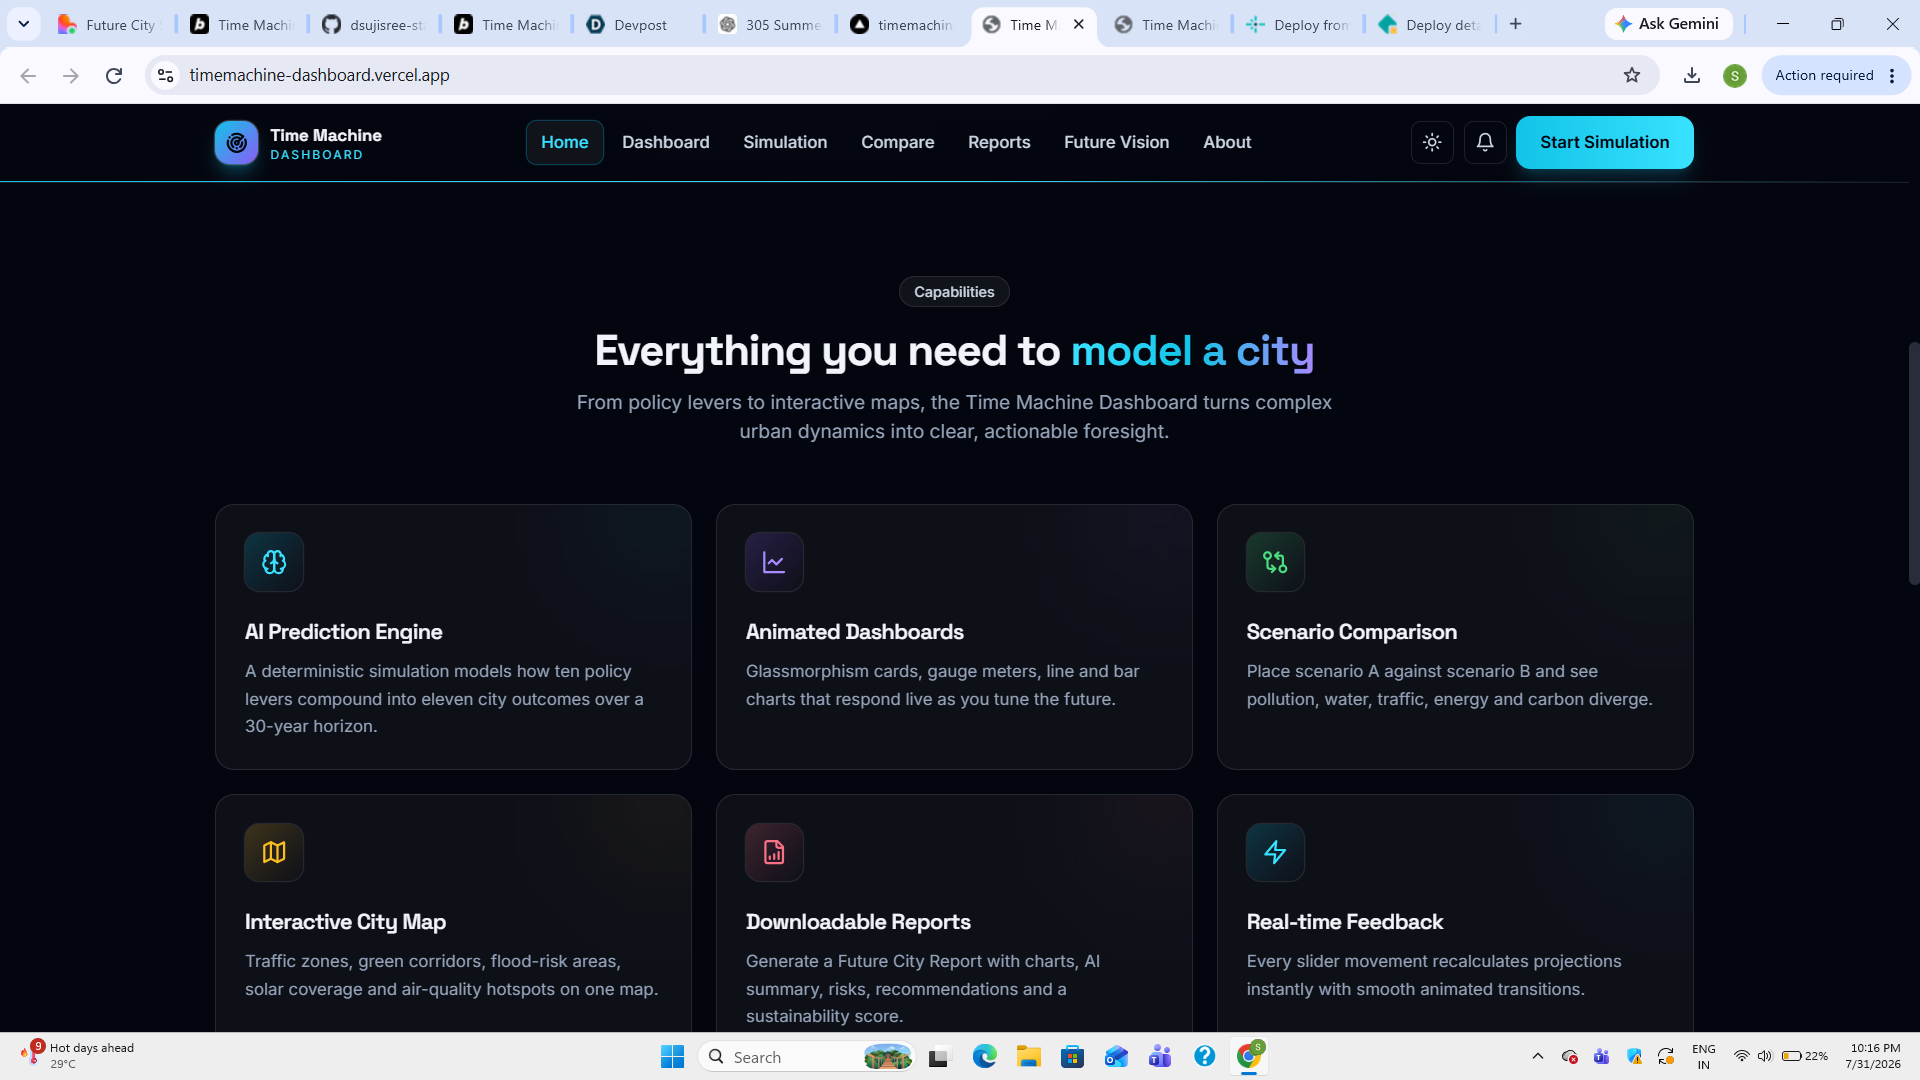
The application presents the predictions using interactive dashboards, charts, and AI-generated insights.
How we built it
- React
- Tailwind CSS
- Chart.js / Recharts
- Framer Motion
- FastAPI
- AI Integration (Gemini/OpenAI)
- Sample simulation datasets
The frontend provides an interactive dashboard where users can adjust different future scenarios. The backend processes these inputs using a rule-based simulation engine and generates predictions. AI then explains the results in natural language, making them easier to understand.
Challenges we faced
One of the biggest challenges was designing a system that can demonstrate future predictions in a meaningful way without relying on large real-world datasets. We addressed this by creating a simulation model with realistic sample data and focusing on clear visualizations and AI-powered explanations.
Another challenge was balancing technical complexity with usability, ensuring the application remained intuitive while providing detailed insights.
What we learned
During this project we learned:
- AI-assisted decision support
- Dashboard and data visualization design
- Frontend and backend integration
- Future scenario simulation
- Building responsive and interactive web applications
- Presenting complex information through simple user experiences
Future Scope
Future versions of Time Machine Dashboard can integrate with:
- Real-time weather APIs
- Smart city IoT sensors
- Satellite imagery
- Government open-data portals
- Traffic monitoring systems
- Renewable energy data
- Digital Twin technologies
- Machine learning forecasting models
These enhancements would make predictions more accurate and support data-driven planning for smarter and more sustainable cities.
Impact
Time Machine Dashboard demonstrates how AI can support better planning by helping users visualize possible future outcomes before making important decisions. Rather than reacting to problems after they occur, the platform encourages proactive planning for more resilient and sustainable communities.
🚀 Simulate Tomorrow. Decide Today.
What it does
How we built it
Challenges we ran into
Accomplishments that we're proud of
What we learned
What's next for Time machine dashboard
Built With
- api
- chart.js
- css
- css3
- fastapi
- firebase
- framer
- gemini
- html5
- javascript
- leaflet.js
- maps
- mongodb
- motion
- openai
- python
- react
- recharts
- rest
- sqlite
- tailwind
- typescript
- vercel
- vite


Log in or sign up for Devpost to join the conversation.