-
-

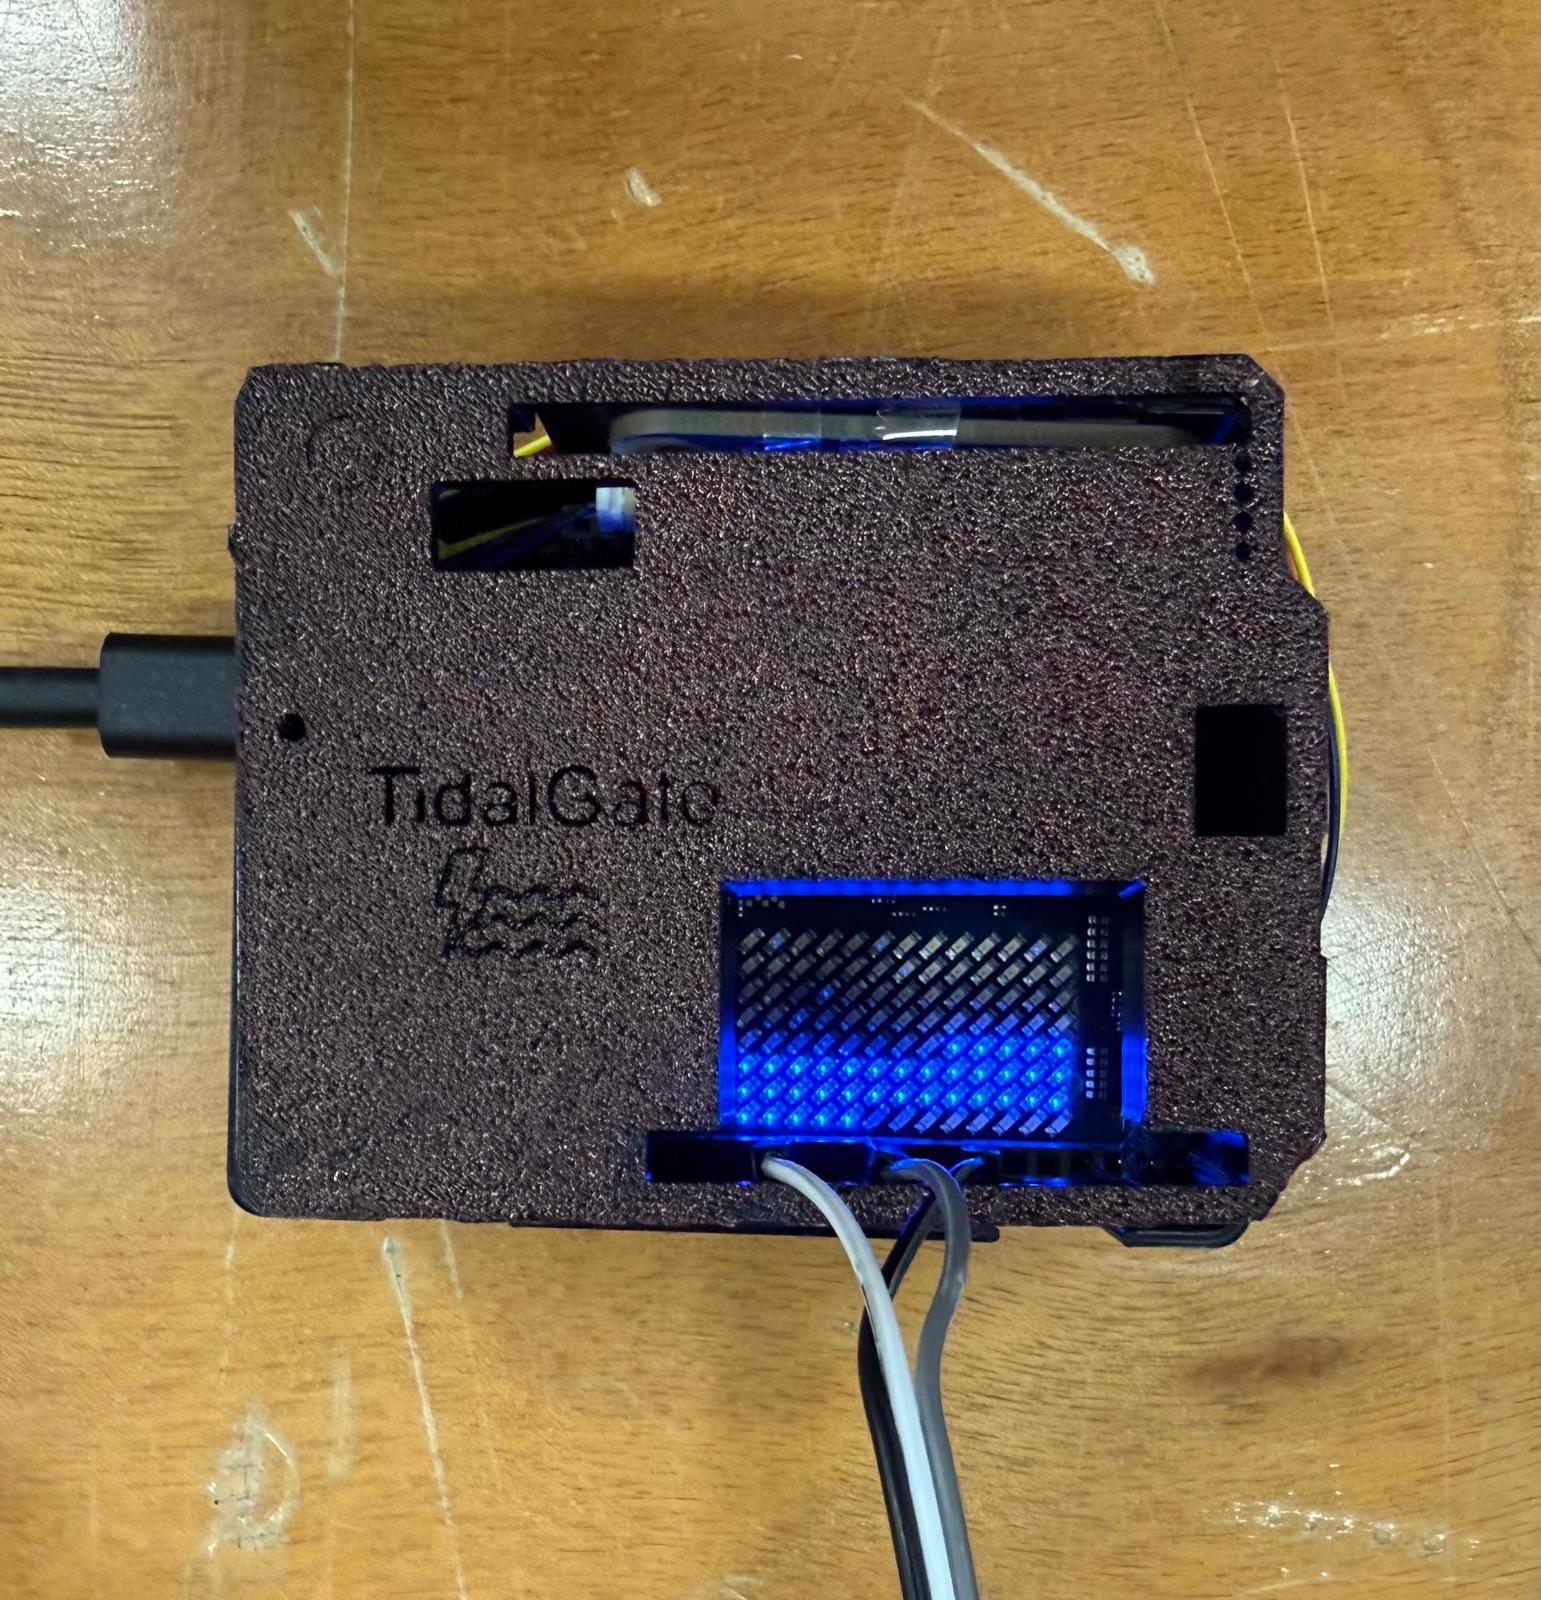
final casing
-
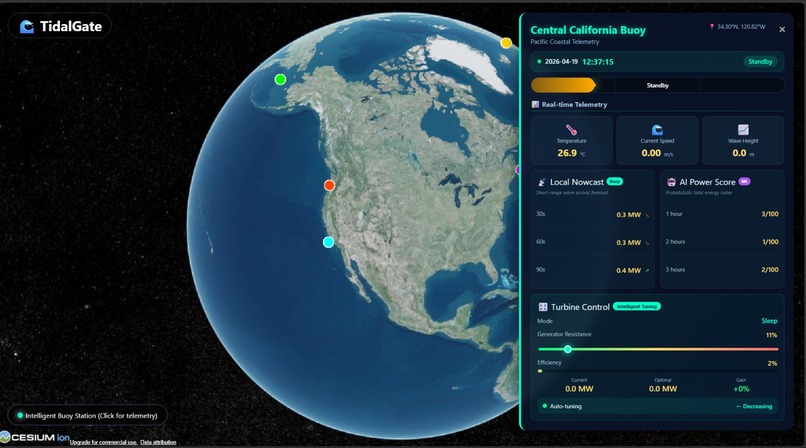
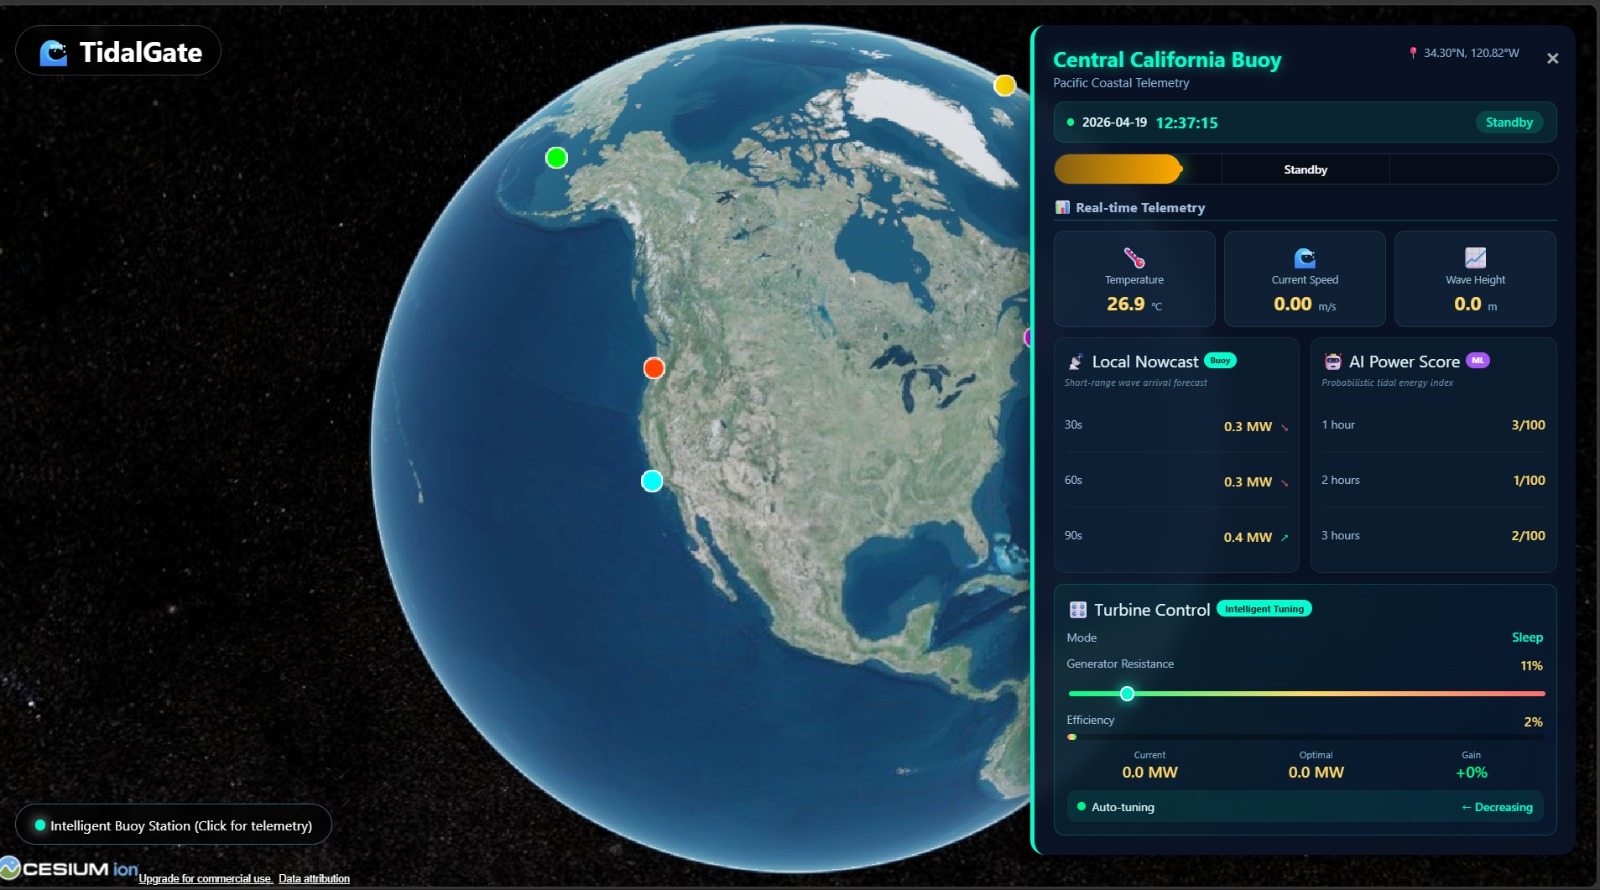
Data Dashboard
Inspiration
The sea mooring dataset given to us inspired us to think about the under utilization of tidal energy as a sustainable energy source. We worked on predicting sea motion in the future and giving a "power score" that measures the amount of tidal energy available to maximize the energy obtained from a tidal turbine.
Context
To understand why predicting wave energy is vital, consider a bike with gears. When you are in a high gear, the pedals are very hard to spin, but you move faster once you get going; in a low gear, they spin easily with almost no effort. Tidal turbines work similarly. If a massive wave hits a turbine set in a "high gear" (high electrical resistance), it captures huge amounts of power. However, if a weak wave hits that same high gear, the turbine won't spin at all—the energy is wasted. Conversely, if a massive wave hits a turbine in a "low gear," it spins too fast (freewheeling), which can cause mechanical failure. TidalGate allows turbines to "shift gears" before the waves arrive, matching the resistance to the incoming energy.
How we built it
We used the Arduino Uno Q as our main platform, which allowed us to bridge real-time sensor logic with AI models.
- The Sensors: We used the Modulino Movement (IMU) to capture 3D motion and acceleration. We used the Modulino Thermo to track water temperature and an analog water depth sensor to measure wave height.
- The Physics Engine: We implemented discrete integral calculus and applied gyroscope-derived correction factors to perform real-time tilt compensation. This ensured accurate current speed measurements despite the buoy's constant orientation changes.
- Data & AI: We cleaned the data and trained an AI model with Databricks. To feed the model, we fused the temperature data (to account for water density), the motion data (for velocity), and the depth data (for potential energy). We used the fundamental energy equation: $$E_{total} = \frac{1}{2}mv^2 + mgh$$
- The Frontend: For the web construction, we started by defining the web's core functionality and target users. After scaffolding the structure, we used the CesiumJS API to deliver a real-time dashboard that integrates our hardware data and ML predictions.
Challenges we ran into
- Inaccurate Outcomes: Initially, the AI predictions were inaccurate. We fixed this by adding calculated features into the training model, like the mean value of the past three hours, which increased the accuracy greatly.
- Visualization Struggles: The globe visualization was a major hurdle. Early AI-generated attempts were ineffective, and even switching to the
globe.gllibrary failed to render our telemetry points. Moving to CesiumJS finally solved the problem. - Integration: Navigating challenges like sensor drift and multi-platform synchronization between the STM32 logic and Qualcomm-hosted Python models taught us the complexities of heterogeneous system design.
Accomplishments that we're proud of
- Inaccurate Outcomes: Initially, the AI predictions were inaccurate. We fixed this by adding calculated features into the training model, like the mean value of the past three hours, which increased the accuracy greatly.
- Visualization Struggles: The globe visualization was a major hurdle. Early attempts were ineffective, and even switching to the
globe.gllibrary failed to render our telemetry points. Moving to CesiumJS finally solved the problem. - Integration: Navigating challenges like sensor drift and multi-platform synchronization between the STM32 logic and Qualcomm-hosted Python models taught us the complexities of heterogeneous system design.
What we learned
We are proud of successfully bridging three different layers of technology: embedded hardware, on device AI, and advanced web visualization into a single working prototype.]
What's next for TidalGate
Improvement in our data prediction algorithm and creating a mesh of multiple TidalGates


Log in or sign up for Devpost to join the conversation.