-
-
cover
Inspiration
We started with a practical question: how does a field crew decide what work can go ahead when conditions are changing?
A forecast gives part of the answer, but it won’t tell you that an access road is blocked or that another crew found unstable ground that morning. We wanted Threshold to bring those pieces together and keep that knowledge available after a shift ends.
What it does
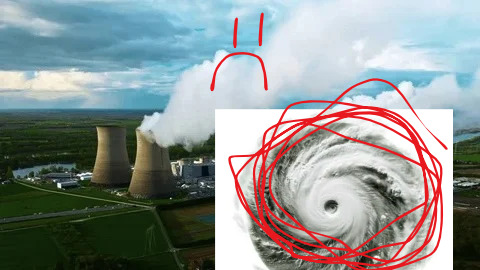
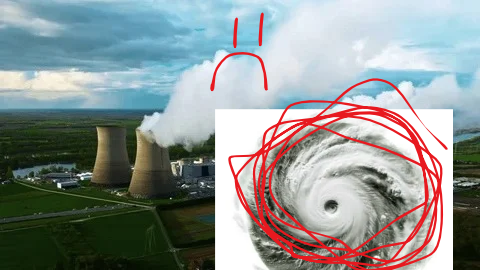
Threshold helps field crews and supervisors assess environmental hazards at power plants. Its interactive 3D map covers 285 real plants across all 50 states, with seven hazard channels: weather, heat, lightning, flooding, wildfire, soil conditions, and wildlife. Supervisors can inspect the evidence behind a score and see which tasks are restricted. When data is missing, the site shows that uncertainty.
The companion iPhone app lets a crew member take a photo, pin a hazard, and share it with the team. Reports can place affected work on hold immediately. Resolving a report preserves its history, and next-day briefings carry unresolved concerns into the next shift.
There’s also a Model Lab for running and calibrating models in the browser, along with separate 3D tools for exploring hypothetical storms and site conditions.
How we built it
We used React, TypeScript, and Three.js for the web app, with a Node.js API and SQLite for reports, photos, and site history. The iPhone app uses React Native and Expo and connects to the same backend. A report shared from the field updates connected supervisor screens.
Our environmental pipeline combines sources including Open-Meteo, the National Weather Service, USGS, NASA FIRMS, and FEMA. We normalize those inputs before calculating hazard scores and applying task restrictions.
For the models, we built a reproducible Python and NumPy pipeline using more than 1.17 million aligned hourly records. HeatCast corrects forecast heat-index estimates, GroundCast estimates surface soil moisture against reanalysis targets, and HazardCast predicts next-day hazard probabilities. Historical model coverage is limited to the original 50-site cohort.
TensorFlow.js handles browser inference and local calibration. Users can train and save a calibration candidate without changing the models used for operational decisions.
Challenges we ran into
Getting the data into one system was only part of the problem. We also had to decide how to handle conflicting evidence. A forecast might look better while a crew still has an unresolved hazard on the ground. We built the decision logic so that a lower prediction cannot clear that hold.
Time was another complication. Current conditions, historical forecasts, stale readings, and simulated events all appear in the project, but they have to remain distinguishable. Missing data cannot quietly turn into a low-risk score.
Evaluating the models required careful work too. We had to align forecasts with later outcomes, account for incomplete event records, and keep future information out of training. Connecting those models to a web app, a native phone app, and offline browser functionality added plenty of integration work.
Accomplishments that we're proud of
We’re proud that the reporting workflow works from end to end. A photo taken by a crew member becomes a pinned report, reaches a supervisor, and stays available for the next shift. Even after resolution, the record remains attached to the site.
We also got real model inference and calibration running in the browser, with loss curves and locally saved candidates. We evaluated the models against simpler alternatives and documented the cases where they didn’t perform better.
The 3D map was a big part of the build, but the details behind it matter just as much to us. Users can inspect where information came from, how fresh it is, and what’s still unknown.
What we learned
We learned how much of this project depends on handling uncertainty well. A score is only useful if someone can understand what supports it and what it leaves out.
Our model comparisons also reminded us to test simple approaches seriously. More complex models didn’t consistently outperform simpler ones, and those results helped us decide how much weight to give their predictions.
Building both interfaces made the differences between users clearer. A supervisor needs to compare sites and investigate conditions. Someone in the field needs to capture a hazard quickly, check the pin, and get back to work.
What's next for Threshold
We want to put the prototype in front of field crews and safety supervisors to find out where reporting takes too long, what’s missing from briefings, and whether the task restrictions are clear.
Before broader deployment, we need authenticated access, secure hosting, reliable notifications, and better offline synchronization. We also want to integrate a trusted live lightning source.
For the models, our next priorities are testing across more geographically distinct sites and improving uncertainty calibration, especially where the current prediction intervals are too narrow.


Log in or sign up for Devpost to join the conversation.