-
-
-
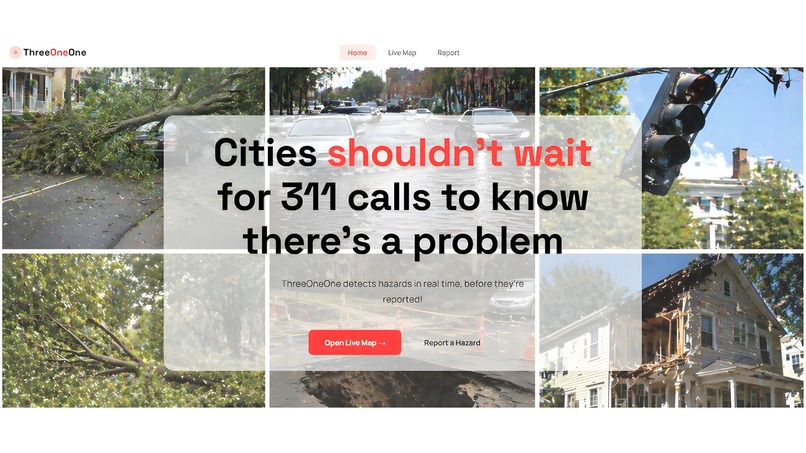
Homepage
-

-
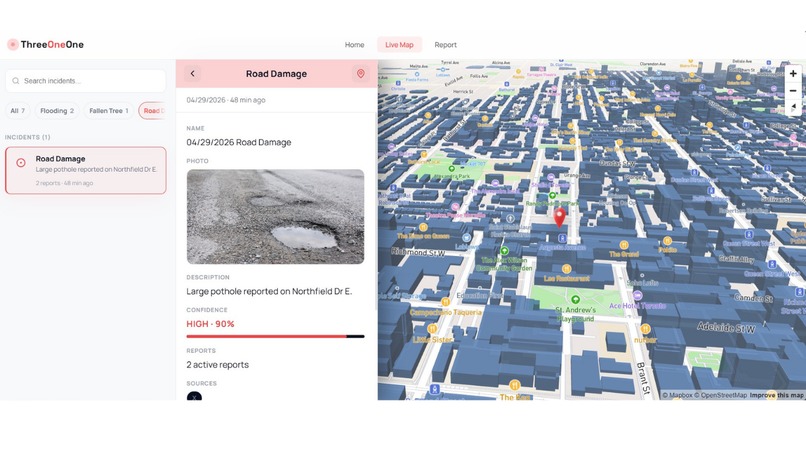
Live Map
-
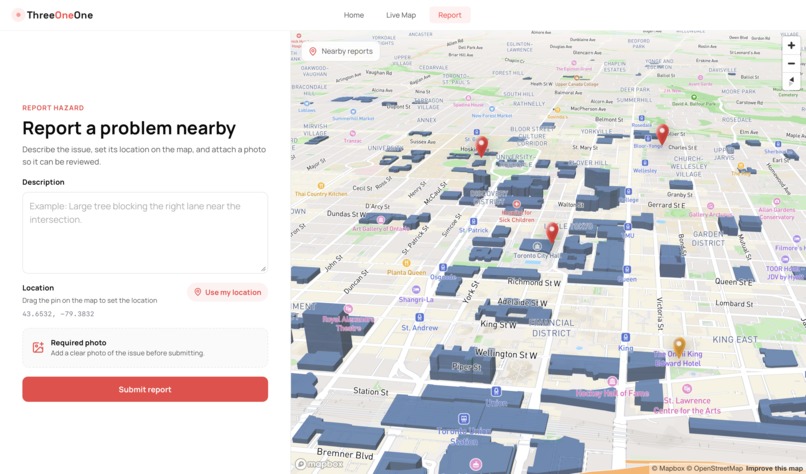
Report


Inspiration
"What do you mean you don't know 311?" I was astonished when none of my team members had heard of it.
Imagine a traffic light goes down and no one reports it for 20 minutes. Or a yield sign stays uprooted for two weeks. Bystanders post about it on social media, but nobody calls 311. That delay, and the lack of awareness around 311 itself, is the problem we wanted to solve.
The numbers tell the story:
- The 311 Toronto app is used by less than 20% of residents.
- Only 5% of university students are aware that 311 exists at all.
Meanwhile, the same fallen tree, broken signal, or flooded street will appear on X, Bluesky, Facebook, and Instagram within minutes. Cities can't act on tweets. A single post is unverified, possibly fake, possibly miscategorized, possibly already resolved. The signal is there, but it's drowning in noise. We wanted to build the layer in between: something that doesn't trust any one post, but trusts patterns across many of them. A real-time platform that listens to public signals, lets the AI decide what's a hazard, clusters reports by location and time, and only surfaces incidents once there's enough corroborating evidence to act.
What it does
ThreeOneOne is a real-time hazard detection platform that aggregates posts from social media (X, Bluesky, Reddit) and direct user submissions, then uses AI to turn raw text and images into verified incidents on a live map.
The core flow:
- Centralize: Posts flow in from any source and land in Snowflake, our system of record. Mock and real posts share the same table schema at the start, so the pipeline doesn't care where the data came from.
- Classify: An SQL script in Snowflake uses Cortex to categorize the kind of hazard (fallen tree, flooding, downed power line, broken traffic light, etc.). Then, Gemini 3.1 flash lite decides whether the post describes a real-world hazard or not.
- See: If the post has an image, Gemini 2.5 Flash with spatial understanding confirms the hazard and returns bounding box coordinates around it.
- Resolve: If the post mentions a vague location ("flooding near Victoria Park bridge") instead of GPS coordinates, Gemini's grounded search uses Google Search to pin it to real lat/lon.
- Cluster: DBSCAN with the haversine metric groups reports within ~300 meters and ~2 hours into single incidents.
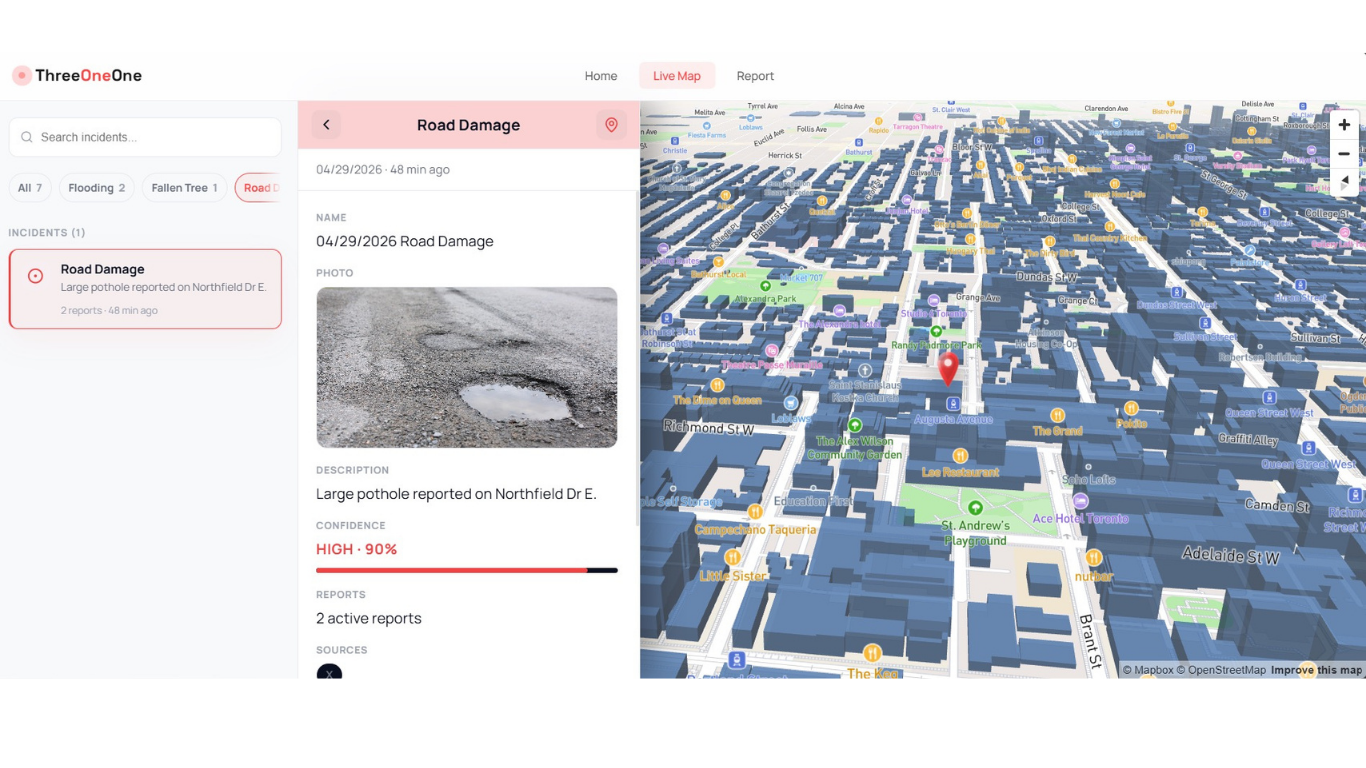
- Score: Each incident gets a confidence score from a transparent weighted formula: report count (30%), source diversity (25%), image evidence (25%), recency (20%).
- Verify: Once a cluster reaches medium or high confidence, Gemini's grounded search fires one more time to cross-reference local news. Incidents that match real news pickup get a "✓ Confirmed by N news sources" badge.
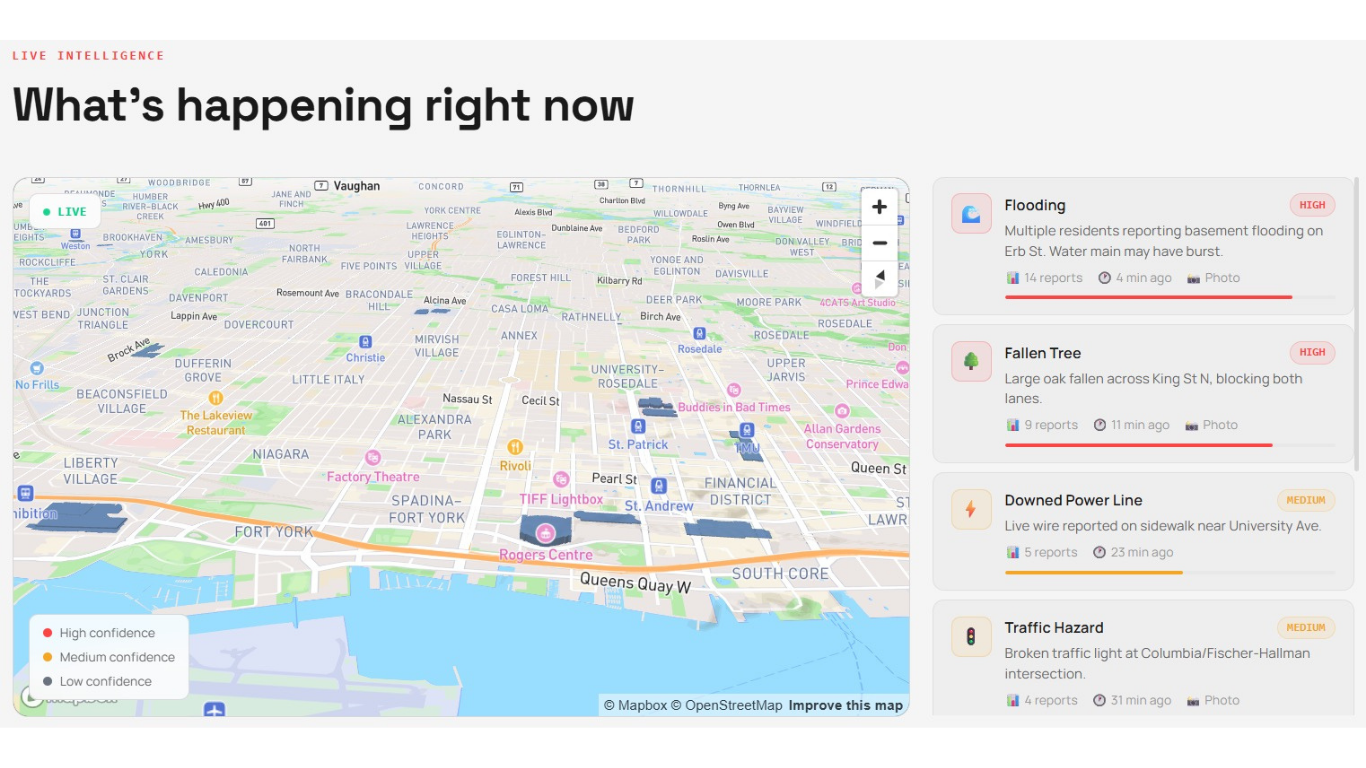
- Display & Act: Everything renders on an interactive Mapbox map with color-coded markers based on confidence (red = high, amber = medium, gray = low) and a slide-out detail panel so responders can prioritize and act.
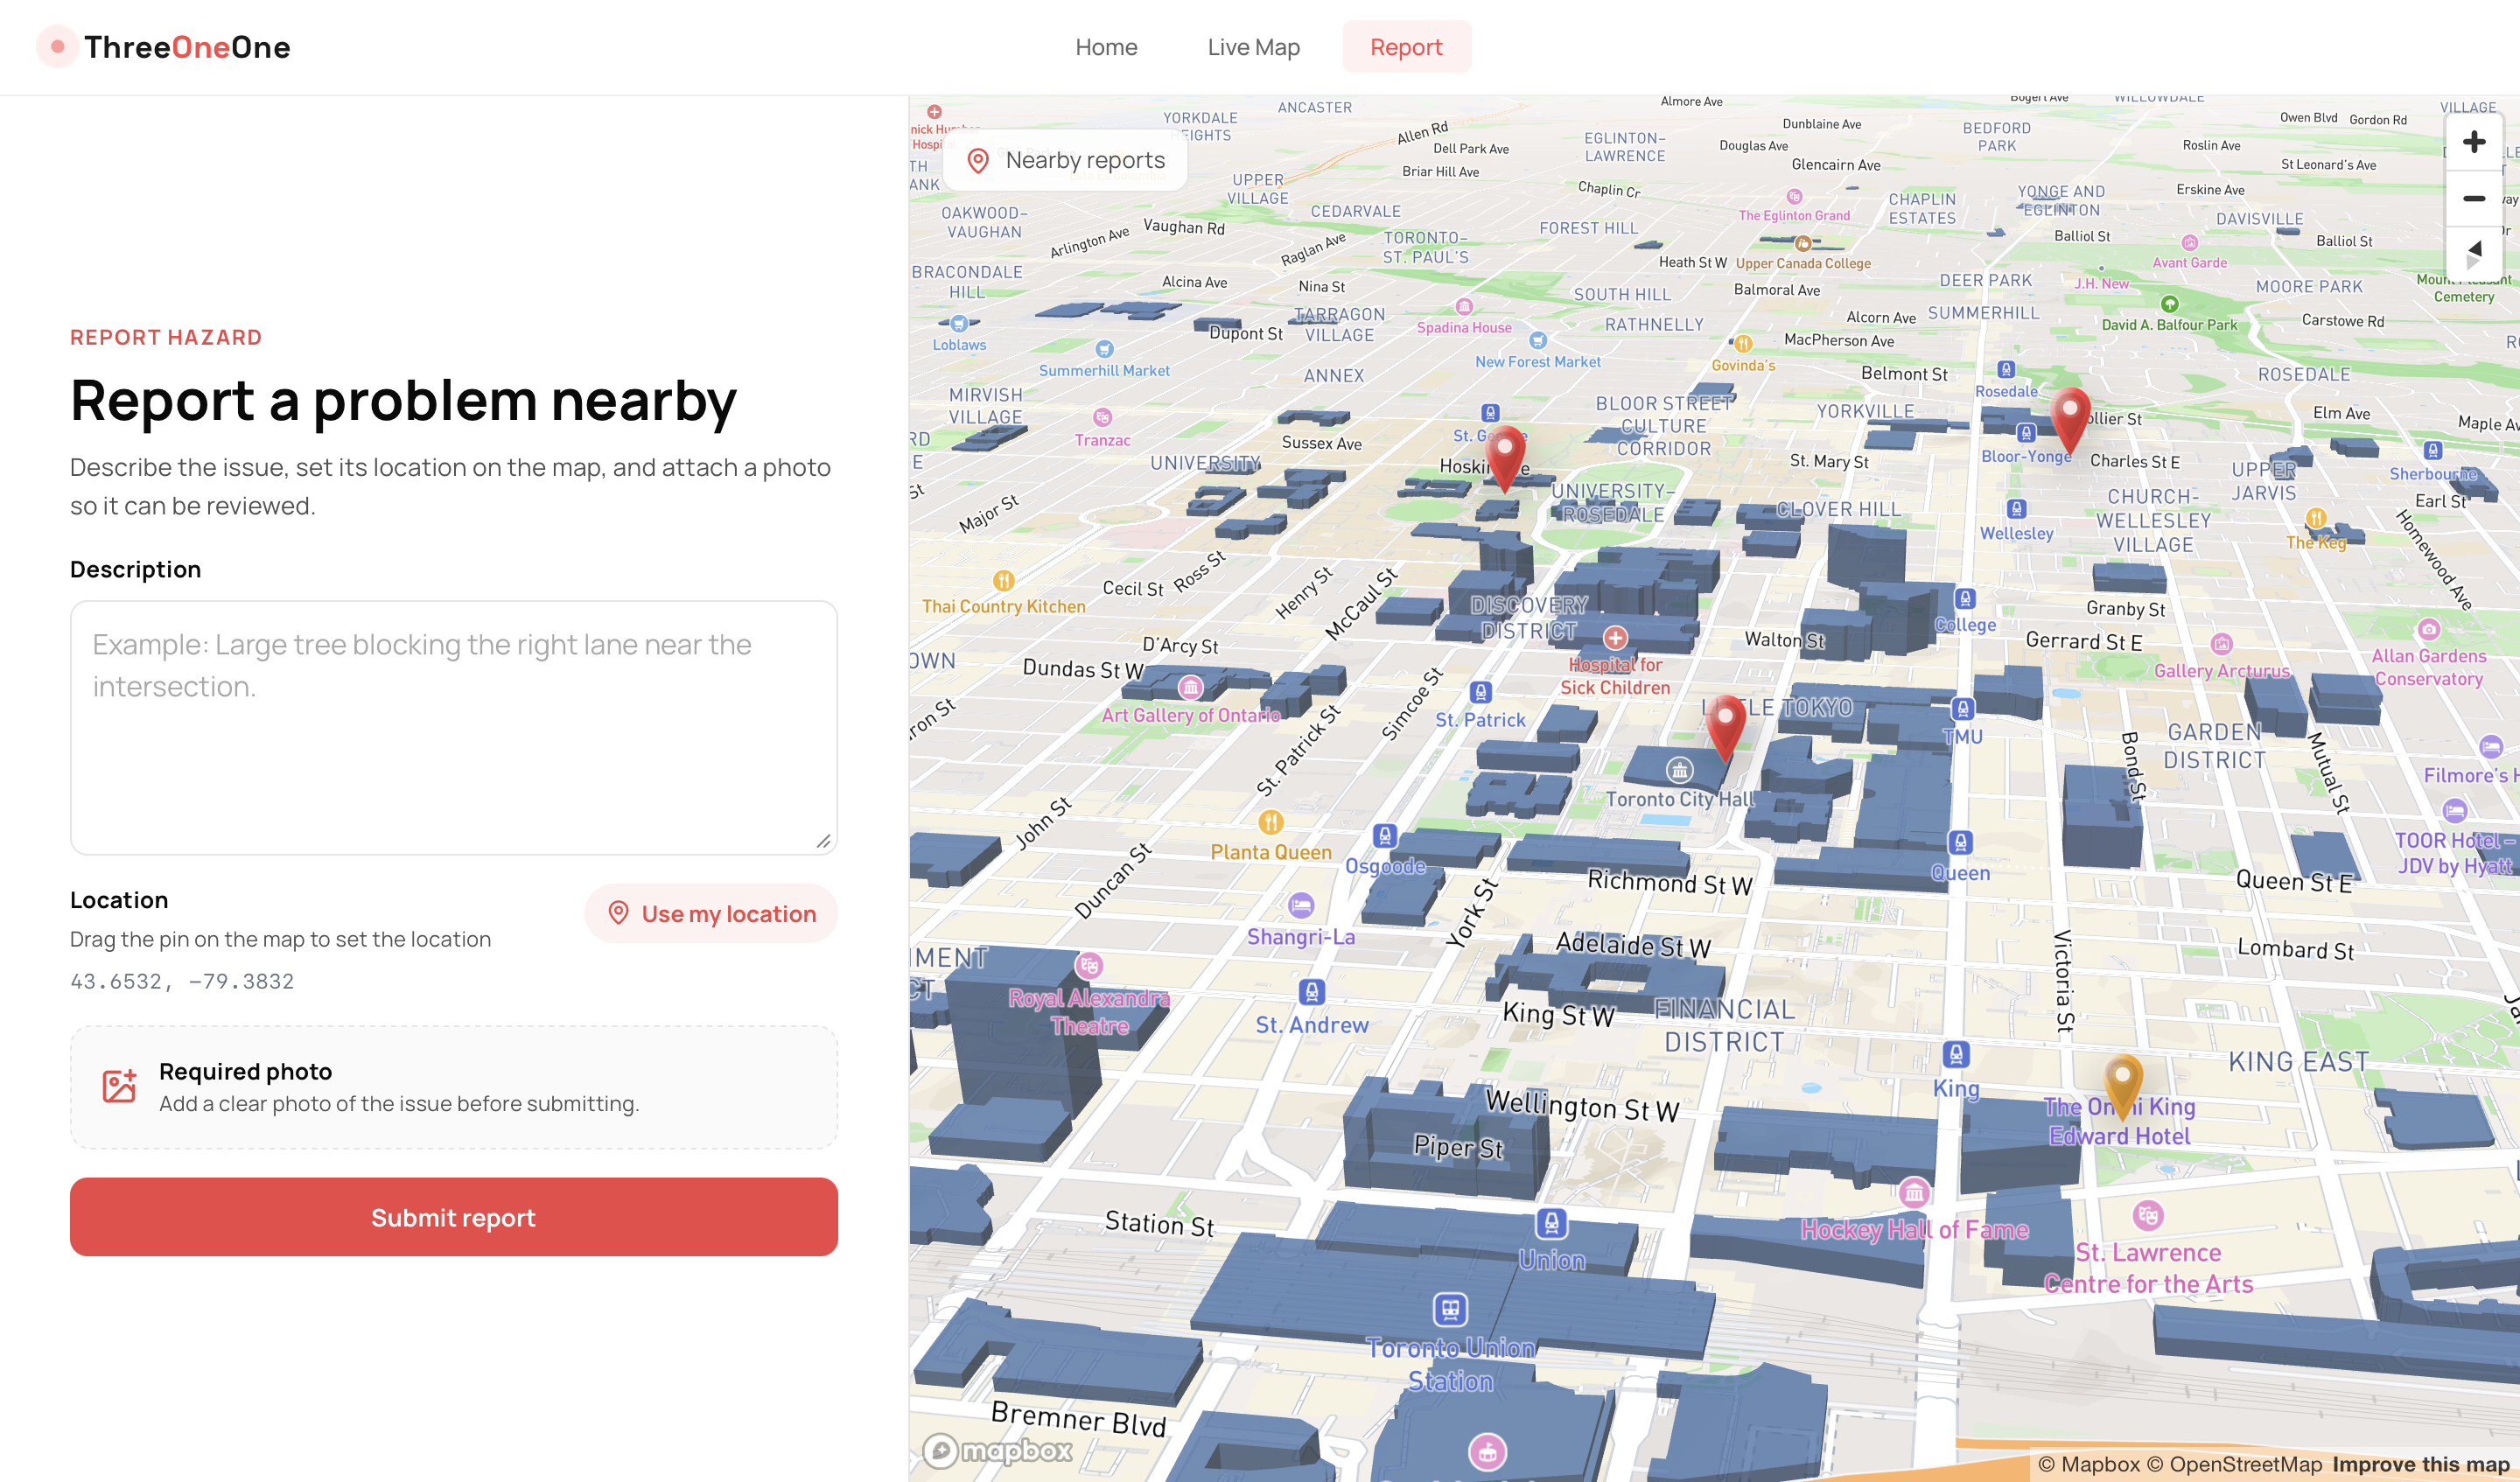
Anyone can submit their own report through the "Report a Hazard" page. The AI runs the same pipeline, then tells the user whether their report joined an existing cluster, created a new one, or didn't appear to show a hazard at all.
How we built it
Data layer: Snowflake: Snowflake is our Geospatial Data Lake and single source of truth. Our ingestion layer pulls in government feeds, social media, and user reports as raw JSON using VARIANT columns. We then use native Snowflake Geospatial functions (like ST_GEOHASH) to turn this noise into mapped data. To make this data useful, we use Snowflake Cortex for native AI summarization. This turns long social media posts into short, one-sentence Dispatch Notes for city workers. The result is a fast system that turns thousands of signals into a clean, real-time hazard map.
ML & API layer — FastAPI + Python:
In the Fast API layer, we hosted ThreeOneOne’s AI prediction model, which uses a Tiered Inference Pipeline for cost-effective scaling.
A high-speed Gemini 3.1 Flash Lite gatekeeper filters out noise, while Gemini 2.5 Flash performs deep multimodal analysis only on suspicious reports.
Our unique edge is Grounded Spatial Reasoning: the AI identifies landmarks and signs via Google Search grounding to infer precise GPS coordinates even without metadata.
Once verified, it pushes enriched hazard data directly to Snowflake to power our real-time map.
Frontend: React + TypeScript + Vite + Mapbox GL JS:
- Live Map page with 3D Mapbox tilt, custom HTML markers colored by confidence tier, and a slide-out detail panel.
- Filter chips reorder the most-supported hazard types (Flooding, Fallen Tree, Road Damage, Traffic Hazard) to the front.
- Clicking a marker filters both the map and sidebar to that hazard category and flies the camera to fit all matching incidents.
- "Report a Hazard" page with draggable map pin, optional photo upload, and a result screen that shows the AI's classification, including the bounding box overlay on the user's own photo.
Challenges we ran into
-Handling messy data imported from different social media apis
- *Integrating snowflake backend with frontend *
- *Integrating fastapi backend with frontend *
- *Gemini API rate limiting: * Low rate limiting from the main model **
Accomplishments that we're proud of
- Learned how to use Mapbox to create a 3d geospatial world.
- A real data pipeline backed by Snowflake, not a flat JSON file.
- A confidence formula that's actually explainable. We can point a judge at
scoring.pyand walk through exactly why a given incident is yellow vs. red. - A backend that does three completely different ML jobs (Gemini 3.1 flash lite classification, Gemini vision, Gemini grounded search) and unifies them into one clean
ClassifiedReportschema. - The pipeline runs end-to-end with stub fallbacks for every external service, so the app boots and produces realistic clustered output even when API keys are missing.
What we learned
- Grounding metadata is a goldmine. Even when Gemini's JSON response was malformed, we could fall back to
response.candidates[0].grounding_metadata.grounding_chunksto recover real news source URLs. Always parse both. - Spatial-temporal DBSCAN is the right tool. Trying to merge "spatially close" and "temporally close" into a single distance metric got messy fast. Two passes, spatial first, then temporal splits, was both simpler and gave better clusters.
- A real database changes everything. Putting Snowflake in front of the pipeline early, instead of "we'll swap the JSON file later", meant our data model was forced to be production-shaped from day one.
What's next for ThreeOneOne
- More social ingest.: Get api permissions from Meta, Instagram, and other social medias to gather more data.
- Snowflake-side analytics. Now that every report we've ever processed is queryable, build a small admin dashboard showing trend lines: hazards by type per day, neighborhoods with the highest report density, sources with the highest accuracy.
- WebSocket live updates. Right now the frontend polls and a backend script has to be run to send database info to frontend. In the future, incidents should push to the map the moment a new cluster forms.
- Trust scoring per source. Track which accounts have historically been accurate vs. noisy and weight their reports accordingly. Snowflake makes the historical join trivial.
- Resolved-incident workflow. Once a city crew clears a hazard, mark the incident resolved and decay it off the map.
- City partnerships. Talk to municipal 311 teams about piloting it as a pre-call signal feed.
Built With
- ai-agent
- ai-tooling
- cortex-ai
- fastapi
- geospatial
- google-gemini
- machine-learning
- mapbox
- python
- react
- snowflake
- typescript
- vite

Log in or sign up for Devpost to join the conversation.