-
-
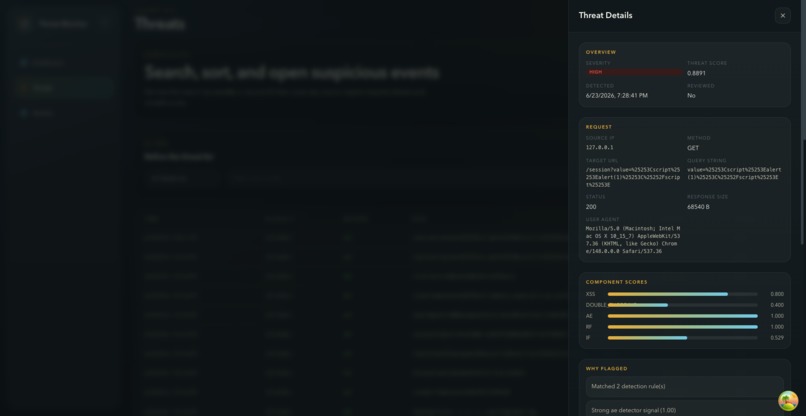
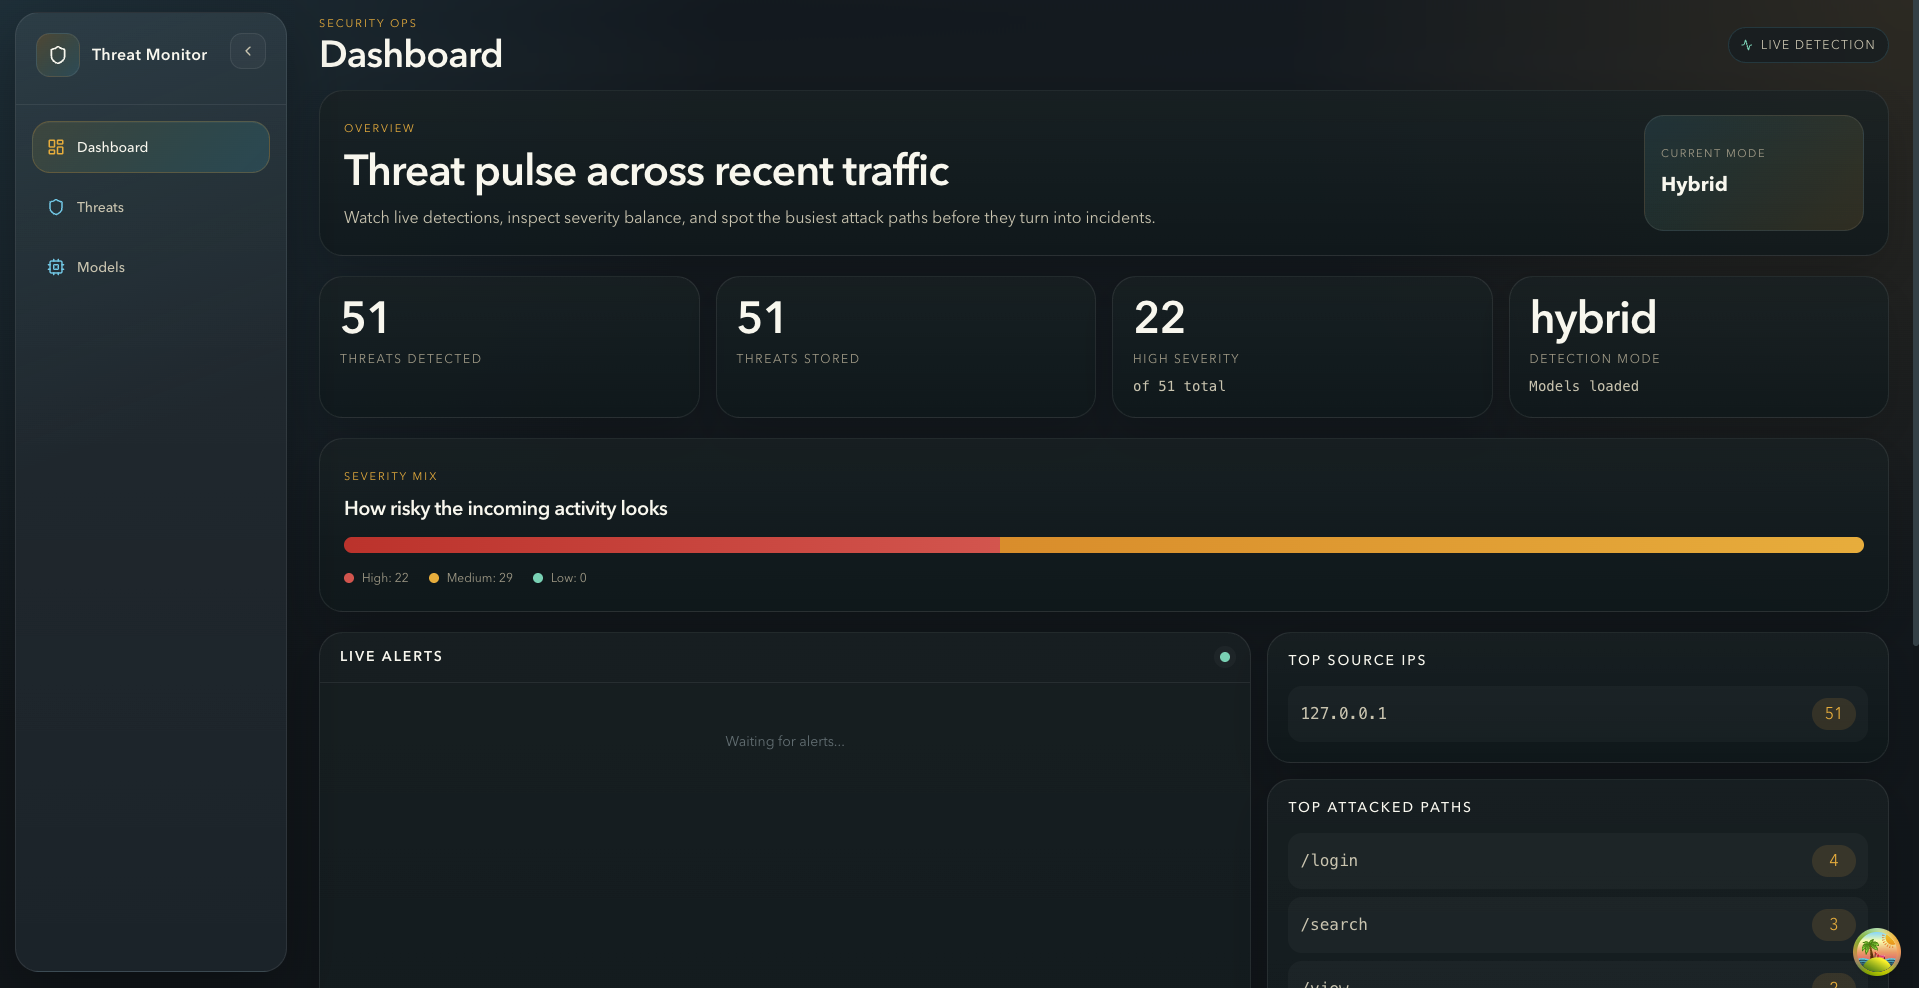
threat-overview
-
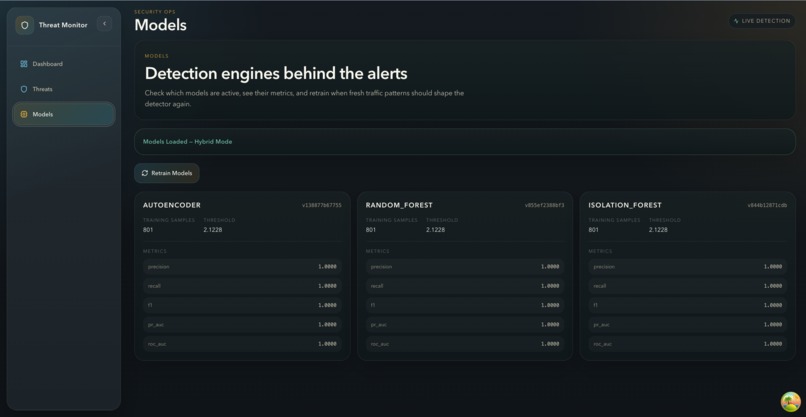
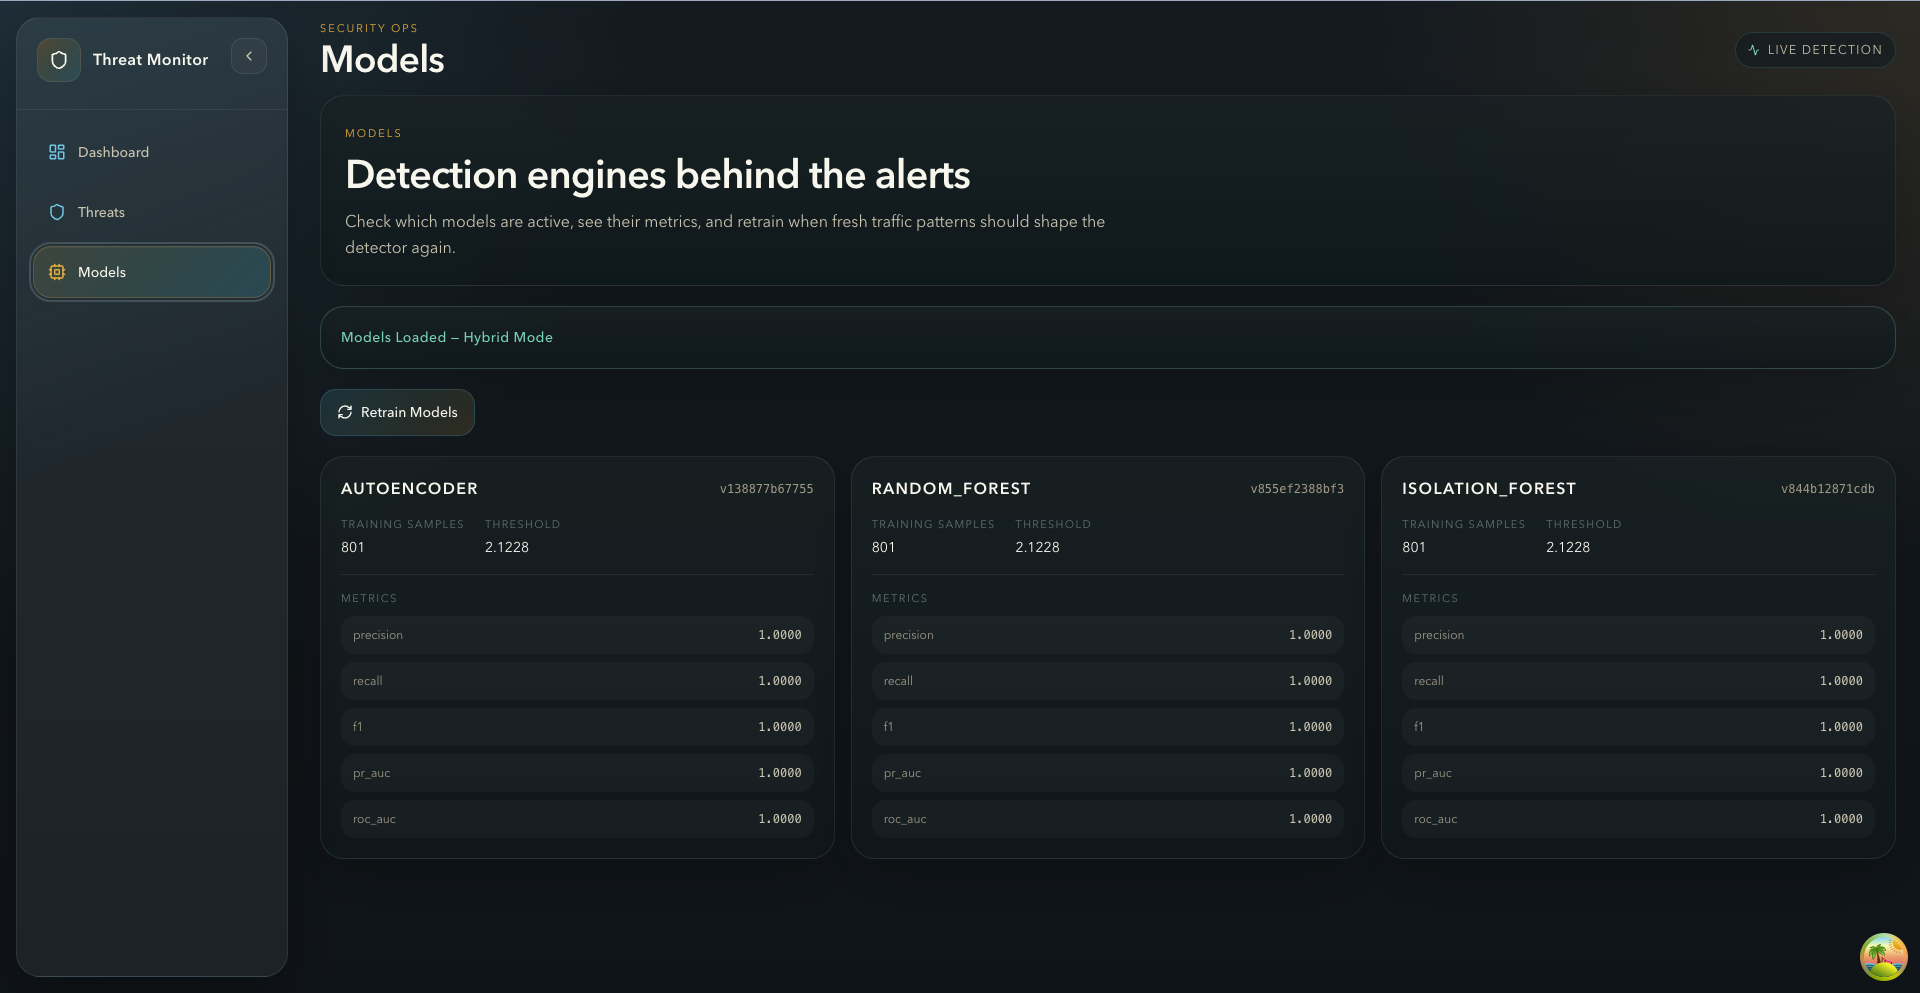
models-and-retraining
-
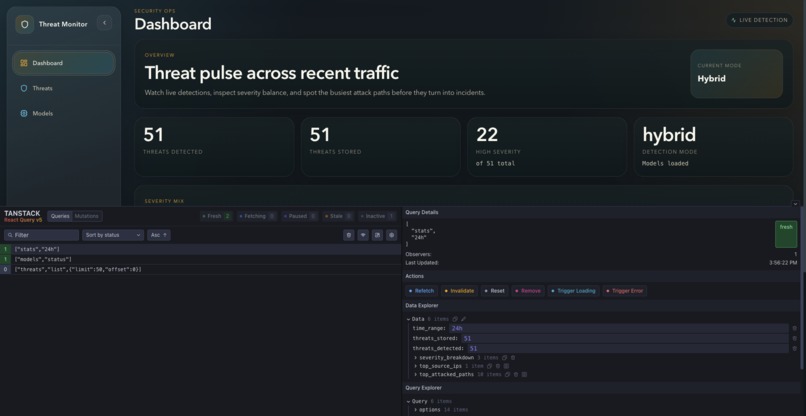
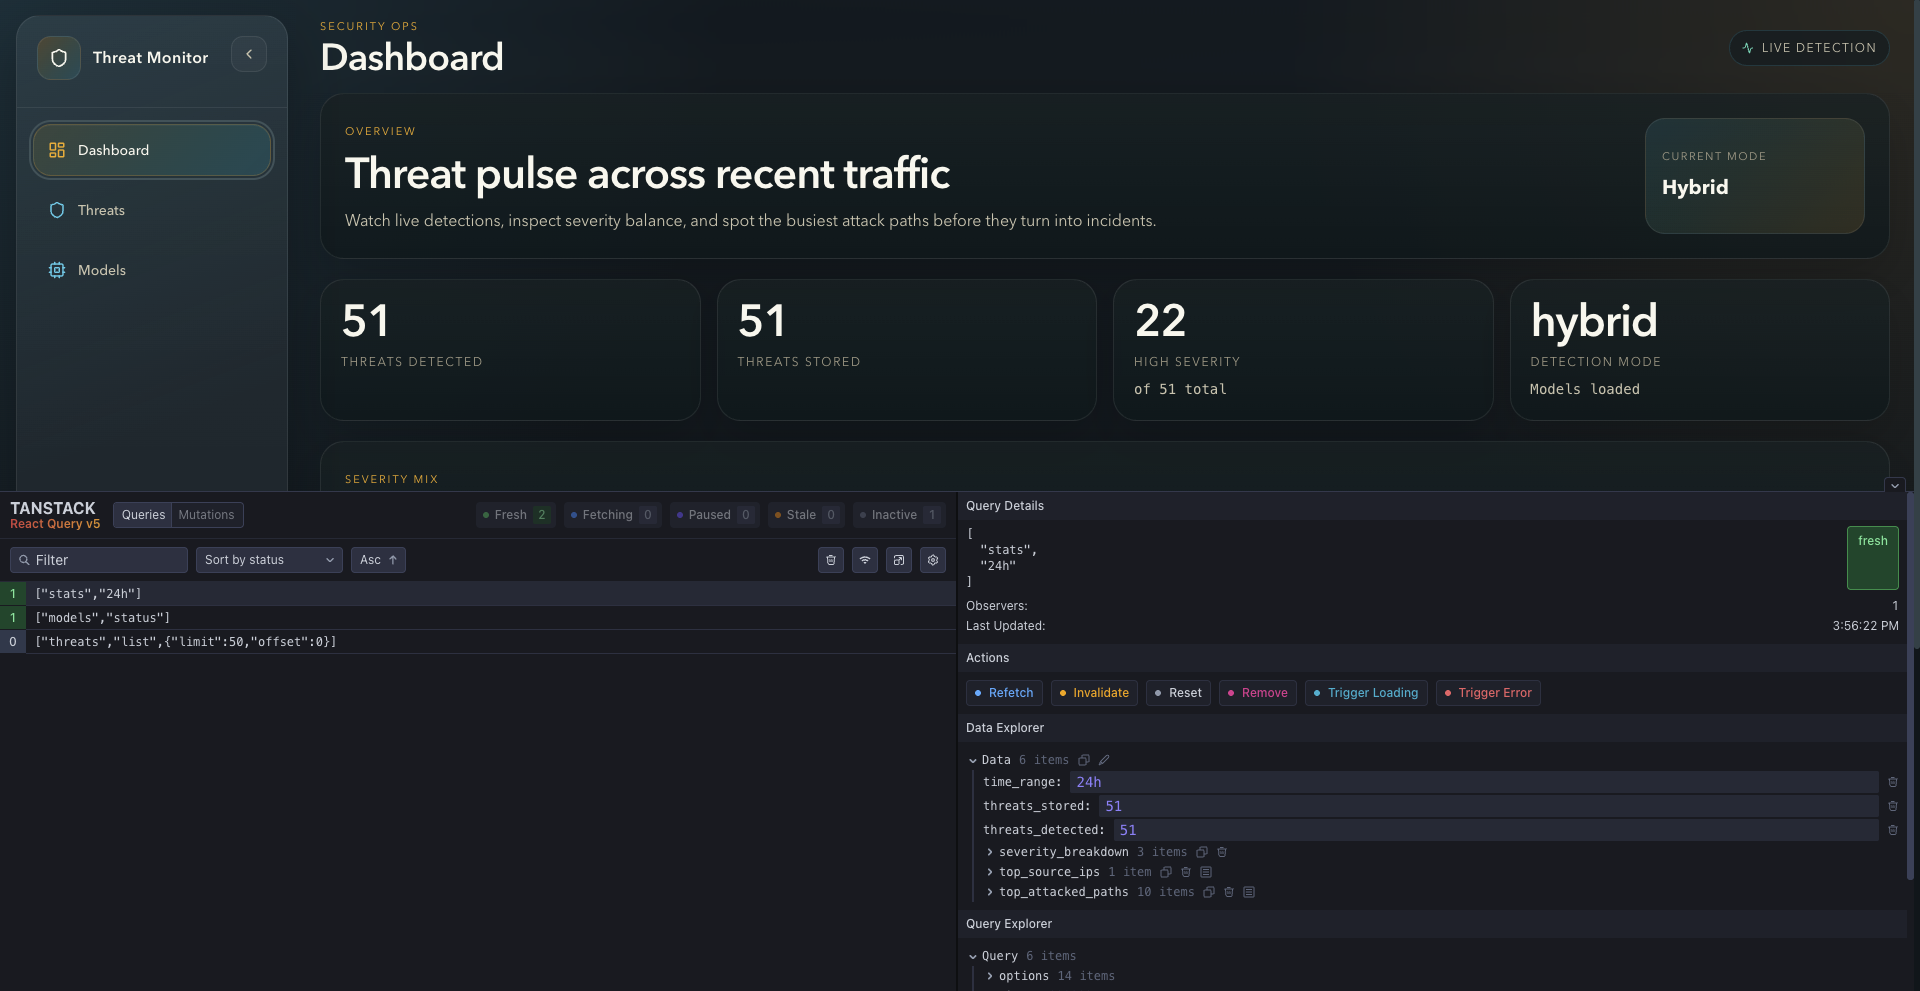
dashboard-with-live-query-devtools
-
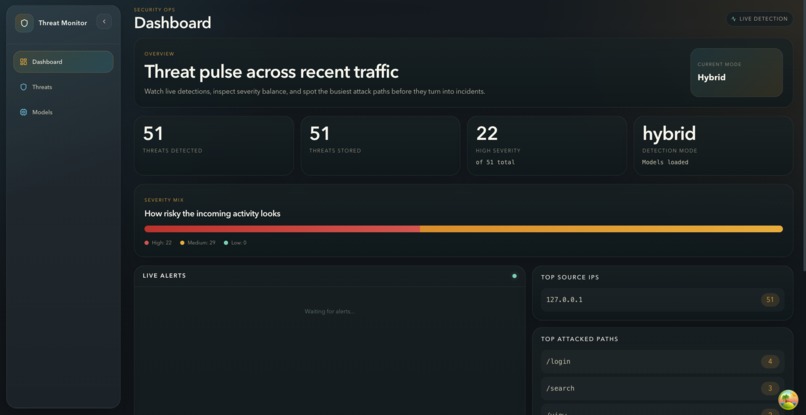
dashboard-overview
-
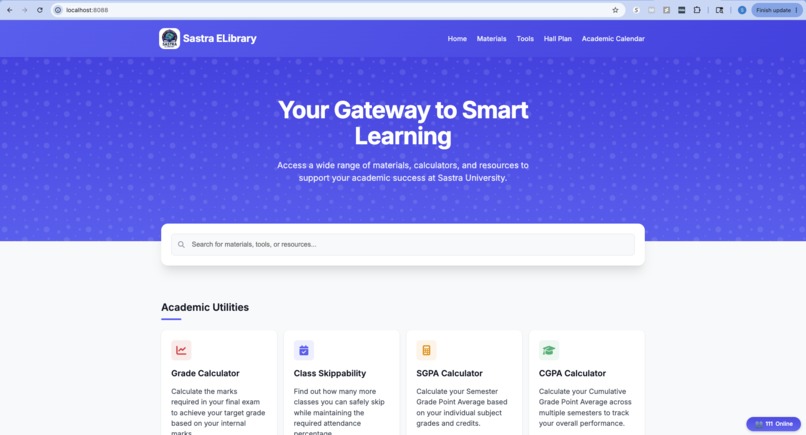
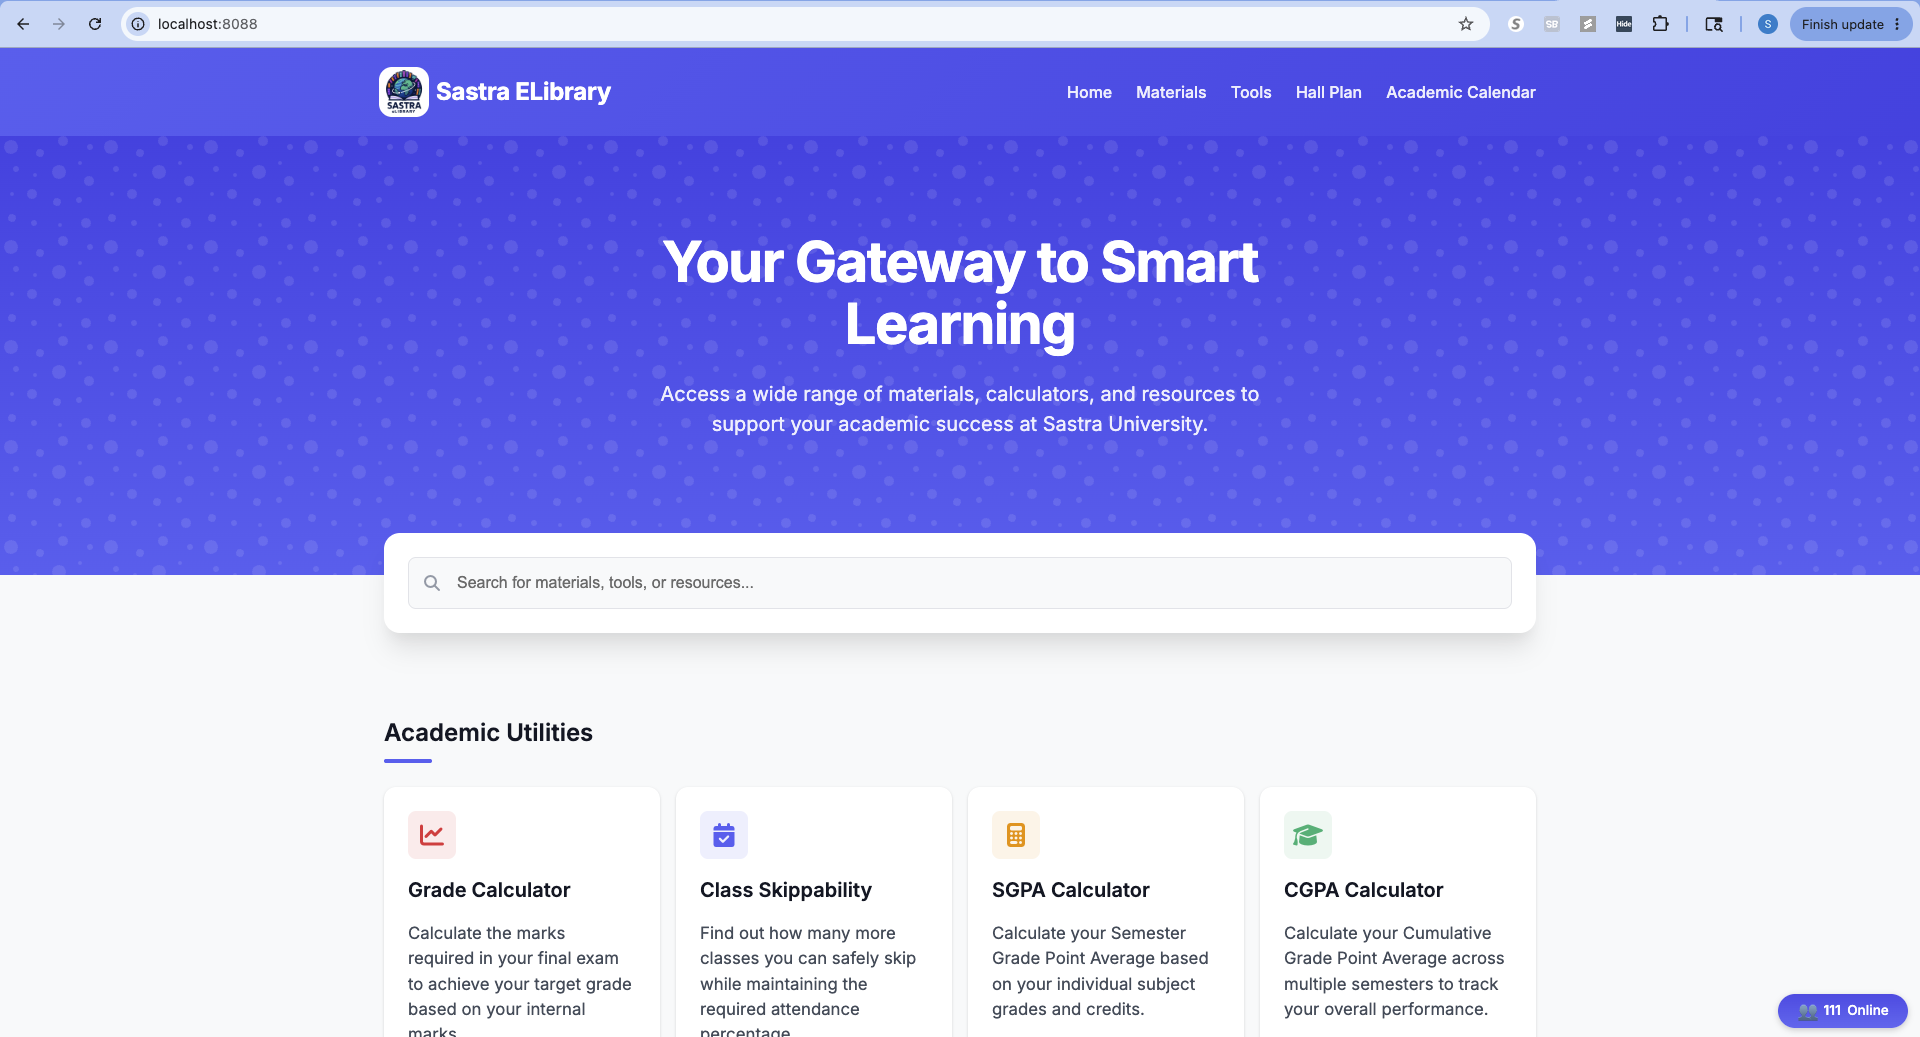
protected-site
-
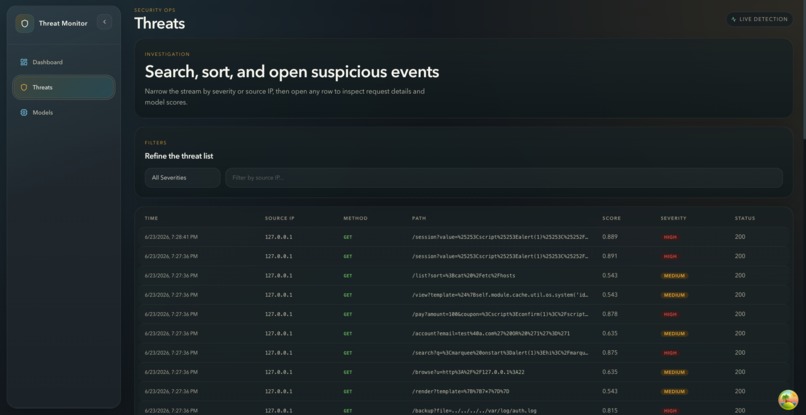
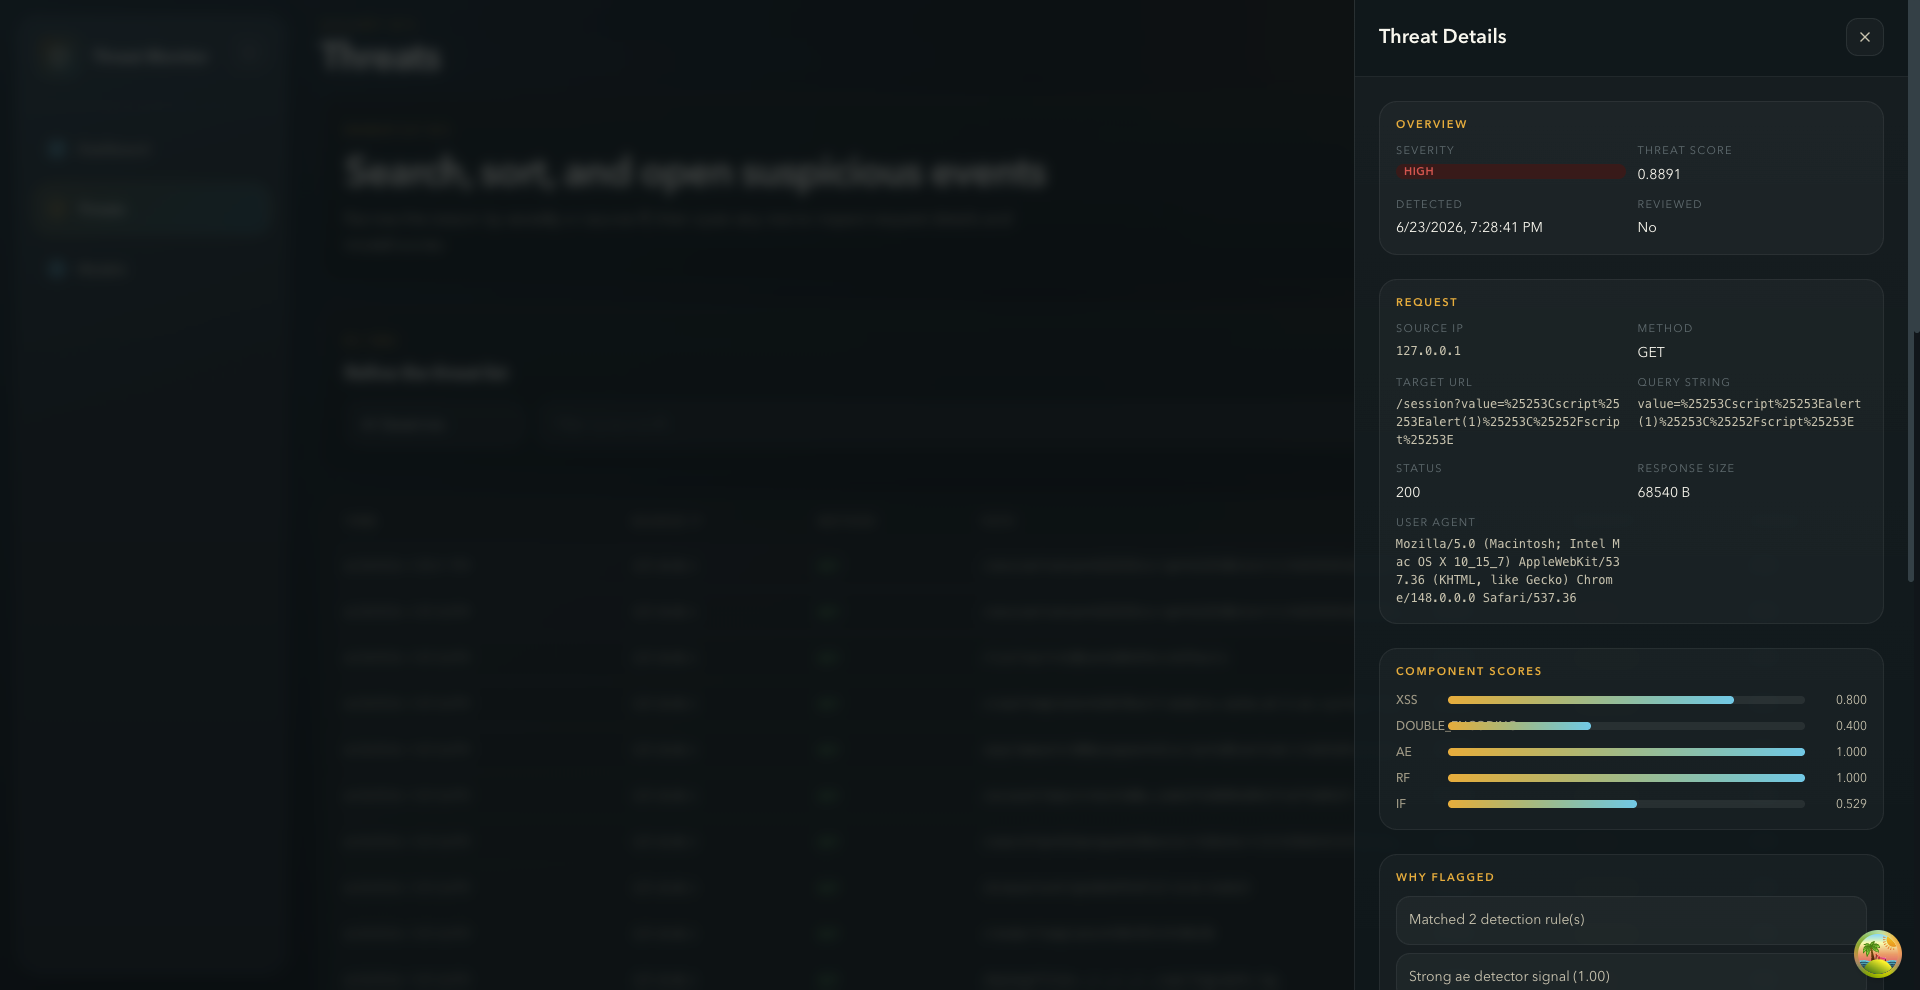
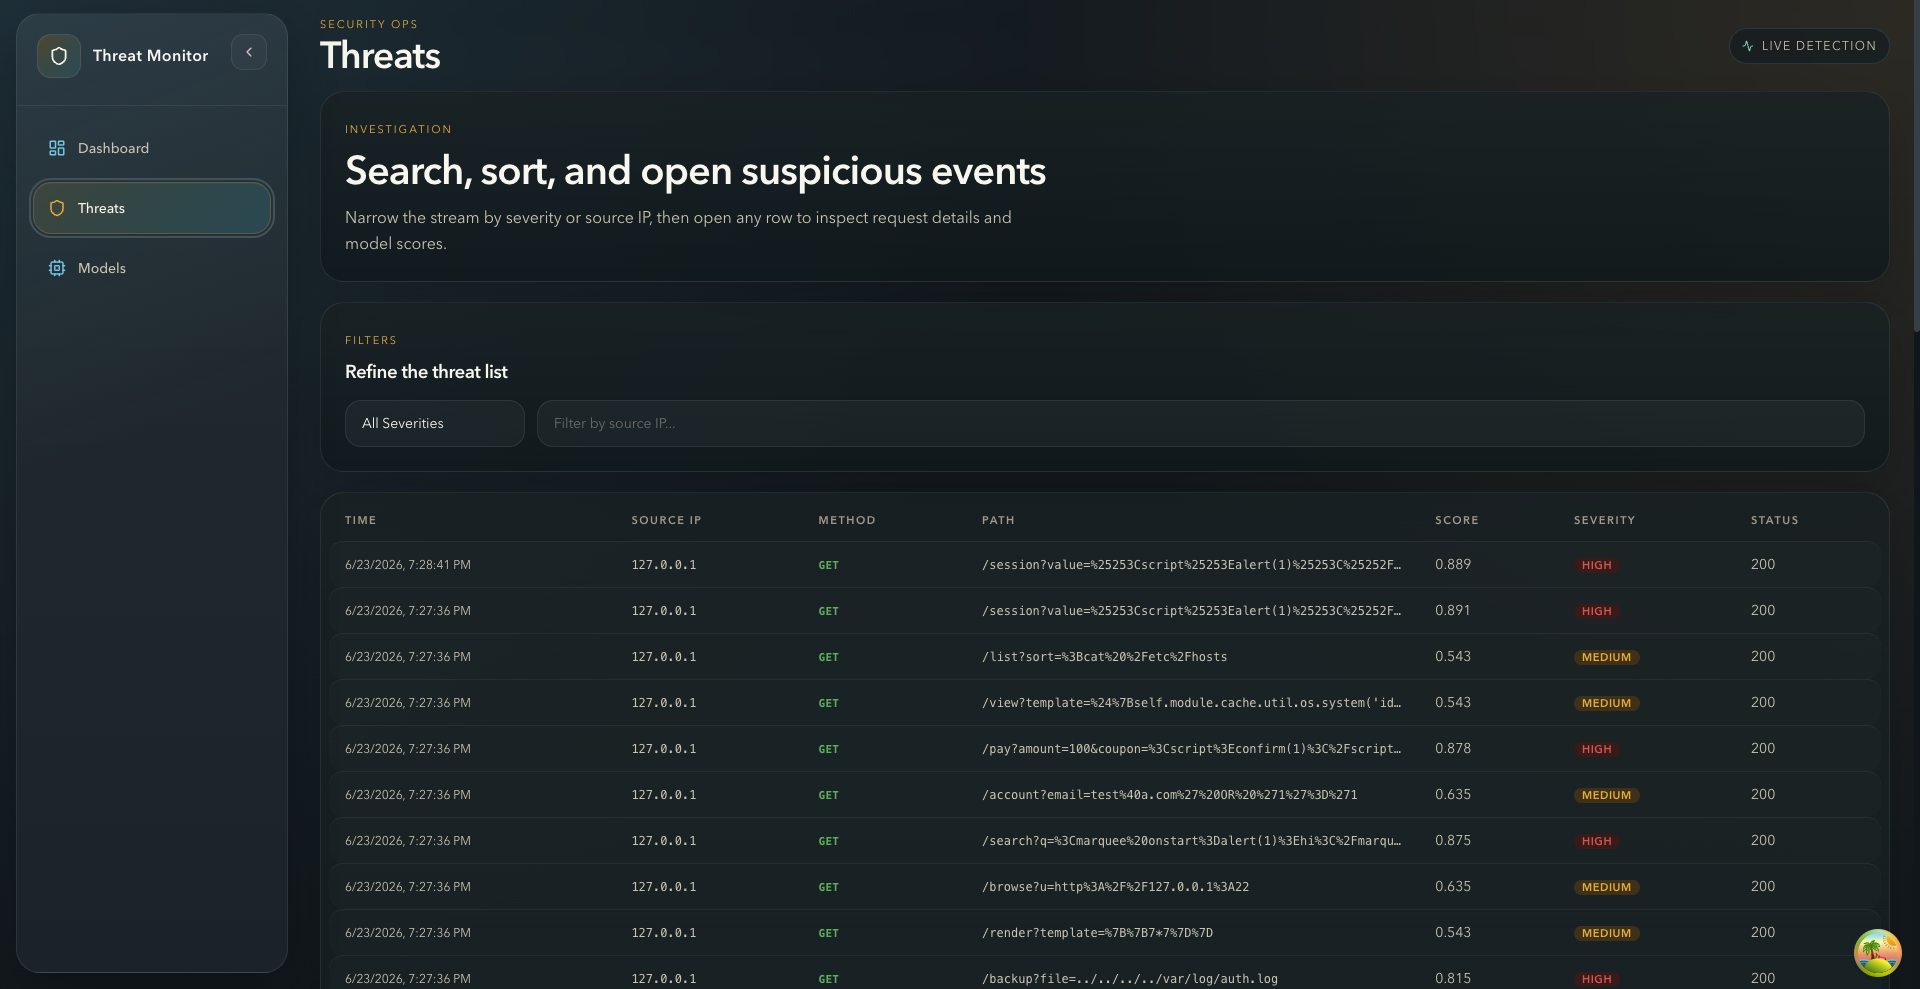
threat-details-panel
Inspiration
This project started with a real responsibility, not just a project idea.
I built sastraelibrary.netlify.app, a student-focused website that is used by more than 5,000 students and has already seen 30,000+ clicks. Watching that kind of usage felt exciting, because it meant the platform was genuinely helping people. But it also made me realize something uncomfortable: the more real your users are, the more real your risks become.
I could see growth. I could see engagement. I could see students using the platform.
What I could not clearly see was the security side of that traffic.
If suspicious requests were hitting the site, if someone was probing endpoints, if encoded payloads or attack patterns were appearing in requests, I had no simple way to understand that in a practical, visual, and actionable way. I did not want to wait until a problem became visible through damage. I wanted visibility earlier.
That feeling is what led to Threat Monitor.
I wanted to build something for website owners like me, people who may not have enterprise-grade security tooling, but still have real users, real traffic, and real reasons to care about protecting what they built.
The problem I wanted to solve
A lot of small websites are in an awkward position.
They are large enough to matter. They are public enough to be exposed. They are useful enough to attract repeated visitors. But they are still too small to have expensive monitoring systems or dedicated security teams.
That means many developers can answer questions like:
- How many users visited my site?
- Which features are getting used?
- How many clicks did I get?
But they often cannot answer equally important questions like:
- Is someone repeatedly targeting my login route?
- Are suspicious payloads being sent to my site?
- Which paths are being attacked most often?
- Why was a specific request dangerous?
- What should I do when I detect something suspicious?
That gap between traffic visibility and threat visibility is what I wanted to close.
What Threat Monitor is
Threat Monitor is a web-based cybersecurity solution that turns raw web server access logs into a live threat investigation experience.
Instead of leaving the user with endless log lines, the system tries to answer the questions that actually matter:
- What happened?
- Why does it look suspicious?
- How severe is it?
- What exactly was requested?
- What should the website owner do next?
Threat Monitor watches nginx access logs, parses the requests, scores them using a hybrid combination of rules and machine learning, and presents the results in a dashboard designed for understanding and response.
It includes:
- a live dashboard for security overview
- a searchable threats page for investigation
- detailed threat views with request data, model scores, and explanations
- recommended actions and a response playbook
- retrainable machine learning models so the system can adapt over time
Why this project matters to me
This project feels personal to me because it came from a real problem I could imagine facing on a real website.
When you build something used by thousands of students, the project stops feeling hypothetical. It starts feeling like something you are responsible for. That changes how you think.
You stop asking:
- “Can I build a security dashboard?”
And start asking:
- “If something suspicious happens to a site people rely on, will I even know in time?”
Threat Monitor is my answer to that question.
It is not just about detection for the sake of detection. It is about giving smaller builders a clearer sense of what is happening around their applications and helping them respond before confusion turns into risk.
How I built it
I built the backend using Python and FastAPI. It watches nginx logs, parses request data, extracts security-related features, and runs requests through a hybrid detection pipeline. That pipeline combines rule-based analysis with machine learning scoring so it can catch both known suspicious patterns and unusual behavior.
I built the frontend with React and TypeScript. I wanted it to feel less like a raw admin panel and more like an investigation workspace. That is why the threat detail view includes not just severity, but also:
- exact request context
- component scores
- detection explanations
- recommended actions
- a response playbook
I also added retraining support so the project would feel like a living detection system rather than a frozen demo.
For the demonstration, I connected Threat Monitor to a site running behind nginx so it could analyze real access logs in a controlled and believable setup.
Challenges I ran into
One of the hardest parts was not just building detection, but building clarity.
A lot of tools can produce a score. Far fewer tools can help a normal developer understand what that score means.
I spent a lot of time thinking about how to make the output feel useful. If a system says “this is suspicious” but the user still feels lost, the tool has not really solved the problem. That is why I added explanations, recommended actions, and response steps.
Another challenge was making the whole project feel like a complete story. I needed:
- real traffic generation
- real server logs
- a working detection pipeline
- a live frontend
- and a flow that made sense to someone seeing it for the first time
That meant working across backend engineering, machine learning workflow, and frontend UX at the same time.
What I’m proud of
I am proud that Threat Monitor feels connected to a real-world need.
It was inspired by a real student-facing website, a real audience, and a real concern: how do I monitor threats around something people are actively using?
I am also proud that the project tries to go beyond detection alone. It does not stop at saying “this request is dangerous.” It also tries to explain why, show evidence, and guide the next step.
To me, that is what makes it feel meaningful.
What I learned
This project taught me that security tools need both technical depth and emotional clarity.
Detection models, rule engines, log pipelines, and dashboards are important, but the real value comes from helping someone feel less blind. I learned that good security tooling is not only about identifying threats. It is also about reducing uncertainty.
I also learned a lot about building full-stack systems that connect:
- log monitoring
- threat analysis
- machine learning workflows
- live frontend updates
- and investigation-focused user experience
What’s next for AI Threat Monitor
The next step for Threat Monitor would be making it even more useful in real deployments. I would like to add:
- better long-term threat history
- clearer trend analysis
- more advanced explanations
- stronger repeated-attacker workflows
- more deployment options for real websites
My bigger goal is simple: to make smaller website owners feel like security visibility is something they can actually have, understand, and act on.
Built With
- axios
- biome
- fastapi
- html
- imbalanced-learn
- machine-learning
- nginx
- numpy
- onnx
- onnx-runtime
- pandas
- pydantic
- python
- pytorch
- react
- react-icons
- react-router
- redis
- scikit-learn
- scss
- shell
- sonner
- sqlalchemy
- sqlite
- sqlmodel
- tanstack-query
- typescript
- uv
- uvicorn
- vite
- websockets
- zod
- zustand


Log in or sign up for Devpost to join the conversation.