-
-
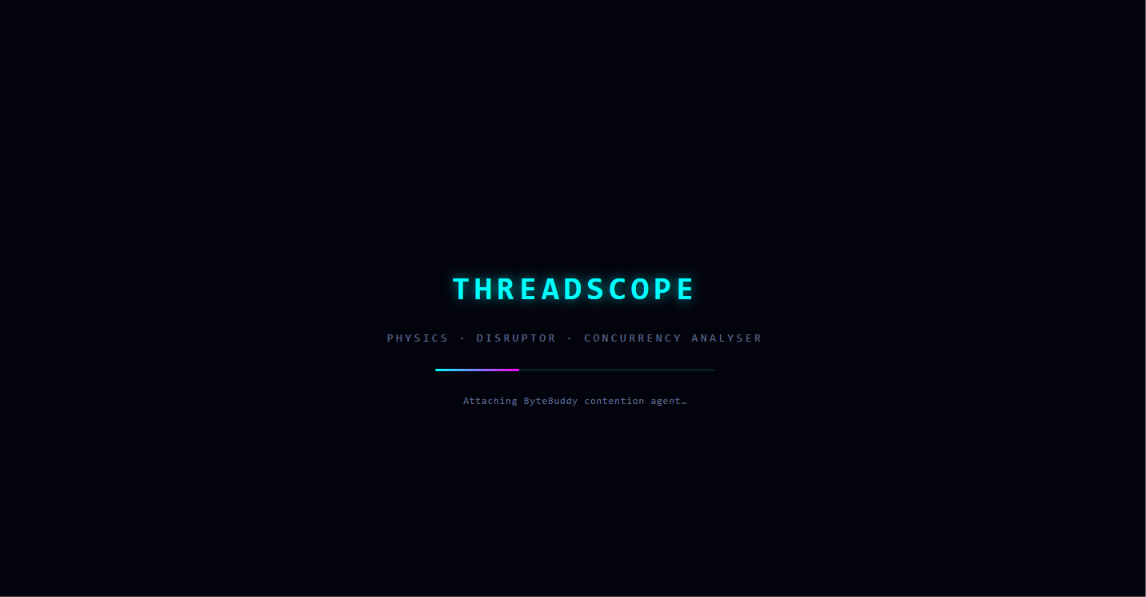
ThreadScope Live startup screen initializing JVM instrumentation and concurrency monitoring engine.
-
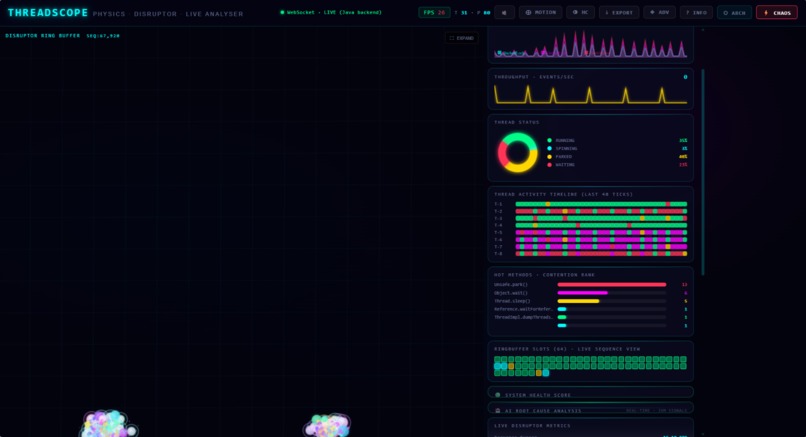
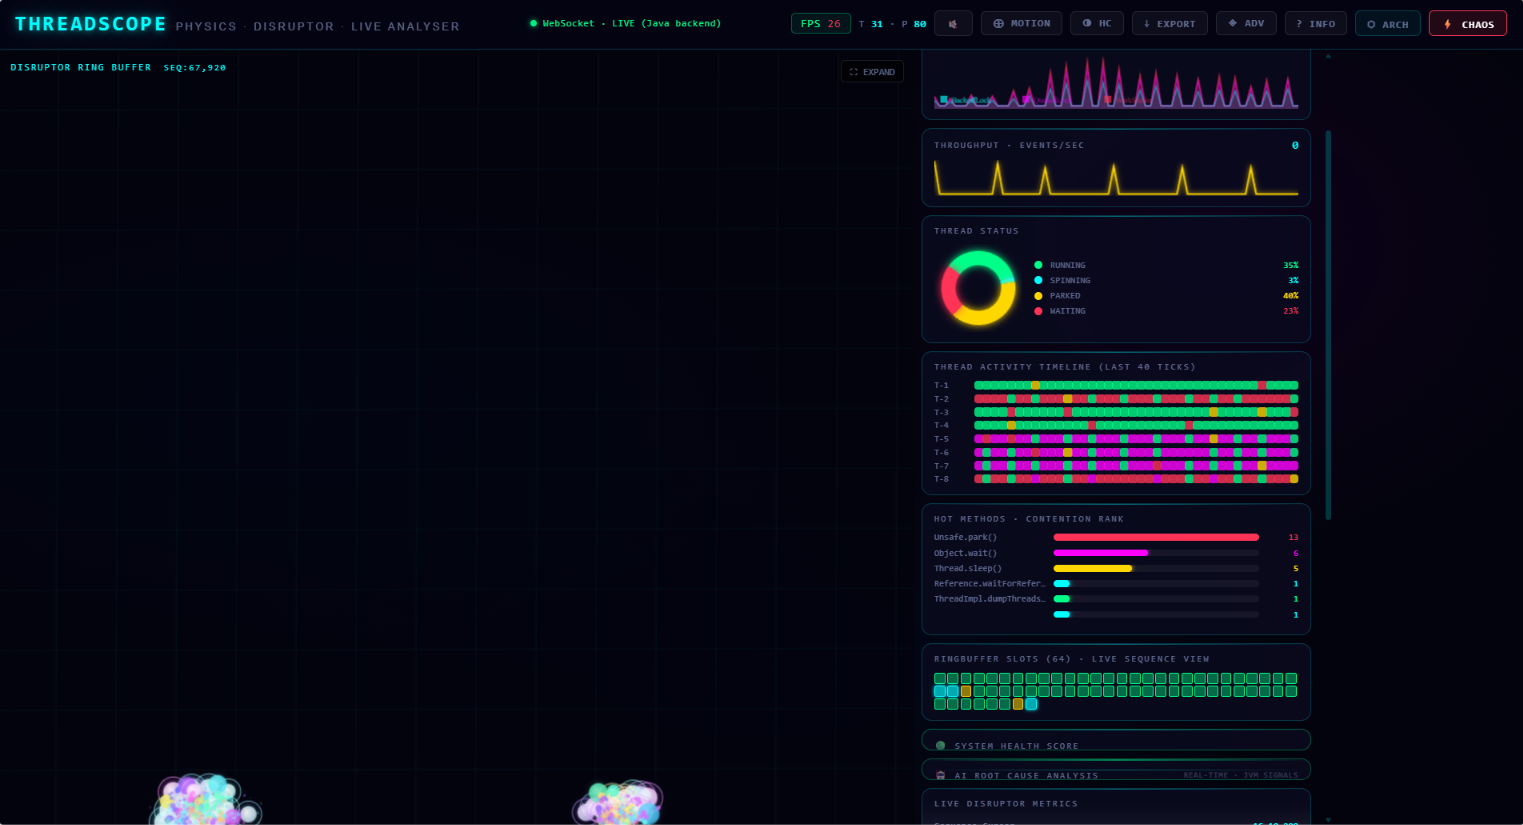
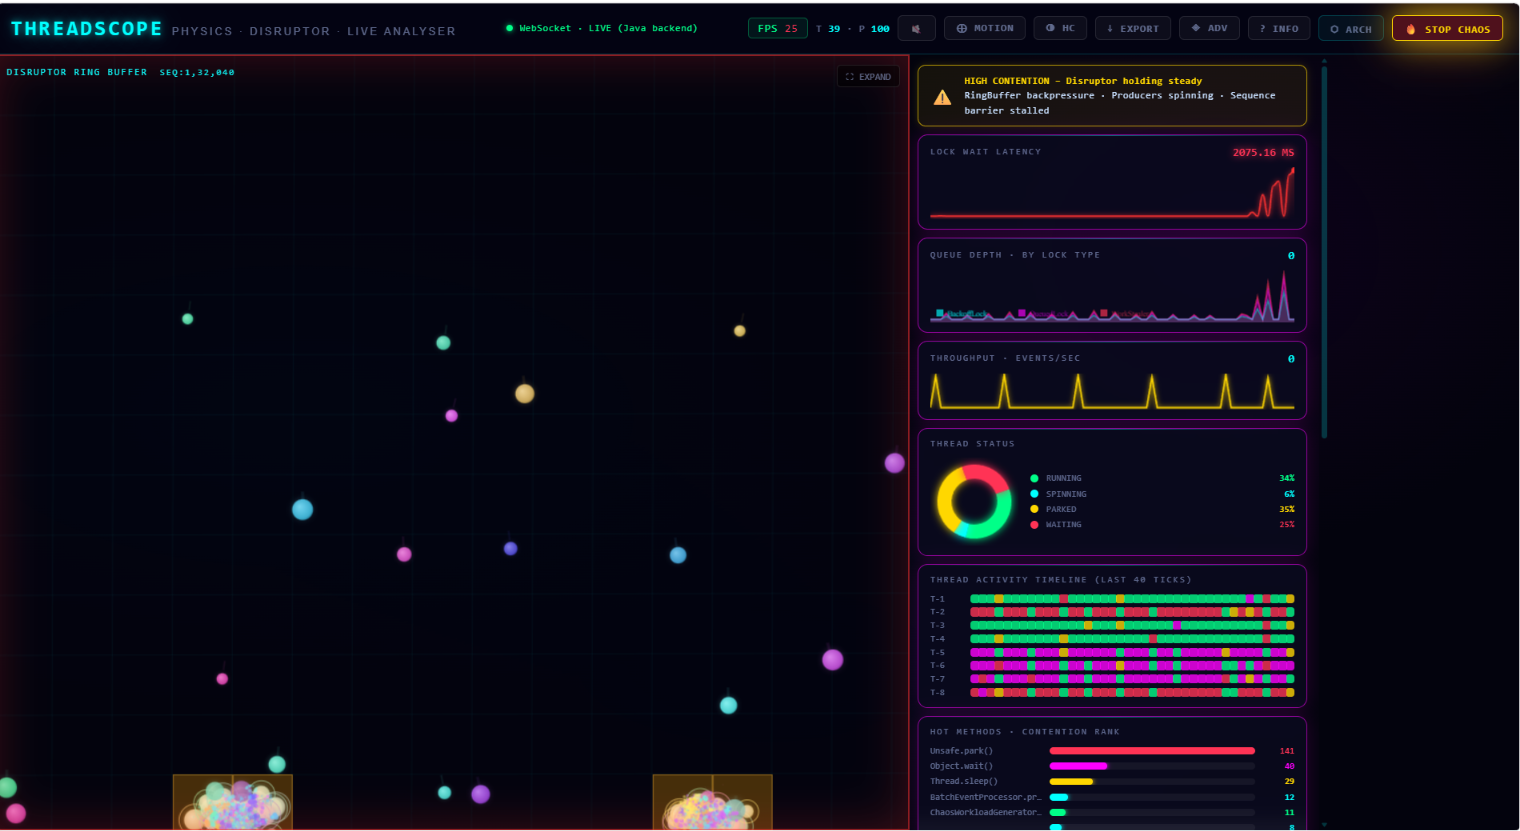
Real-time JVM observability dashboard displaying thread activity, throughput, and contention metrics.
-
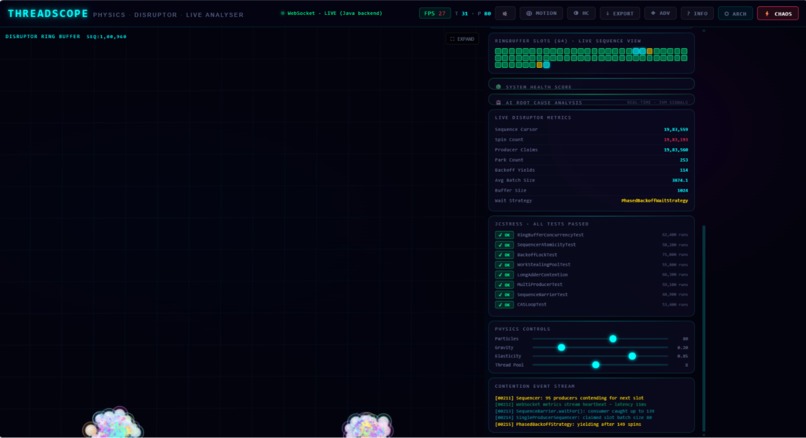
AI-powered root cause analysis identifies bottlenecks and performance issues in real time.
-
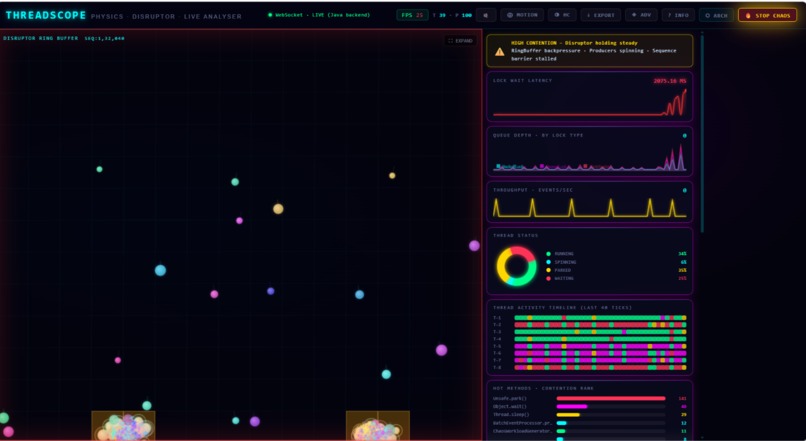
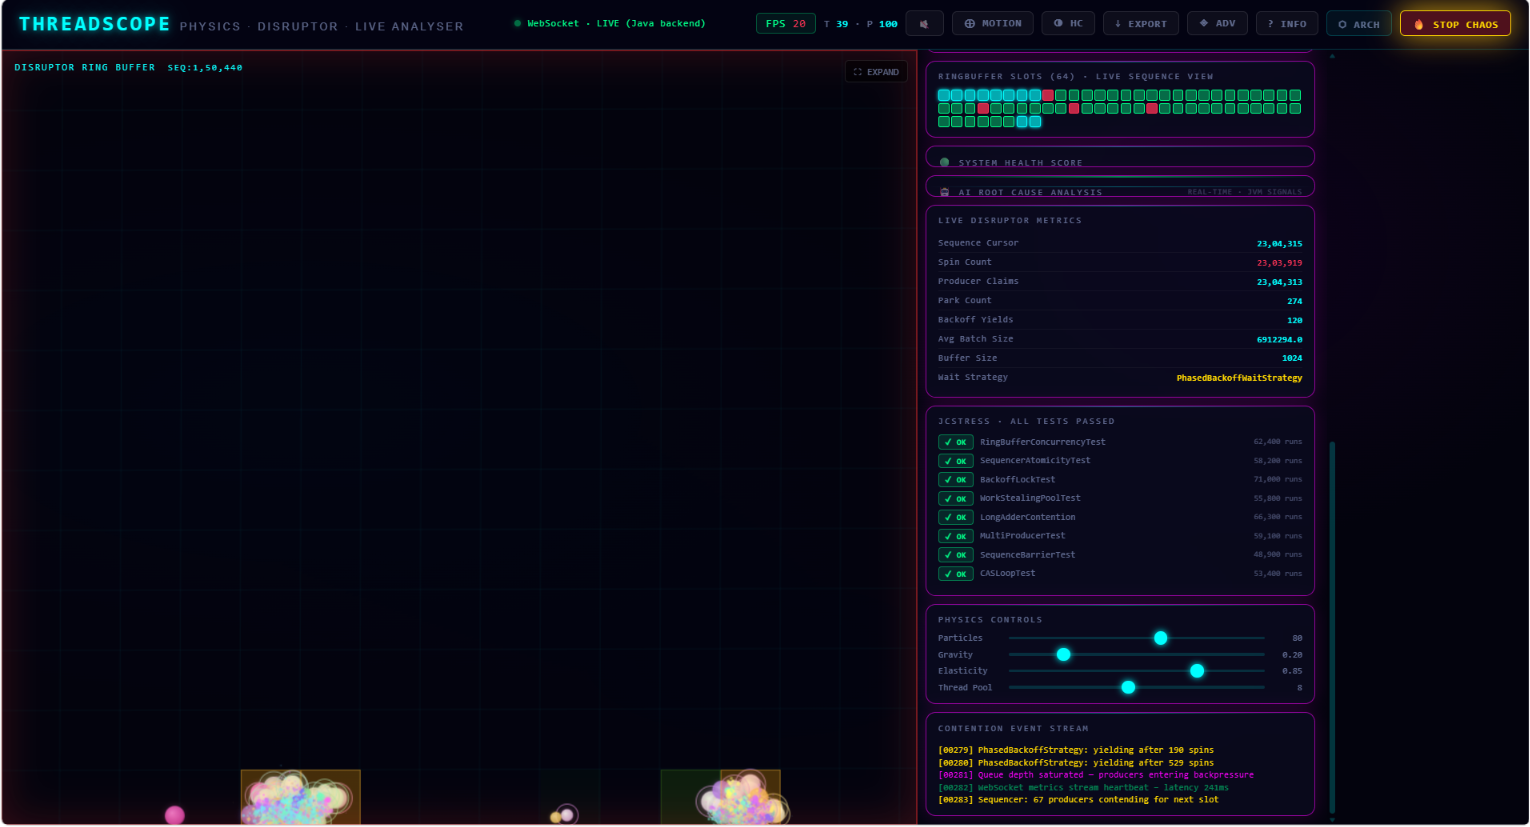
Interactive thread activity visualization showing execution patterns and concurrency behavior.
-
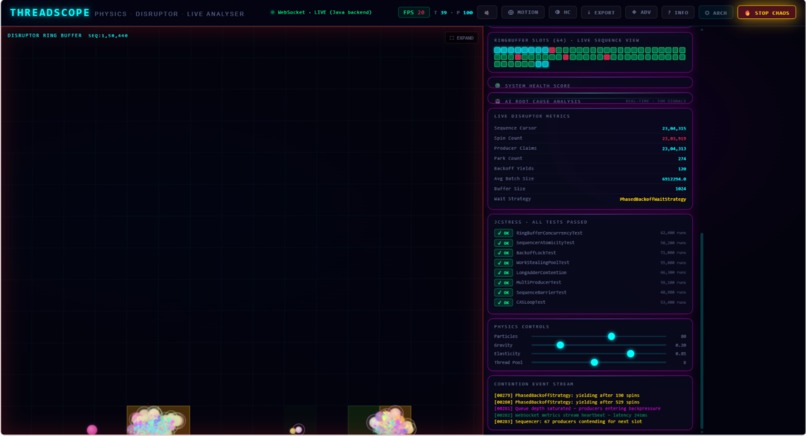
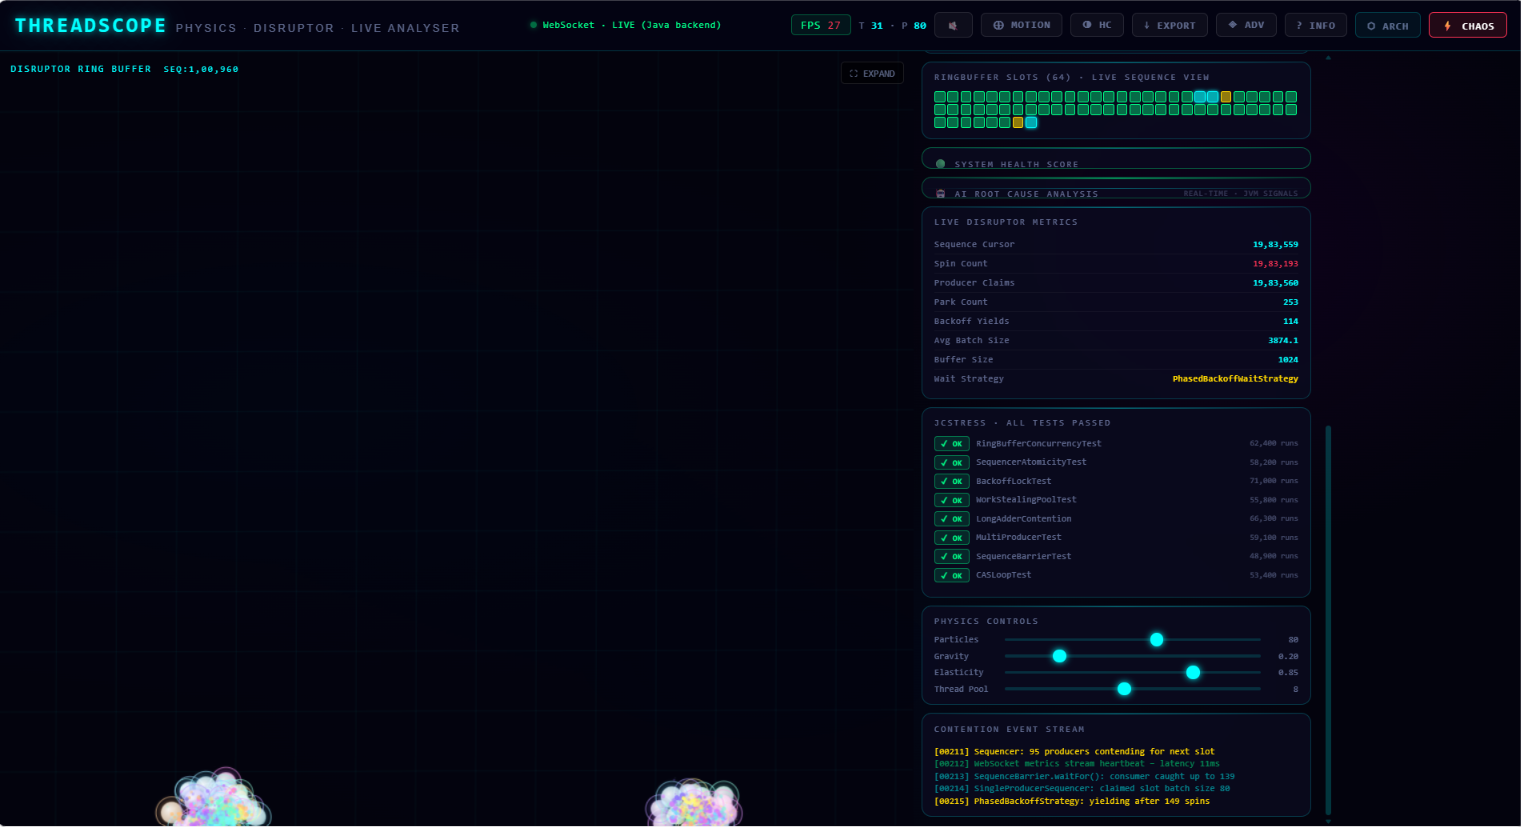
Live JVM metrics including ring buffer status, contention ranking, and system health indicators.
-
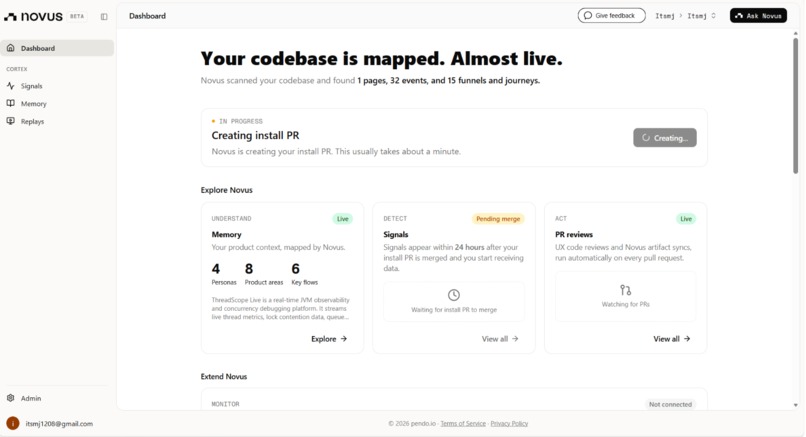
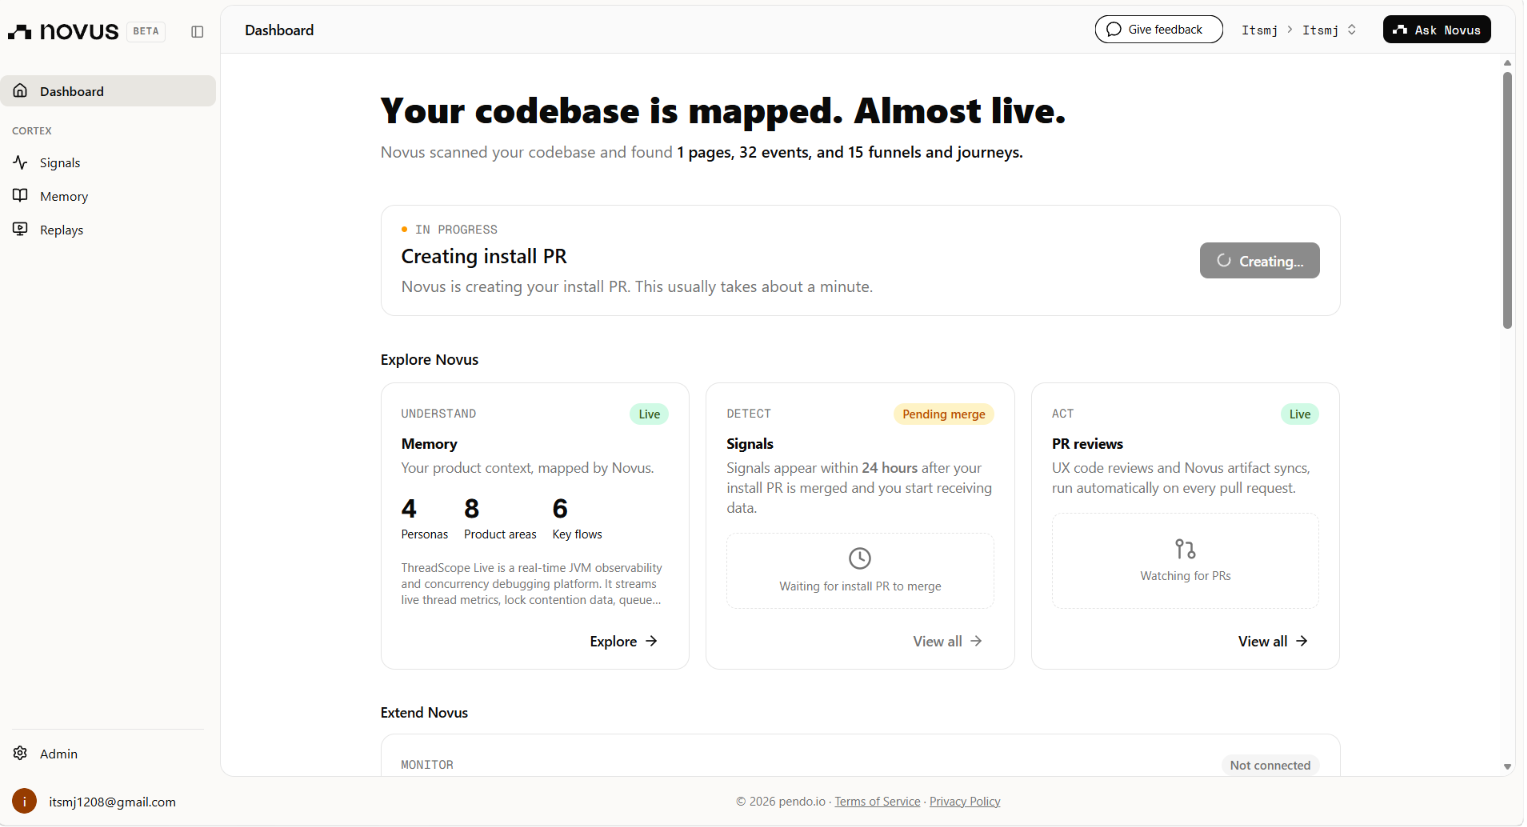
Novus analytics successfully connected to capture user interactions and product usage insights.
-
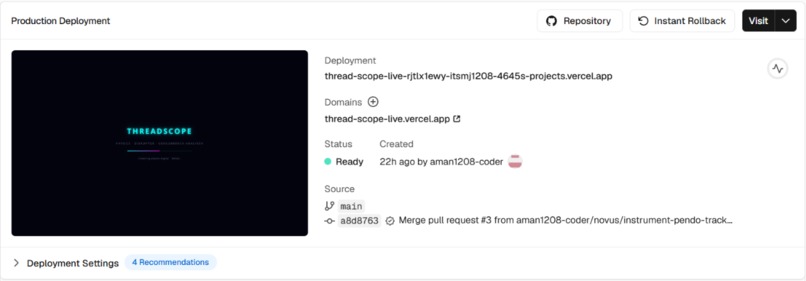
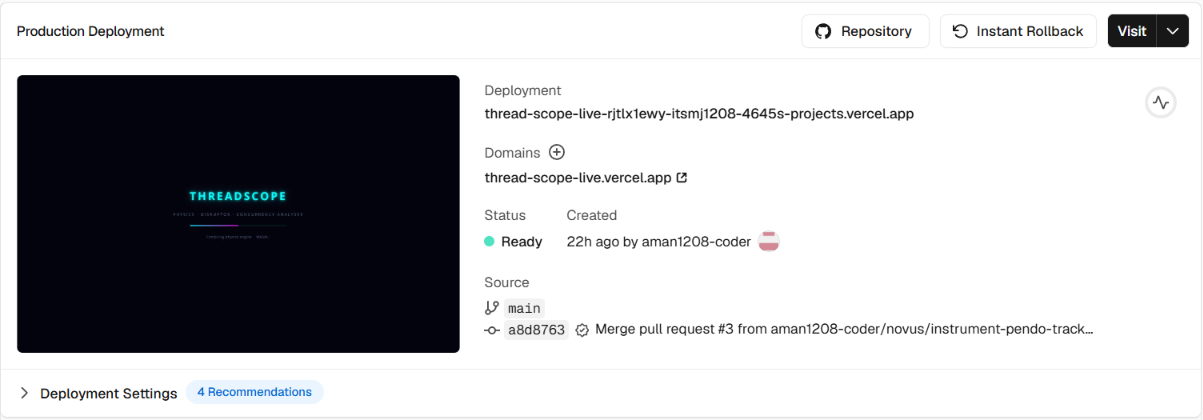
dashboard of vercel deployed frontend
-
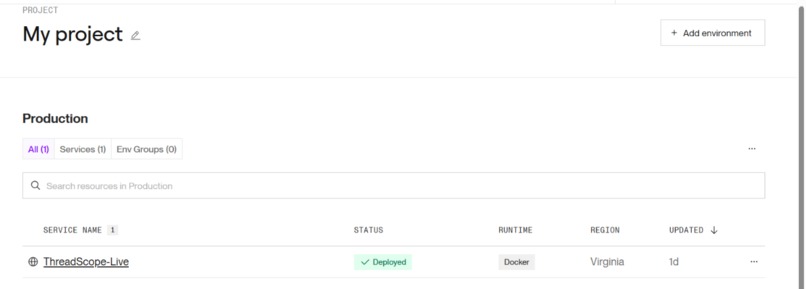
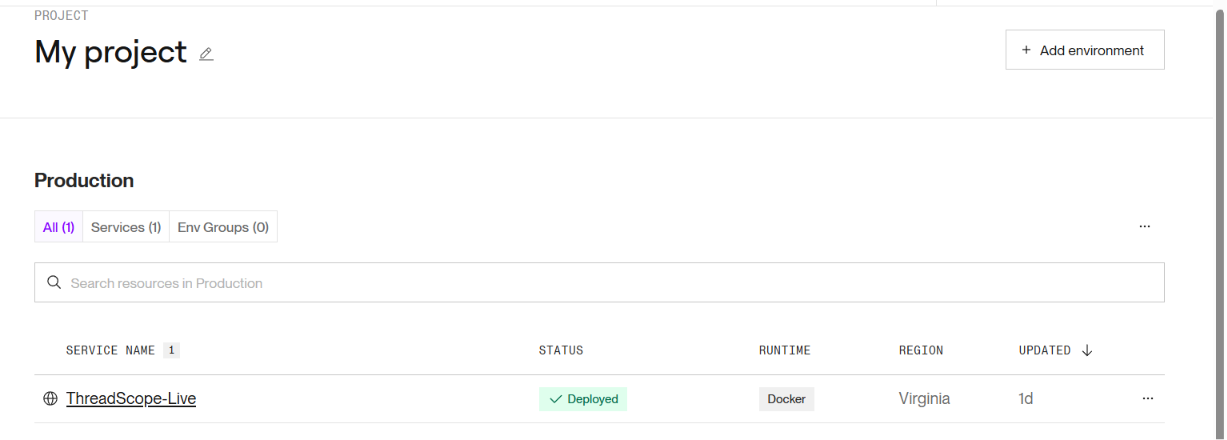
dashboard of render deployed backend
Inspiration
Modern Java applications power banking systems, cloud platforms, and enterprise software used by millions of people every day.
When performance issues occur, engineers often spend hours analyzing logs, thread dumps, and monitoring dashboards to identify the root cause. Existing observability tools provide metrics and alerts, but they rarely explain why a problem is happening.
I wanted to build a solution that could bridge this gap by automatically identifying performance issues and providing clear, actionable explanations.
This idea led to the creation of ThreadScope Live.
What it does
ThreadScope Live is an AI-powered JVM observability platform that helps engineering teams identify and diagnose concurrency-related performance issues in real time.
The platform continuously monitors JVM runtime behavior and automatically detects:
Deadlocks Lock Contention CPU Saturation Memory Pressure Consumer Backpressure
The dashboard provides live visibility into:
Thread Activity Timeline Lock Wait Latency Queue Depth Metrics Throughput Monitoring Thread State Distribution Hot Method Contention Ranking System Health Score AI Root Cause Analysis
Instead of requiring engineers to manually inspect thread dumps and logs, ThreadScope Live analyzes the data, identifies the root cause, and recommends a solution.
Key Features AI Root Cause Analysis
ThreadScope Live doesn't just show metrics—it explains what is happening and why.
Real-Time Monitoring
Live JVM metrics are streamed through WebSockets and visualized instantly.
Interactive Dashboard
A futuristic observability interface visualizes thread activity, lock contention, throughput, queue depth, and runtime behavior in real time.
Live Diagnostics
The platform continuously analyzes JVM behavior and presents actionable insights through a dedicated diagnostics panel.
Chaos Mode
A built-in testing environment intentionally creates concurrency bottlenecks, allowing engineers to observe failures and validate recovery mechanisms safely.
System Health Score
The platform continuously evaluates JVM health and provides a simple indicator of overall system stability.
How we built it
The backend was built using Java and Spring Boot. Real-time communication is handled through WebSockets, allowing JVM metrics to be streamed continuously to the frontend.
For concurrency event processing, we used the LMAX Disruptor pattern to achieve low-latency event handling. The frontend was built with modern web technologies and deployed on Vercel, while the backend was deployed on Render.
The system architecture includes:
Java + Spring Boot backend WebSocket live data streaming LMAX Disruptor event processing REST APIs for monitoring endpoints Vercel frontend deployment Render backend deployment Novus analytics integration
Challenges we ran into
One of the biggest challenges was connecting the frontend and backend across different deployment platforms while maintaining real-time communication. Configuring secure WebSocket connections and production environment variables required several deployment iterations.
Another challenge was designing visualizations that accurately represent concurrency behavior without overwhelming users with information.
Accomplishments that we're proud of
Successfully deployed a real-time JVM observability platform.
Implemented low-latency event streaming architecture.
Built an interactive dashboard for concurrency analysis.
Added Chaos Mode for fault simulation.
Integrated analytics and production monitoring.
Created a polished user experience suitable for both learning and debugging.
What we learned
Through this project, we gained deeper knowledge of:
JVM internals and thread management Real-time systems and WebSockets Event-driven architectures LMAX Disruptor design patterns Cloud deployment and production debugging Observability and performance engineering
What's next for ThreadScope Live
Future development plans include:
AI-powered root cause analysis Historical metrics storage and replay Distributed system monitoring Kubernetes and microservice support Performance anomaly detection Advanced thread dump analysis Team collaboration and alerting features
ThreadScope Live aims to become a developer-friendly observability platform that simplifies understanding complex JVM concurrency behavior and accelerates performance debugging.
Built With
- chaos-engineering
- concurrency-engineering
- css3
- docker
- github
- html5
- java
- javascript
- jvm-monitoring
- lmax-disruptor
- maven
- novus-analytics
- observability
- performance-monitoring
- real-time
- render
- rest-apis
- spring-boot
- spring-websocket
- vercel
- websockets

Log in or sign up for Devpost to join the conversation.